Participe de nossa página de fãs
Coloque um link para ele, e permita que outras pessoas também o avaliem
Avalie seu funcionamento no terminal MetaTrader 5
- Publicado por:
- Visualizações:
- 107135
- Avaliação:
- Publicado:
- Atualizado:
-
 Você está perdendo oportunidades de negociação:
- Aplicativos de negociação gratuitos
- 8 000+ sinais para cópia
- Notícias econômicas para análise dos mercados financeiros
Registro LoginVocê concorda com a política do site e com os termos de uso
Se você não tem uma conta, por favor registre-se -
 Precisa de um robô ou indicador baseado nesse código? Solicite-o no Freelance
Ir para Freelance
Precisa de um robô ou indicador baseado nesse código? Solicite-o no Freelance
Ir para Freelance

Changelog:
- Version 1.07: Trendline can be handled by the script (alert and color). Set ON by default.
- Version 1.06: You can move the label of a line (just double click and move it). Alert message change.
- Version 1.05: You can set 2 styles of line and the width.
- Version 1.04: Code improvements by pwalkz.
- Version 1.03: Bug correction on the line style.
- Version 1.02: Bug correction on alert.
How to use:
Put your mouse cursor where you need to create a line and push "A" key (if you keep the default key), the line will be created automatically, you can do it as many times as you need.
The lines are drawn with the color and style you choose in parameters.
By default, when the price crosses a line you will receive an alert, or a smartphone notification as you like.
Now you can use a secondary line. So you can use the first line for heavy resistance and support and the second one for alert or small resistance and support. If you want more, I can add more.
- This tools helps you create horizontal lines by just pushing one key on the keyboard, the line will appear at the mouse position.
- You can create as many lines as you want.
- You can choose two colors, one for the support line and the other for the resistance line.
- You can delete easily the last line by a key stroke, you can delete as many lines as you want.
- You can choose to set alarm, when a support or a resistance line is crossed, the indicator will send an alarm on the screen or to your smartphone if you have activated push notifications.
- You can use the same windows to see different chart, the indicator automatically hides support and resistance from other symbol and show it again when you come back to the first symbol.
- The color of the line is automatically chosen, if it's over the market price, it gets a resistance line color, if it's under the market price, it gets a support line color.
- You can see the price of the mouse position in the top left as comment, or you can choose to see it in a floating box.
- On the line, you will see the number of pip separating the line and the actual price. If you put your mouse over it, you will see the price.
- By clicking on the label of the line, you can see the number of times the line was used as Support or Resistance and the number of time it has been crossed; you can choose the number of history. By default it's 200, that means 200 candles in your timeframe, so it can be 200 minutes in M1 or 200 months in MN. You can increase the 200 history if you want. I tried 2000, and it works well. If the candle stops at less than 10 Pips it will appear in the history of support and resistance, but you can change this number in MaxDeviation.
Parameters:
extern string  LineHorizontal="A";              //Key to Create a SR Line (1)
extern color   LineResistcolor=clrDodgerBlue;   //Resistance Line Color (1)
extern color   LineSupportcolor=clrDarkOrange;  //Support Line Color (1)
extern ENUM_LINE_STYLE  LineStyle=STYLE_SOLID;  //Style of SR Lines (1)
extern int     Linewidth=1;                     //Choose the width of the line (1)

extern string  LineHorizontalSecond="Q";              //Key to Create a SR Line (2)
extern color   LineResistcolorSecond=clrDodgerBlue;   //Resistance Line Color (2)
extern color   LineSupportcolorSecond=clrDarkOrange;  //Support Line Color (2)
extern ENUM_LINE_STYLE  LineStyleSecond=STYLE_DOT;    //Style of SR Lines (2)
extern int     LinewidthSecond=1;                     //Choose the width of the line (2)
extern bool    TakecareManualTrendline=true;          //Take care of your Trendline added manually

extern string  DeleteLastLine="X";                  //Key to Delete Last SR Line
extern bool    AlarmCrossWhithAlert=true;           //Send an Alert
extern bool    AlarmCrossWhithPushSmartphone=true;  //Send a Notification

extern bool    MagnetLinePriceOnFullPip = true; //To make a line at 1.1500 even if the mouse is at 1.15002
extern double  DefaultLotSize=0.1;              //Lot Size to Calc Money Values
extern int     history=200;                     //Number of candles to check, could be 200 minutes or 200 weeks depending on your timeframe
extern int     MaxDeviation=10;                 //If the candle stops at less than 10 pips it will appear in the history of support and resistance
extern color   Textcolor=clrRed;                //Color of mouse position and history
extern bool    Commentornot=true;               //You can choose to see mouse and history of support/resistance in the comment or in positionable label
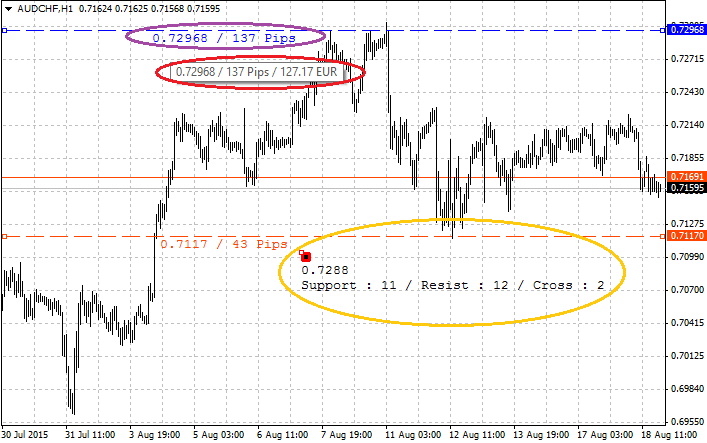
You can see in purple the number of pips separated from the actual price, if you put your mouse on the label or the line, it will show you the value by using your default lot size.
In yellow, you can see the floating box, you can move around the information of mouse price and history in your chart. You can see by clicking in the label of a line the history of the line.
In the blue circle, you can see the price at your mouse cursor position. The line have been created in few seconds, the style and the color are changed automatically.

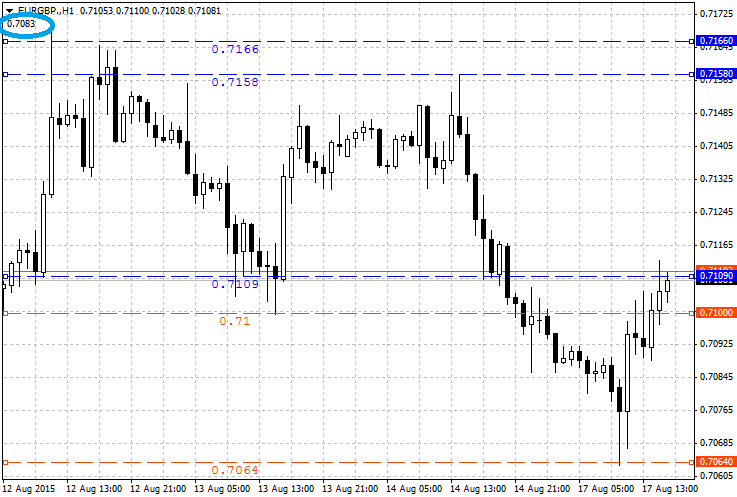
In this example, you can see that the line 0.71 has color change when the price goes under, and an alert have been send via MetaTrader alert box. But you can choose to have smartphone notification or both.
If you have other idea, you can share it.
 RSI EA
RSI EA based on overbought and oversold levels.
Personal Assistant - The Next Generation
Personal Assistant The Next Generation is there to make your trading easy, basically it does what a real assistant does — provides information and executes your orders.
 Flag and Pennant patterns
This indicator shows Flag and Pennant patterns.
 MySQL library for MQL4 with proper memory management
Library provides functions for management of MetaTrader 4 to MySQL database connections. Fixed memory allocation and release problems of the original library.