 MetaTrader 5
 Experts
 Indicadores
 Scripts
 Bibliotecas
 Repositório
Assista a como baixar robôs de negociação gratuitos
Encontre-nos em Twitter!
Participe de nossa página de fãs
Participe de nossa página de fãs
Script interessante?
Coloque um link para ele, e permita que outras pessoas também o avaliem
Coloque um link para ele, e permita que outras pessoas também o avaliem
Você gostou do script?
Avalie seu funcionamento no terminal MetaTrader 5
Avalie seu funcionamento no terminal MetaTrader 5
- Publicado por:
- Visualizações:
- 21692
- Avaliação:
- Publicado:
- Atualizado:
-
 Você está perdendo oportunidades de negociação:
- Aplicativos de negociação gratuitos
- 8 000+ sinais para cópia
- Notícias econômicas para análise dos mercados financeiros
Registro LoginVocê concorda com a política do site e com os termos de uso
Se você não tem uma conta, por favor registre-se -
 Precisa de um robô ou indicador baseado nesse código? Solicite-o no Freelance
Ir para Freelance

Real author:
TrendLaboratory
The Dots indicator is based on an indicator developed by TrendLaboratory in 2006. The indicator shows current trend direction by placing colored dots on the main chart. Blue dots indicate an uptrend, red dots indicate a downtrend.
Although the indicator calculation is not based on standard MetaTrader platform indicators, it uses the iMA (Moving Average) function to get prices of a specified type (Open, Close, Maximum, Minimum, Typical etc.). The calculation is based on cosine of a price change angle. The user can set several input parameters.
Input Parameters:
- Length (by default = 10) — indicator period. The higher this value, the higher the time lag, and the fewer false signals are displayed.
- AppliedPrice (by default = PRICE_CLOSE) — price type to use in calculations.
- Filter (by default = 0) — useful parameter allowing to filter price surges without adding display lags.
- Deviation (by default = 0) — vertical indicator shift.
- Shift (by default = 0) — horizontal indicator shift.
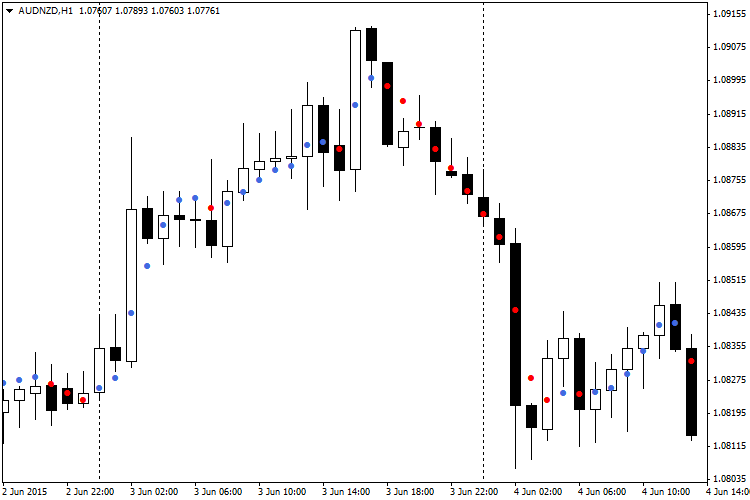
Recommendations:
- Recommended strategy is to wait for 2 identical dots and open positions by trend. Unfortunately, sometimes it fails. A suitable alternative would be to use one dot as a signal with Filter parameter set as Spread x 3.
Traduzido do russo pela MetaQuotes Ltd.
Publicação original: https://www.mql5.com/ru/code/13179
 WRB
The indicator detects and marks the WRB (Wide Range Bars) or candlesticks with Wide Range Bodies.
Divergence Petr
The indicator of divergences on 30 oscillators of choice.
Easy Trend Visualizer
A simple visualizer of trends.
GainLossInfo
Shows the current gain and loss for the candlesticks on the chart.