Anon Candra N
Anon Candra N
  • 정보
3 년도
경험
27
제품
5
데몬 버전
0
작업
0
거래 신호
0
구독자
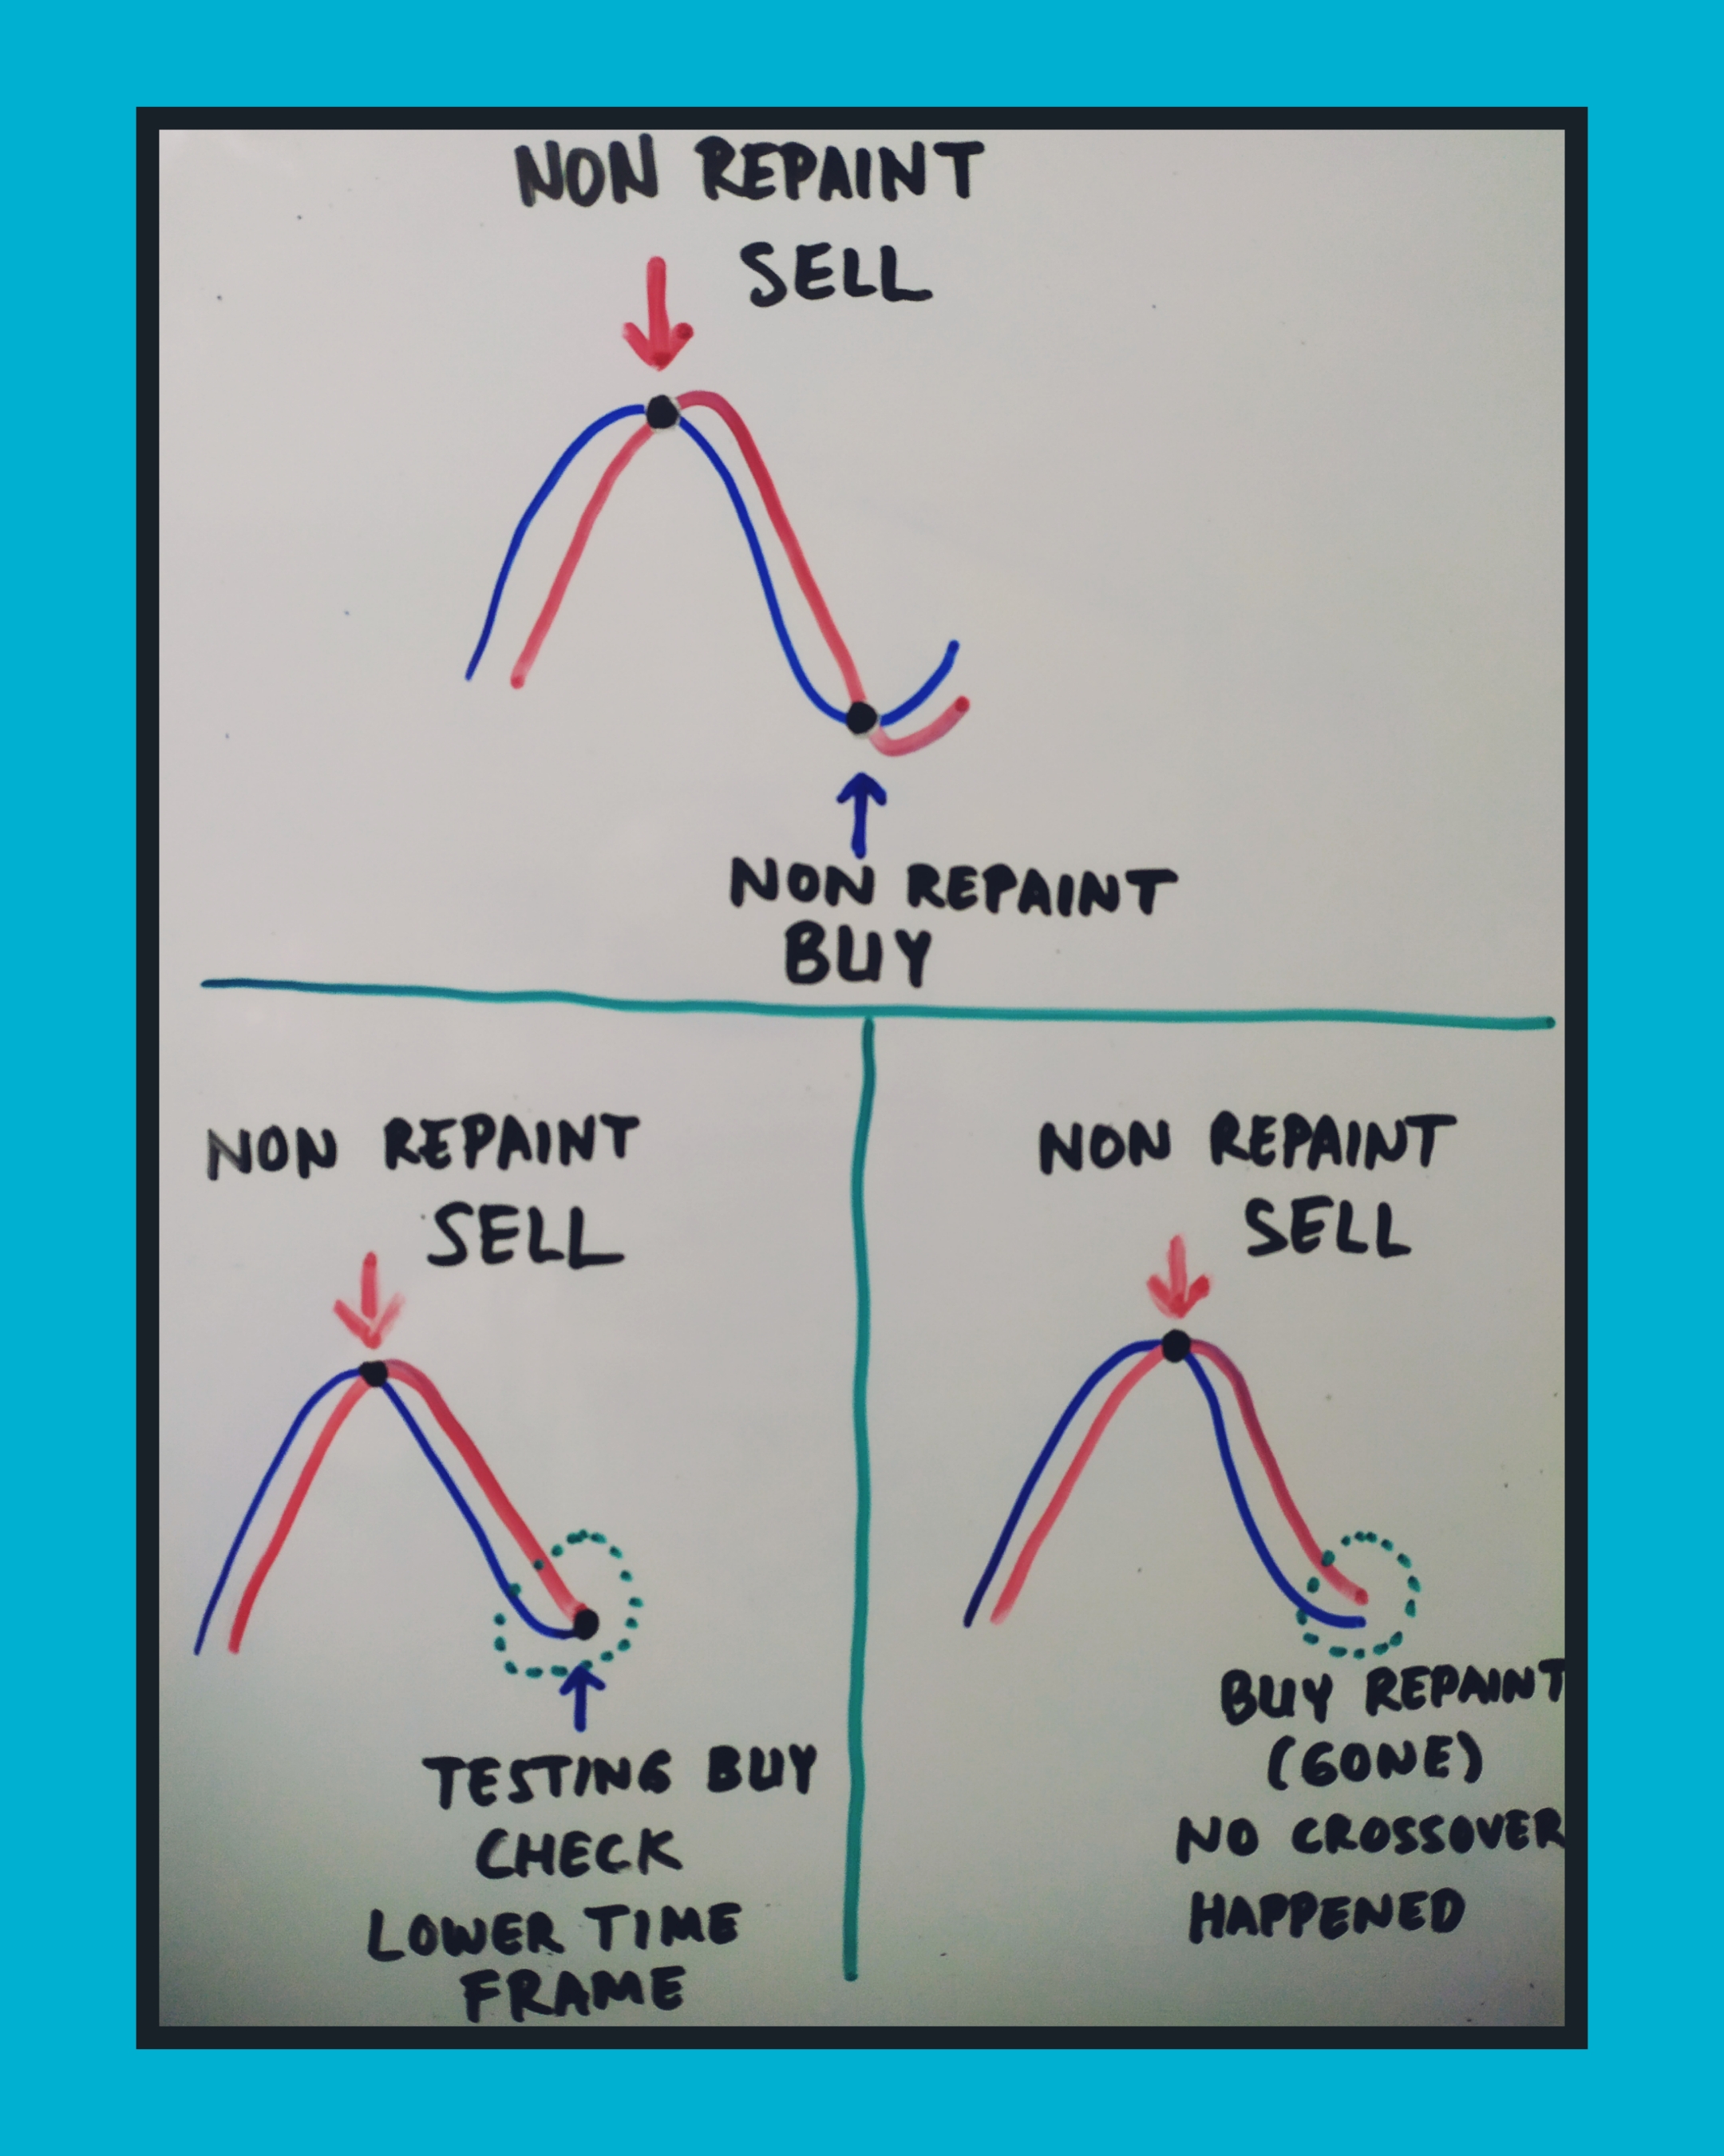
I am a professional trader who has been in the stock market for several years. After making in-depth observations of the stock market, I developed the trading tools that have helped my trading career so far. The good news is, you can have these trading tools on this website.
Anon Candra N 출시돈 제품

Looking for a trading tool based on the moving average indicator that can display crossovers arrows on all time frames? Introducing trading indicator : All Time Frame Two MA Model S ready to help you achieve daily profits. This tool is created using the intersection of two moving average indicator lines: the main MA1 and the signal MA2. Using this tool makes it easier to observe the real-time dashboard and intersections of multiple timeframes simultaneously. Viewing both higher and lower

Anon Candra N 출시돈 제품

Looking for a trading tool based on the moving average indicator that can display crossovers arrows on all time frames? Introducing trading indicator : All Time Frame Two MA Model T ready to help you achieve daily profits. This tool is created using the intersection of two moving average  indicator lines: the main MA1 and the signal MA2. Using this tool makes it easier to observe the real-time dashboard and intersections of multiple timeframes simultaneously. Viewing both higher and lower

Anon Candra N 출시돈 제품

Looking for a trading tool based on the RSI indicator that can display crossovers arrows on all time frames? Introducing trading indicator : All Time Frame Double RSI Model S ready to help you achieve daily profits. This tool is created using the intersection of two RSI (Double RSI) indicator lines: the main RSI and the signal RSI. Using this tool makes it easier to observe the real-time dashboard and intersections of multiple timeframes simultaneously. Viewing both higher and lower timeframes

Anon Candra N 출시돈 제품

Looking for a trading tool based on the RSI indicator that can display crossovers arrows on all time frames? Introducing trading indicator : All Time Frame Double RSI Model T ready to help you achieve daily profits. This tool is created using the intersection of two RSI (Double RSI) indicator lines: the main RSI and the signal RSI. Using this tool makes it easier to observe the real-time dashboard and intersections of multiple timeframes simultaneously. Viewing both higher and lower timeframes

Anon Candra N 출시돈 제품

Looking for a trading tool based on the Stochastic indicator that can display crossovers arrows on all time frames? Introducing trading indicator : All Time Frame Stochastic Model S ready to help you achieve daily profits. This tool is created using the intersection of two indicator lines of Stochastic  : the main Stochastic and the signal Stochastic . Using this tool makes it easier to observe the real-time dashboard and intersections of multiple timeframes simultaneously. Viewing both

Anon Candra N 출시돈 제품

Looking for a trading tool based on the Stochastic indicator that can display crossovers arrows on all time frames? Introducing trading indicator : All Time Frame Stochastic Model T ready to help you achieve daily profits. This tool is created using the intersection of two indicator lines of Stochastic  : the main Stochastic  and the signal Stochastic . Using this tool makes it easier to observe the real-time dashboard and intersections of multiple timeframes simultaneously. Viewing

Anon Candra N 출시돈 제품

Looking for a trading tool based on the MACD indicator that can display crossovers arrows on all time frames? Introducing trading indicator : All Time Frame MACD Model S ready to help you achieve daily profits. This tool is created using the intersection of two indicator lines of MACD : the main MACD and the signal MACD. Using this tool makes it easier to observe the real-time dashboard and intersections of multiple timeframes simultaneously. Viewing both higher and lower timeframes

Anon Candra N 출시돈 제품

Looking for a trading tool based on the MACD indicator that can display crossovers arrows on all time frames? Introducing trading indicator : All Time Frame MACD Model T ready to help you achieve daily profits. This tool is created using the intersection of two indicator lines of MACD : the main MACD and the signal MACD. Using this tool makes it easier to observe the real-time dashboard and intersections of multiple timeframes simultaneously. Viewing both higher and lower timeframes

Anon Candra N 출시돈 제품

Looking for a trading tool based on the CCI indicator that can display crossovers arrows on all time frames? Introducing trading indicator : All Time Frame Double CCI Model S ready to help you achieve daily profits. This tool is created using the intersection of two CCI (Double CCI) indicator lines: the main CCI and the signal CCI. Using this tool makes it easier to observe the real-time dashboard and intersections of multiple timeframes simultaneously. Viewing both higher and lower timeframes

Anon Candra N 출시돈 제품

Looking for a trading tool based on the CCI indicator that can display crossovers arrows on all time frames? Introducing trading indicator : All Time Frame Double CCI Model T ready to help you achieve daily profits. This tool is created using the intersection of two CCI (Double CCI) indicator lines: the main CCI and the signal CCI. Using this tool makes it easier to observe the real-time dashboard and intersections of multiple timeframes simultaneously. Viewing both higher and lower timeframes

Anon Candra N
Anon Candra N
Welcome November 2025.
Hope you remain enthusiastic in achieving financial success.
Always bear in mind that your own resolution to succeed is more important than any other.
This month, I give you special discount.
Eliminate emotional trading and trade with confidence.
Monitor real time dashboard.
Monitor crossover lines visually.
Download today.
And start learning.
Anon Candra N
Anon Candra N
Hello customers, here I provide a good sell signal tutorial using best combo 5MA + 5RSI :

This is an example of a good sell signal.
If you patiently observe the 5MA and 5RSI dashboards and wait for the right moment,
you can multiply your trading capital many times over in just one day.
Pay attention to the 5MA:
- MA 1 is < MA 2 on the M1 to H4 timeframes, and even D1, the same position.
- MA 1's color has decreased from M1 to D1.
- MA 2's color has almost all decreased from M1 to H4.
- MA 3's position has < MA 4 on the M1 to M30 timeframes, and even H1, the same position.
- MA 3's color has decreased from M1 to H4.
- MA 4's color has decreased from M1 to M15, and then also H1.
- MA 5's color has decreased from M1 to H4.

Pay attention to the 5RSI:
- RSI 1 is < RSI 2 on the M1 to H4 timeframes, and even D1, the same position.
- RSI 1's color has decreased from M1 to D1.
- RSI 2's color has almost all decreased from M1 to H4.
- RSI 3's position has < RSI 4 on the M1 to H4 timeframes, and even D1, the same position.
- RSI 3's color has decreased from M1 to D1.
- RSI 4's color from M1 to H4 is almost always down.
- RSI 5's color is down from M1 to H4, even D1 is also down.

Patience is key.
“The market is a device for transferring money from the impatient to the patient.” – Warren Buffett
Anon Candra N
Anon Candra N
Hello customers, here I provide a good buy signal tutorial using best combo 5MA + 5RSI :

This is an example of a good buy signal.
If you patiently observe the 5MA and 5RSI dashboards and wait for the right moment,
you can multiply your trading capital many times over in just one day.
Pay attention to the 5MA:
- The position of MA 1 > MA 2 on the M1 to H4 timeframes, and even D1, is the same.
- The color of MA 1 rises from M1 to D1.
- The color of MA 2 rises from M1 to M15, then also on H1.
- The position of MA 3 > MA 4 on the M1 to M30 timeframes, even on H1, H4, and D1, is the same.
- The color of MA 3 rises from M1 to D1.
- The color of MA 4 rises from M1 to M15, then also on H1.
- The color of MA 5 rises from M1 to H4, and even on D1.

Pay attention to the 5RSI:
- The position of RSI 1 > RSI 2 on the M1 to H4 timeframes, and even on D1, is the same.
- The color of RSI 1 rises from M1 to D1.
- The color of RSI 2 rises from M1 to M15, then also on H1.
- The position of RSI 3 > RSI 4 on the M1 to H4 timeframes, and even on D1, is the same.
- RSI 3 color rose from M1 to D1
- RSI 4 color rose from M1 to M15, then also on H1
- RSI 5 color rose from M1 to H4, even on D1.

Patience is key.
“The market is a device for transferring money from the impatient to the patient.” – Warren Buffett
Anon Candra N
Anon Candra N
Hello trader, new version available:
1) MTF NRPA 5MA RTD V 2.00
2) MTF NRPA 5RSI RTD V 1.90
- Added on chart lines parameter scheme
- Added on chart lines time frame scheme
- Added trend bar parameter scheme
- Added trend bar time frame scheme
- Customizing arrow distance
Anon Candra N
Anon Candra N
I need to clarify once again. The market is highly volatile. You should check all time frames. Most of my trading tool is based on the crossover of two lines. Current arrow can repaint (because of price action) but previous arrow will not. It built market structure. You should be patient and check whether the intersection is just a test or valid crossover. If you can't be patient, maybe trading isn't your career.
Anon Candra N
Anon Candra N
The new month has arrived. So is the new year 2025. After busy coding, the new version is finally finished. Feel the power of triple confluence that combines higher time frames with lower time frames. Download this trading indicator that has been tested and updated many times now. I am sure this tool will be very useful to increase confidence when opening a position. Let's make profit together!
Anon Candra N
Anon Candra N
My daily routine : Scan the market first!
Enjoy special offer from me.
#dashboard #multicurrency #multitimeframe
Anon Candra N 출시돈 제품

이 거래 도구를 사용하면 15개 시장을 동시에 스캔할 수 있습니다. 2024년 새로운 거래 지표 소개: ➡️ 대시보드 다중 통화 다중 시간 프레임 이중 RSI. 제가 이 거래 도구를 만든 이유는 최소한 두 가지입니다. 첫째, 하나의 시장만 관찰하는 것이 지루합니다. 둘째, 다른 시장에 진입하는 순간을 놓치고 싶지 않습니다. 그렇기 때문에 동시에 다른 시장 상황도 알고 싶습니다. 이러한 이유로 여러 시장의 상황을 동시에 스캔할 수 있는 스캐너가 필요합니다. 나는 종종 빠른 RSI 라인 > (또는 <=) 느린 RSI 라인이 M1에서 H4(또는 단지 M1에서 M30)까지 시작하는 시장을 찾습니다. 그리고 M1부터 M30까지 과매도/과매수 상태인 시장을 자주 찾아봅니다. 내 분석에 동의하신다면 이것이 바로 귀하가 찾고 있던 거래 지표입니다. 시장 상황이 위의 요구 사항을 충족하는 순간을 놓치지 마십시오. 이것은 많은 훌륭한 기능을 갖춘 확률론적 스캐너 또는 대시보드입니다. 빠른

Anon Candra N 출시돈 제품

이 거래 도구를 사용하면 15개 시장을 동시에 스캔할 수 있습니다. 2024년 새로운 거래 지표 소개: ➡️ 대시보드 다중 통화 다중 시간 프레임 이중 CCI. 제가 이 거래 도구를 만든 이유는 최소한 두 가지입니다. 첫째, 하나의 시장만 관찰하는 것이 지루합니다. 둘째, 다른 시장에 진입하는 순간을 놓치고 싶지 않습니다. 그렇기 때문에 동시에 다른 시장 상황도 알고 싶습니다. 이러한 이유로 여러 시장의 상황을 동시에 스캔할 수 있는 스캐너가 필요합니다. 나는 종종 빠른 CCI 라인 > (또는 <=) 느린 CCI 라인이 M1에서 H4(또는 단지 M1에서 M30)까지 시작하는 시장을 찾습니다. 내 분석에 동의하신다면 이것이 바로 귀하가 찾고 있던 거래 지표입니다. 시장 상황이 위의 요구 사항을 충족하는 순간을 놓치지 마십시오. 이것은 많은 훌륭한 기능을 갖춘 확률론적 스캐너 또는 대시보드입니다. 빠른 CCI 라인의 데이터를 표시할 수 있습니다. 느린 CCI 라인의 데이터를

Anon Candra N 출시돈 제품

15 years old, 15 years old, 15 years old. 2024 years ago: ➡️ What to do next. I want to know what I want to know. Sorry, I don't know what to do. I want to know, I want to know, I want to know. I want to know what I want to know. I want to know what I want to know. H4(단지 M1에서 M30) I'm here. I'm here. I want to know what I want to know. I want to know what I'm saying. I want to know what I want to know. I want to know what I want to know. I want to know what I want to know. I want to know what