MTF Precise Price Action Arrow Filtered Model S

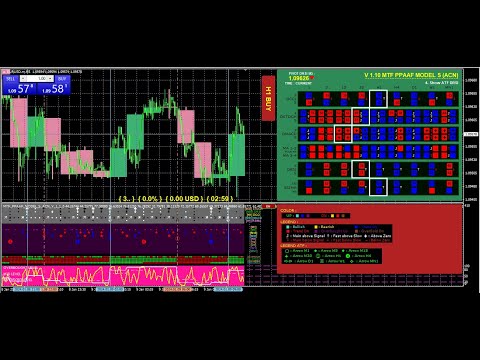
Introducing the advanced trading tools of 2023.

MTF PPAAF Model S.

This is sub window version of my best trading tool : MTF Precise Price Action Arrow Filtered. 

Click here to learn more about MTF PPAAF.

This trading tool is equipped with various powerful features :

  1. MTF = Multi Time Frame = Time Frame can be changed.
  2. On/off button.
  3. Non Repaint Arrows. 
  4. Customizable parameter, color etc. 
  5. Can show all time frame (ATF) crossover arrows of fast stochastic main line & fast stochastic signal line (mode number 1).
  6. Can show all time frame (ATF) crossover arrows of fast macd main line & fast macd signal line (mode number 2).
  7. Can show all time frame (ATF) crossover arrows of moving average 1 & moving average 2 line (mode number 3).
  8. Can show all time frame (ATF) crossover arrows of fast RSI & slow RSI line (mode number 4).
  9. Can show all time frame (ATF) crossover arrows of RSI and MA (mode number 5).
  10. Can show all time frame (ATF) crossover arrows of fast CCI and slow CCI (mode number 6).
  11. Can show selected time frame (STF) trend following arrow of fast stochastic main line x fast stochastic signal line.
  12. Can show selected time frame (STF) trend following arrow of fast RSI line x slow RSI line.
  13. Can show selected time frame (STF) trend following arrow of fast CCI line x slow CCI line.
  14. Can show selected time frame (STF) trend following arrow of fast macd main line x fast macd signal line.
  15. Can show selected time frame (STF) trend following arrow of RSI line x MA line.
  16. MTF trendbar of dual stochastic.
  17. MTF trendbar of dual double RSI.
  18. MTF curve of dual stochastic. 
  19. MTF curve of dual double RSI.
  20. Pivot level.
  21. Replay system.
  22. Candle high time frame.
  23. Beautiful 20 dashboard color scheme.
  24. Beautiful 11 ATF color scheme.
  25. OBOS line scheme. 
  26. TSPI = Time Spread Profit Info.
  27. Vertical lines trading in the zone (new V 1.10).
  28. Status quo trading in the zone (new V 1.10).

This trading tool has gone through various in-depth research.

I am sure this tool will help you become a pro trader and achieve financial success.

Download it now.

Thank you.

#priceaction #tradingtool #stochrsi #rsiindicator #stochastic #macd #cci #movingaverage #rsima #dashboardtrading 


추천 제품
Mongol Indicator2
Sumiyabazar Buyanjargal
It's a variation of mid of HH and LL since it compares the higher of HH or LL against a period and twice the number of bars back to avoid whipsaws. I used to display this against lines on a chart, but made a histogram out of it and it looks interesting. It looks good at gauging trend strength and general turns (see image below). The name of the indicator is BAM, which is an acronym for "Below and Above Mid". Ways to use it: 1. To see general trend on longer TFs (more than 30 bars back).
Using multiple timeframes for analysis with Multi Timeframe Average Directional Index  can provide several significant benefits for traders: Comprehensive Market View: By applying Mtf ADX Standard across different timeframes, traders gain a broader perspective on market dynamics. This allows them to identify trends, patterns, and potential reversal points that might be more apparent or consistent across various scales. Enhanced Pattern Recognition: Multiple timeframes help in identifying repeati
FREE
Global Trend
Vitalii Zakharuk
Global Trend Indicator, shows the signals for entry. Displays both entry points and the trend itself. Shows statistically calculated moments for entering the market with arrows. When using the indicator, the risk factor can be optimally distributed. Settings: Uses all one parameter for settings. Choosing a parameter, it is necessary to visually resemble it so that the appropriate graph has a projection of extremes. Parameters: Length - the number of bars for calculating the indicator. Use
Pair Trading Strategy Based on Spearman Correlation and Stationary Z-Score  is A single-pair indicator focusing on one primary symbol (chart symbol) and one secondary symbol for the MetaTrader 4 (MT4) platform, designed to support pairs trading by analyzing the correlation between two currency pairs. It employs Spearman’s rank correlation coefficient, Z-Score calculations, and stationarity testing to generate trading signals, displayed in a subwindow and on the main chart. The indicator integra
A technical indicator that displays information about the trading volume in the form of a histogram of distribution by price levels. It is used as an independent indicator that helps to evaluate the current objective situation of the instrument, as well as in the format of integration with other methods of analysis, to confirm or filter when making trading decisions. Key Features: Interactive profile update, real-time work Five modes of histogram calculation The possibility of separating the vol
The trader uses the Trend for Neuro indicator to determine the market situation. This is a trending algorithm that is convenient to download, install and use. The algorithm with acceptable accuracy generates input signals and output levels. Strategy for trend trading, filtering and all the necessary functions built into one tool! By launching the indicator, the user will see only two types of arrows that can change color to blue during an uptrend, to red during a downtrend there is no uncertaint
Binary Option Signal
Yaroslav Varankin
Indicator for binary options arrow is easy to use and does not require configuration works on all currency pairs, cryptocurrencies buy signal blue up arrow sell signal red down arrow tips do not trade during news and 15-30 minutes before their release, as the market is too volatile and there is a lot of noise it is worth entering trades one or two candles from the current period (recommended for 1 candle) timeframe up to m 15 recommended money management fixed lot or fixed percentage of the depo
Linear Trend Predictor - 진입 지점과 방향성 지원선을 결합한 추세 지표입니다. 고가/저가 채널을 돌파하는 원칙에 따라 작동합니다. 지표 알고리즘은 시장 노이즈를 걸러내고 변동성과 시장 역학을 고려합니다. 표시기 기능  평활화 방법을 사용하여 시장 추세와 BUY 또는 SELL 주문을 시작하기 위한 진입 시점을 보여줍니다.  모든 기간의 차트를 분석하여 단기 및 장기 시장 움직임을 파악하는 데 적합합니다.  어떠한 시장과 시간대에도 적용할 수 있으며, 입력 매개변수를 통해 거래자는 자신에게 맞게 지표를 독립적으로 사용자 지정할 수 있습니다.  설정된 지표 신호는 사라지거나 다시 그려지지 않습니다. 이는 캔들 마감 시 결정됩니다.  여러 유형의 알림이 화살표와 결합되어 있습니다.  이 지표는 독립적인 거래 시스템으로 사용할 수도 있고, 다른 거래 시스템에 추가하는 용도로도 사용할 수 있습니다.  모든 수준의 경험을 가진 거래자가 사용할 수 있습니다. 주요 매
PTW NON REPAINT TRADING SYSTEM + HISTOGRAM Non-Repainting ,   Non-Redrawing   and   Non-Lagging  Trading System. Does the following: - Gives Accurate Entry and Exit Points - Scalping, Day and Swing Trading  - 95% Accuracy  - Targets, where to take profits. - Shows Trends, Support and resistance levels - Works on All Brokers - Works on All Currencies, CFDs and Stocks - It does not place trades for you, it only shows you what trades to place. - It works on All Timeframes - It is for Trend or ran
**바이너리 스마트 시스템 소개: 귀하의 궁극적인 트레이딩 파트너** 바이너리 스마트 시스템은 단순히 인디케이터가 아닙니다. 이는 정교한 트레이딩 도구로, 다양한 시장에서 핀포인트 정확도와 적시의 신호를 제공하여 트레이더에게 성공을 이끌어주는 데 주안점을 둔 것입니다. 혁신적인 알고리즘과 다양한 기술적 지표의 철저한 컬렉션을 기반으로 구축된 이 시스템은 트레이딩 성공을 얻기 위한 열쇠입니다. **인디케이터 구성 요소:** 1. **이동 평균 비율 (MAP):** 이 구성 요소는 다양한 이동 평균의 가중 평균을 계산하여 추세 식별을 위한 강력한 기준을 형성합니다. MAP은 시장 상황에 동적으로 적응하여 현재 추세 방향을 파악하는 정보를 제공합니다. 2. **상품 채널 지수 (CCI):** 평균 가격으로부터의 편차를 분석함으로써 CCI는 과매수 및 과매도 조건을 판단합니다. 바이너리 스마트 시스템의 CCI 통합은 잠재적인 반전 지점을 식별하는 종합적인 접근을 보장합니다. 3.
Discover the Power of Trend Strength Pro Unlock a new level of clarity in your trading with Trend Strength Pro , the ultimate tool for visualizing market momentum. Stop guessing and start seeing the true strength of a trend with a single glance. Our elegant and intuitive indicator helps you make smarter, more confident trading decisions. Key Advantages & Features Instantly See Trend Strength : Our color-coded histogram tells you whether the trend is getting stronger or weaker. Green means moment
FREE
First time on MetaTrader, introducing IQ Star Lines - an original Vedic Astrology based indicator. "Millionaires don't use astrology, billionaires do" . - J.P. Morgan, Legendary American financier and banker. IQ Star Lines, an unique astrological indicator purely based on   Vedic astrology   calculations, published for the   first time on Metatrader.  This unique tool plots dynamic planetary grid lines based on real-time stars, constellations, and celestial movements, which allows you to plot t
Free Lotus
Christophe Godart
Due to the huge success of the limited free version, the now low priced LOTUS version will continue being updated in the future. Optimal for Binary Options and Forex. For beginners and intermediates. Lotus is 100% non repaint. The strategy is based on 4 ADX parameters, including pivot points and candle patterns.  It is recommendable to combine the arrow with an moving average, Elliot waves indicator or Parabolic SAR. The main goal was to  keep it as simple as possible ! No useless oscillators.
DTFX Algo Zones are auto-generated Fibonacci Retracements based on market structure shifts. These retracement levels are intended to be used as support and resistance levels to look for price to bounce off of to confirm direction.   USAGE Figure 1 Due to the retracement levels only being generated from identified market structure shifts, the retracements are confined to only draw from areas considered more important due to the technical Break of Structure (BOS) or Change of Character (CHo
Forex Gump
Andrey Kozak
2.4 (5)
Forex Gump is a fully finished semi-automatic trading system. In the form of arrows, signals are displayed on the screen for opening and closing deals. All you need is to follow the instructions of the indicator. When the indicator shows a blue arrow, you need to open a buy order. When the indicator shows a red arrow, you need to open a sell order. Close orders when the indicator draws a yellow cross. In order to get the most effective result, we recommend using the timeframes H1, H4, D1. There
Boba Binary
Anthonius Soruh
5 (1)
Result look on  https://t.me/BonosuProBinary Pair : All Forex Pairs Time Frame : M1 Expaired : 1-2 Minutes Trade Time Once Time a Day Backtester, Alert Avaliable Average Signals Generate 5 - 20 Signals All Pair A Day Broker Time Zone GMT+3 Default Setting [Example Broker GMT+3 : Alpari, FBS, XM] Support Broker : Deriv, IQOption, Alpari, Binomo, Olymtrade, Qoutex, GCoption, etc Support Auto Trading : MT2 Trading, Binary Bot, Intrade Bot, Binomo Bot, Olymptrad Bot, MX2 trading, Price Pro, etc Ind
Cota Binary
Anthonius Soruh
5 (2)
Result look on  https://t.me/BonosuProBinary Pair : All Forex Pairs Time Frame : M1 Expaired : 1-2 Minutes Trade Time Once Time a Day Backtester, Alert Avaliable Average Signals Generate 5 - 20 Signals All Pair A Day Broker Time Zone GMT+3 Default Setting [Example Broker GMT+3 : Alpari, FBS, XM] Support Broker : Deriv, IQOption, Alpari, Binomo, Olymtrade, Qoutex, GCoption, etc Support Auto Trading : MT2 Trading, Binary Bot, Intrade Bot, Binomo Bot, Olymptrad Bot, MX2 trading, Price Pro, etc Ind
Binary Smart Eye
Ramzi Abuwarda
"Binary Smart Eye" MT4 지표는 바이너리 옵션 및 외환 시장 모두에 거래 신호를 제공하도록 설계되었으며, M1에서 W1까지 광범위한 시간 프레임에서 작동합니다. 추세 수준, 지능형 이동 평균 및 최적화된 거래 기간을 결합한 독점적인 전략을 사용하여 잠재적인 진입점을 식별합니다. 주요 기능에 대한 분석은 다음과 같습니다. 다중 시간 프레임 분석: 지표의 다용도성은 트레이더가 다양한 시간 프레임에서 이를 활용하여 M1의 스캘핑부터 W1의 장기 추세 추종까지 다양한 거래 스타일에 맞출 수 있도록 합니다. 독점 전략: "Binary Smart Eye"의 핵심은 다음을 활용하는 고유한 전략에 있습니다. 추세 수준: 이러한 수준은 주요 시장 추세 및 잠재적인 반전 지점을 식별하는 데 도움이 됩니다. 지능형 이동 평균: 시장 변동성에 적응하고 정확한 추세 방향을 제공하는 사용자 정의 이동 평균입니다. 스마트 거래 기간: 지표는 최적의 시장 조건을 포착하기 위해 특정 시간 기간을
NN8D Points
Aleksandr Nikolskii
NN8D Points is one of the indicators included into NN8D ( N ikolsky's N esting D oll) trading system. NN8D Points is an indicator containing multiple tools for analyzing Forex market: candle analysis and area system. Rather than simply averaging by Open, Close, High and Low prices, NN8D Points performs a complex analysis of the current and previous bars by various parameters: bar color; bar body size; bar wicks; bar core (average value between Open and Close, as well as between Lows and Highs);
Platinum FX
Dmitriy Kashevich
Platinum FX индикатор для скальпинга. идеально подходит для торговли бинарными опционами. работает на всех валютных парах мультитаймфреймовый. когда появляемся красная стрелка мы покупаем когда появляемся красная мы продаем. он должен был достичь успеха в трейдинге. Полное отсутствие перерисовки. Точность сигнала. точность данного инструмента можете увидеть в тестере Всем удачных торгов By Lilyyy
Dublgis
Ivan Simonika
Here is a sensitive indicator for Dublgis professionals. It is built on completely new algorithms and is more efficient, on any timeframes, since it filters random price movements. Finds and visually displays price reversal points. This tool can be used as confirmation when making a deal, as well as to determine the direction of the trend and its strength. The indicator was developed as a complement to a number of our other trading tools.
FiboZag
Andriy Sydoruk
Indicator FiboZag - transfer the indicator to the chart and the Fibonacci levels will be built automatically on the last ZigZag turn. The main advantage lies in the correct construction of Fibonacci levels and markup of price levels. Simple, visual and effective use. The indicator is not redrawn and does not lag. Works on all currency pairs and on all timeframes.
GeoWprPro
Georgij Komarov
WPR by Profile, or WPR for Professionals Geo_WprPro is one of the well-known currency profile indicators. It simultaneously displays two WPR indicators with different parameters in the matrix form on all timeframes of multiple currency pairs forming the currency profile . As follows from the description, " WPR is a leading indicator that often goes ahead of the price chart. The oscillator frequently reaches extreme values before the price reversal as if anticipating that event: it almost always
About
Tatiana Savkevych
About - Forex indicator. This trend indicator is used to determine the current trend in price movement, making it clear in which direction it is better to open a position: buy or sell. The About trend indicator is displayed on the chart and moves in parallel with the price. The Forex About trend indicator allows you to determine in time a change in the direction of price movement, thereby minimizing the likelihood of capital loss. In trading practice, various combinations of About and other ind
This product shows you a different view of the market by examining the performance of volume and continuous patterns in the market, then by calculating the behavior of traders and market patterns, calculates the probability of the next movement of the market by calculations. Function. How to receive the signal: If the candlestick is currently a bullish candlestick, according to a market scan, if the next bullish candlestick is below 5%, you can open a free trade by hitting the wisdom areas.
Kangaroo Forex
Pavel Verveyko
The indicator is a trading system for AUDUSD or NZDUSD currency pairs. The indicator was developed for time periods: M15, M30. At the same time, it is possible to use it on other tools and time periods after testing. "Kangaroo Forex" helps to determine the direction of the transaction, shows entry points and has an alert system. When the price moves in the direction of the transaction, the maximum length of the movement in points is displayed. The indicator does not redraw, all actions occur a
Market Profile
Artem Titarenko
5 (1)
The "Market Profile" indicator displays the profiles and volumes of periods – weekly, daily, session (8-hour), 4-hour, hour, summary. The VAH/VAL price area is automatically highlighted by a dotted line for each profile (except for the summary). The indicator includes chroma Delta, which colors the profile areas. The areas of prevailing Buys is colored in green, that of Sells - in red. The intensity histogram features blue/red respectively. In the filter mode, the indicator displays the volume a
Introduction This indicator detects volume spread patterns for buy and sell opportunity. The patterns include demand and supply patterns. You might use each pattern for trading. However, these patterns are best used to detect the demand zone (=accumulation area) and supply zone (=distribution area). Demand pattern indicates generally potential buying opportunity. Supply pattern indicates generally potential selling opportunity. These are the underlying patterns rather than direct price action. T
Everyday trading represents a battle of buyers ("Bulls") pushing prices up and sellers ("Bears") pushing prices down. Depending on what party scores off, the day will end with a price that is higher or lower than that of the previous day. Intermediate results, first of all the highest and lowest price, allow to judge about how the battle was developing during the day. It is very important to be able to estimate the Bears Power balance since changes in this balance initially signalize about possi
The King of Forex Trend Cloud Indicator is a trend following indicator based on moving averages. The Indicator is meant to Capture both the beginning and the end of a trend. This indicator can be used to predict both short and long terms market trends.  The king of Forex Trend Cloud if paired together with the King of Forex Trend Indicator can give a broad picture in market analysis and forecasts. I have attached images for both the  The king of Forex Trend Cloud on its own and  The king of Fore
이 제품의 구매자들이 또한 구매함
Pulse Scalping Line - an indicator for identifying potential pivot points. Based on this indicator, you can build an effective Martingale system. According to our statistics, the indicator gives a maximum of 4 erroneous pivot points in a series. On average, these are 2 pivot points. That is, the indicator shows a reversal, it is erroneous. This means that the second signal of the indicator will be highly accurate. Based on this information, you can build a trading system based on the Martingale
Quantum Regime Indicator
Gideon Asiamah Yeboah
Product Name:   Quantum Regime Indicator Short Description:   A multi-engine structural regime and volatility filter. Description: Quantum Regime Indicator (QRI) is a sophisticated technical analysis algorithm designed to identify market structure shifts and volatility regimes. Unlike standard indicators that rely on immediate price action, QRI utilizes a hierarchical logic architecture to filter market noise and identify statistical extremes. The indicator is built on the philosophy of "Market
Miraculous Indicator – Gann Square of Nine 기반 100% 비리페인트 Forex 및 바이너리 도구 이 영상은 Miraculous Indicator 를 소개합니다. 이 지표는 Forex 및 바이너리 옵션 트레이더를 위해 특별히 개발된 매우 정확하고 강력한 트레이딩 도구입니다. 이 지표가 독특한 이유는 전설적인 **Gann Square of Nine(Gann 9의 사각형)**과 **Gann's Law of Vibration(Gann 진동의 법칙)**에 기반을 두고 있기 때문입니다. 이는 현대 트레이딩에서 가장 정밀한 예측 도구 중 하나로 손꼽힙니다. Miraculous Indicator는 완전히 비리페인트(non-repaint) 됩니다. 즉, 캔들이 마감된 후에도 신호가 변경되거나 사라지지 않습니다. 보이는 것이 곧 결과입니다. 이는 트레이더가 자신감을 가지고 거래에 진입하고 청산할 수 있는 신뢰할 수 있고 일관된 기반을 제공합니다. 주요 특징: Gann
F-16 비행기 지표를 소개합니다. 이것은 귀하의 거래 경험을 혁신하도록 설계된 최첨단 MT4 도구입니다. F-16 전투기의 비할 데 없는 속도와 정밀성에 영감을 받아이 지표는 고급 알고리즘과 최첨단 기술을 결합하여 금융 시장에서 압도적인 성능을 제공합니다. F-16 비행기 지표를 사용하면 실시간 분석을 제공하고 매우 정확한 거래 신호를 생성하여 경쟁을 앞서갈 수 있습니다. 다양한 자산 클래스에서 수익 기회를 식별하는 데 필요한 동적 기능을 갖추고 있어 확신을 가지고 정보에 근거한 결정을 내릴 수 있습니다. 사용자 친화적인 인터페이스로 구성된 F-16 비행기 지표는 인기있는 MetaTrader 4 플랫폼과 완벽하게 통합되어 원활하고 효율적인 거래 과정을 보장합니다. 초보자 트레이더든 경험 많은 전문가든 이 지표를 쉽게 사용자 정의하여 고유한 거래 스타일과 선호도에 맞출 수 있습니다. F-16 비행기 지표의 강력함을 경험해 보세요. 이 지표는 시장 트렌드를 정확하고 민첩하게 탐색하며
ZeusArrow Smart Liquidity Finder  Smart Liquidity Finder is Ai controlled indicator based on the Idea of Your SL is My Entry. It scan and draws the major Liquidity areas on chart partitioning them with Premium and Discount Zone and allows you find the best possible trading setups and help you decide the perfect entry price to avoid getting your Stop Loss hunted . Now no more confusion about when to enter and where to enter. Benefit from this one of it's kind trading tool powered by Ai an trade
Meravith
Ivan Stefanov
5 (1)
이 인디케이터는 각 지점에서 볼륨을 분석하고 해당 볼륨에 대한 시장의 피로 레벨을 계산합니다. 이 인디케이터는 세 개의 라인으로 구성됩니다: 강세 볼륨 피로 라인 약세 볼륨 피로 라인 시장 추세를 나타내는 라인. 이 라인은 시장이 강세인지 약세인지에 따라 색이 변합니다. 원하는 시작 지점에서 시장을 분석할 수 있습니다. 볼륨 피로 라인에 도달하면 다음 분석을 시작할 새 지점을 식별하세요. 트렌드와 수정 모두 분석할 수 있습니다. 좋은 접근 방법은 트렌드 라인에 도달하거나 고점 또는 저점에 도달할 때마다 인디케이터를 이동시키는 것입니다. 트렌드 라인과 볼륨 피로 라인 간의 거리가 클수록 해당 방향의 볼륨이 더 큽니다. 트렌드 라인은 주문을 열기 위한 장소로 사용할 수 있으며, 피로 라인은 수익을 얻는 데 사용됩니다. 이 시스템은 정말 독특하지만 매우 직관적입니다. 시장에는 비슷한 제품이 없습니다. 사용에 제한이 없습니다. 모든 시장과 모든 시간 프레임에서 적용할 수 있습니다. 중요:
Dynamic Scalper System
Vitalyi Belyh
5 (1)
" Dynamic Scalper System " 지표는 추세 파동 내에서 스캘핑 방식으로 거래하도록 설계되었습니다. 주요 통화쌍 및 금에서 테스트되었으며, 다른 거래 상품과의 호환성이 가능합니다. 추가적인 가격 변동 지원을 통해 추세에 따라 단기 포지션 진입 신호를 제공합니다. 지표의 원리 큰 화살표는 추세 방향을 결정합니다. 작은 화살표 형태의 스캘핑 신호를 생성하는 알고리즘은 추세 파동 내에서 작동합니다. 빨간색 화살표는 상승 방향을, 파란색 화살표는 하락 방향을 나타냅니다. 민감한 가격 변동선은 추세 방향으로 그려지며, 작은 화살표의 신호와 함께 작용합니다. 신호는 다음과 같이 작동합니다. 적절한 시점에 선이 나타나면 진입 신호가 형성되고, 선이 있는 동안 미결제 포지션을 유지하며, 완료되면 거래를 종료합니다. 권장되는 작업 시간대는 M1~H4입니다. 화살표는 현재 캔들에 형성되며, 다음 캔들이 이미 시작되었더라도 이전 캔들의 화살표는 다시 그려지지 않습니다. 입력 매개
The Nihilist 5.0 Indicator includes Forexalien and Nihilist Easy Trend trading strategies and systems. It is composed of an MTF Dashboard where you can analyze the different input possibilities of each strategy at a glance. It has an alert system with different types of configurable filters. You can also configure which TF you want to be notified on your Metatrader 4 platform and Mobile application The indicator has the option to view how could be a TP and SL by using ATR or fixed points, even w
Gold Channel XAUUSD
Paulo Rocha
5 (4)
Gold Channel is a volatility-based indicator, developed with a specific timing algorithm for the XAUUSD pair, which consists of finding possible corrections in the market. This indicator shows two outer lines, an inner line (retracement line) and an arrow sign, where the theory of the channel is to help identify overbought and oversold conditions in the market. The market price will generally fall between the boundaries of the channel. If prices touch or move outside the channel it is a tradi
GoldRush Trend Arrow Signal
Kirk Lee Holloway
5 (2)
GoldRush 트렌드 화살표 신호 GoldRush 트렌드 화살표 신호 지표는 XAU/USD 시장에서 고속 단기 스캘핑 트레이더를 위해 설계된 정밀한 실시간 트렌드 분석을 제공합니다. 1분 시간대에 특화되어 설계된 이 도구는 명확한 진입점을 표시하는 방향성 화살표를 제공하여 스캘퍼들이 변동성이 높은 시장 환경에서도 자신 있게 거래할 수 있도록 합니다. 이 지표는 PRIMARY 및 SECONDARY 경고 화살표로 구성됩니다. PRIMARY 신호는 추세 방향의 변화를 나타내는 흰색과 검은색 방향성 화살표이며, SECONDARY 신호는 PRIMARY 화살표가 지시하는 방향을 확인하고 잠재적인 거래 진입점을 표시하는 파란색과 빨간색 화살표입니다. 참고: 추세 방향이 변경된 후 PRIMARY 경고 화살표가 단 하나만 표시될 경우, 다수의 SECONDARY 파란색/빨간색 화살표가 표시될 수 있음을 유의해야 합니다. SECONDARY 신호는 신호 기준을 충족하는 어떤 캔들 이후에도 표시
OrderFlow Absorption – MT4용 전문 델타 & 흡수 신호 인디케이터 OrderFlow Absorption으로 진정한 오더플로우 분석의 힘을 경험하세요. MetaTrader 4를 위한 궁극의 델타 히스토그램 및 흡수 신호 인디케이터입니다. 가격 움직임의 이면에서 실제로 무슨 일이 일어나는지 알고 싶은 트레이더를 위해 설계된 이 도구는, 시장을 움직이는 숨겨진 매수/매도 압력과 흡수 이벤트를 드러냅니다. 주요 기능 델타 히스토그램 시각화:   매수와 매도 압력을 색상별 히스토그램으로 즉시 확인할 수 있습니다. 흡수 신호 감지:   고급 로직으로 강세 및 약세 흡수 이벤트를 식별하여 반전 신호를 미리 알려줍니다. 차트 마커:   흡수 신호가 차트에 직접 표시되어 시각적으로 쉽게 확인할 수 있습니다. 팝업 알림:   새로운 흡수 신호가 발생하면 실시간으로 알림을 받을 수 있습니다. 사용자 지정 임계값:   약한 신호는 필터링하고, 확률이 높은 기회에 집중할 수 있습니다.
ATC AlgoZone Indicator
Ameur Boudenne
5 (2)
Algo Trading Indicaor  With this indicator , you’ll have zones and trends that hight probability the price will reverse from it. so will gives you all the help that you need  Why should you join us !?  1-This indicator is logical since it’s working in previous days movement , to predict the future movements. 2-Algo trading indicator will help you to draw trends which is special and are too strong than the basics trend , trends will change with the frame time that you work on . 3-We can use
"Dragon's Tail" is an integrated trading system, not just an indicator. This system analyzes each candle on a minute-by-minute basis, which is particularly effective in high market volatility conditions. The "Dragon's Tail" system identifies key market moments referred to as "bull and bear battles". Based on these "battles", the system gives trade direction recommendations. In the case of an arrow appearing on the chart, this signals the possibility of opening two trades in the indicated directi
The Hurricane Indicator
Paul Nicholas Clevett
5 (1)
Currently switched to the 4 hour chart - but use other time frames for confirmation. :-)  I change my main time frame based on the market movement at the time. The Hurricane Forex Indicator is a multi time frame indicator that includes such things as Trade Notifications, Trade Calculator, Momentum Indicator, risk reward and much more. We have a free Trade room for our users as well. Please check out the video for full details of how this indicator works as it has over 15 years worth of developme
Key level wedge pro
Presley Annais Tatenda Meck
5 (1)
We have combined all of our beloved indicators the likes of: Key level order block , Key level supply and demand , Key level liquidity grab and Key level wedge into one single indicator and dashboard. Whats new Dashboard : There is an easy access dashboard for all your needs. Multi-timeframe button : There is now a multi-timeframe option for Order Blocks and Supply and demand zones, making it easy to see higher timeframe zones easily on the current timeframe by just clicking the desired timefra
Everyone who purchases the Scalping signals M1 indicator receives a FREE BONUS — a fully automated Expert Advisor that trades based on the indicator’s signals. The indicator shows the arrows — the robot can execute the trades for you, following all signals and risk-management rules. Scalping signals M1 – a ready-made trend-following entry system for M1 Scalping signals M1 is an indicator that turns your chart into a clear action map: a colored trend channel shows the direction of the market, and
RelicusRoad Pro
Relicus LLC
4.65 (106)
RelicusRoad Pro: 퀀트 시장 운영 체제 70% 할인 평생 이용권 (한정 시간) - 2,000명 이상의 트레이더와 함께하세요 왜 대부분의 트레이더는 "완벽한" 지표를 가지고도 실패할까요? 진공 상태에서 단일 개념 만으로 거래하기 때문입니다. 문맥 없는 신호는 도박입니다. 지속적인 승리를 위해서는 컨플루언스(중첩) 가 필요합니다. RelicusRoad Pro는 단순한 화살표 지표가 아닙니다. 완전한 퀀트 시장 생태계 입니다. 독점적인 변동성 모델링을 사용하여 가격이 이동하는 "공정 가치 로드"를 매핑하고, 단순 노이즈와 실제 구조적 돌파를 구분합니다. 추측은 그만두세요. 기관급 로드 로직으로 거래를 시작하세요. 핵심 엔진: "Road" 알고리즘 시스템의 중심에는 시장 상황에 실시간으로 적응하는 동적 변동성 채널인 Road Algo 가 있습니다. 세이프 라인(평형) 과 가격이 수학적으로 반전될 가능성이 높은 확장 레벨 을 투영합니다. Simple Road: 일반적인 시장을 위
BinaryIndicator
Andrey Spiridonov
BinaryIndicator is a highly accurate indicator for trading binary options. It shows excellent results in scalping. This indicator is based in multifactor analysis of trend indicators, as well as confirmation oscillators, which in the end gives an increased accuracy of signals. Advantages of the indicator Increased accuracy of signals. Excellent results when trading binary options with a short expiration time from M30 to M1 . It works on any timeframes. Works with any trade symbols. Parameters
Shows price reversal points with arrows. Works on all timeframes and all currency pairs. Suitable for both scalping and long-term trading. When the blue arrow appears, you need to open a buy order. When the red arrow appears, you need to open a sell order. Recommended timeframes M5, M15, H1, H4. The indicator shows the best results on GBPUSD, XAUUSD, EURUSD, USDJPY, AUDUSD, USDCHF, EURGBP, EURJPY, EURCHF and other major pairs. This indicator is well suited for intraday scalping because it show
Trend AI Indicator
Aleksandr Goryachev
Trend AI Indicator 설명: Trend AI Indicator는 인공 지능을 사용하여 트렌드와 주요 레벨을 식별하는 강력한 시장 분석 도구입니다. 이 지표는 변화하는 시장 조건에 자동으로 적응하여 의사 결정을 위한 정확한 데이터를 제공합니다. 주요 기능: 트렌드 식별:   이 지표는 머신 러닝 알고리즘을 사용하여 트렌드 방향(상승, 하락, 횡보)을 정확하게 판단합니다. 주요 레벨:   과거 데이터를 기반으로 지지 및 저항 레벨을 자동으로 구축합니다. 안전한 거래 구역:   가능한 최소 스톱 로스로 리스크를 최소화하는 구역을 정의합니다. 적응성:   지표는 시장 변동성에 적응하여 잘못된 데이터를 최소화합니다. 사용자 정의 설정:   다양한 거래 전략 및 시간대에 맞게 사용자 정의 가능합니다. 장점: AI 사용으로 높은 정확도 제공. 모든 시장 유형(외환, 주식, 암호화폐)에 적합합니다. 안전한 거래 구역은 가능한 최소 스톱 로스로 리스크를 최소화합니다. 초보자와 전문가
The BB Reversal Arrows technical trading system has been developed to predict reverse points for making retail decisions. The current market situation is analyzed by the indicator and structured for several criteria: the expectation of reversal moments, potential turning points, purchase and sale signals. The indicator does not contain excess information, has a visual understandable interface, allowing traders to make reasonable decisions. All arrows appear to close the candle, without redrawin
Scalpetronix
Andrey Kozak
Scalpetronix Indicator — the signal core of the Scalpetronix robot. This indicator implements the algorithms and signals on which the Scalpetronix Expert Advisor operates. All entries of the robot are generated based on these calculations: a combination of exponential moving averages, trend filtering via ADX, volatility normalization through ATR, and bar structure analysis. Advantages of the indicator works on a multi-level EMA system (fast and slow) with a dynamic threshold; eliminates weak si
---- Brand New Strategy. Three Month Rent is $30. ONE YEAR RENT ONLY $50. FREE EURUSD VERSION AVAILABLE UNDER << Forecast System Gift >>. NO NEED FOR BACKTEST! Link to the FREE version -->  https://www.mql5.com/en/market/product/110085?source=Site --- This is a simple strategy based on BREAKOUT and FIBONACCI levels. After a breakout, either, the market: - continues the move directly to the 161, 261 and 423 levels, or - retraces to the 50% level (also called a correction) and thereafter continues
PTS Precision Index Oscillator V2
PrecisionTradingSystems
5 (1)
프리시전 트레이딩 시스템의 로저 메드칼프에 의한 프리시전 인덱스 오실레이터 (Pi-Osc) 버전 2는 차트에 신속하게 로드되도록 주의 깊게 다시 코딩되었으며 경험을 향상시키기 위해 몇 가지 다른 기술적 개선 사항이 통합되었습니다. Pi-Osc는 정확한 거래 타이밍 신호를 제공하도록 개발되었으며 시장이 모든 사람의 스톱을 청산하기 위해 가야 하는 극도의 고갈 지점을 찾는 데 목적이 있습니다. 이 제품은 극단적인 지점이 어디에 있는지 알고 있는 고전적인 문제를 해결하며 트레이더로서의 삶을 훨씬 간단하게 만듭니다. 이것은 업계 표준 오실레이터와는 상당히 다른 강력한 차이점을 가지고 있는 고도로 복잡한 합의 지표입니다. 사용하는 기능 중 일부는 수요 지수, 자금 흐름, RSI, 스토캐스틱, 패턴 인식, 거래량 분석, 표준 편차 극단점 및 다양한 길이에서 위와 유사한 변형을 갖습니다. 미숙한 눈에는 다른 오실레이터와 비슷해 보일 수 있지만 RSI 또는 모멘텀과 같은 다른 오실레이
ECM Elite Channel is a volatility-based indicator, developed with a specific time algorithm, which consists of finding possible corrections in the market. This indicator shows two outer lines, an inner line (retracement line) and an arrow sign, where the channel theory is to help identify overbought and oversold conditions in the market. The market price will generally fall between the boundaries of the channel. If prices touch or move outside the channel, it's a trading opportunity. The ind
Introduction to X3 Chart Pattern Scanner X3 Cherart Pattern Scanner is the non-repainting and non-lagging indicator detecting X3 chart patterns including Harmonic pattern, Elliott Wave pattern, X3 patterns, and Japanese Candlestick patterns. Historical patterns match with signal patterns. Hence, you can readily develop the solid trading strategy in your chart. More importantly, this superb pattern scanner can detect the optimal pattern of its kind. In addition, you can switch on and off individu
This indicator is a multifunctional technical analysis tool based on the combination of an adaptive exponential moving average and volatility filters calculated through the Average True Range (ATR). It is designed to accurately identify the current price direction, highlight key trend reversal areas, and visualize potential turning zones. The algorithm is built upon the dynamic construction of a trend ribbon using two levels of volatility — outer and inner ranges. The outer boundaries serve as i
Rtc ML Ai Predictor MT4
Muhammad Faisal Sagala
Rtc ML Ai | Predictor CORE MACHINE LEARNING ENGINE Adaptive ML Market Predictor – Multi-Bar Trend & Candle Forecast What This Indicator Does This indicator is a  real-time market prediction engine  designed to analyze price behavior and estimate  future market tendencies . Unlike conventional indicators, this system  does not rely on static parameters or historical curve-fitting , but adapts its internal state dynamically during live market operation. Instead of using static rules, the indic
Pair Trading Station MT4
Young Ho Seo
3.67 (3)
How to use Pair Trading Station Pair Trading Station is recommended for H1 time frame and you can use it for any currency pairs. To generate buy and sell signal, follow few steps below to apply Pair Trading Station to your MetaTrader terminal. When you load Pair Trading Station on your chart, Pair Trading station will assess available historical data in your MetaTrader platforms for each currency pair. On your chart, the amount of historical data available will be displayed for each currency pai
FFx Engulfing Setup Alerter gives trade suggestions with Entry, Target 1, Target 2 and StopLoss. Below are the different options available: Entry suggestion - pips to be added over the break for the entry 3 different options to calculate the SL - by pips, by ATR multiplier or at the pattern High/Low 3 different options to calculate the 2 TPs - by pips, by ATR multiplier or at Risk/Reward Offset the dashboard - any place on the chart Remove the suggestion once the price reached the SL line Lines
제작자의 제품 더 보기
하나의 창에서 통화 쌍의 여러 시간 프레임을 분석하면 혼란스러울 수 있습니다. 여러 시간 프레임을 분석하려면 신뢰할 수 있는 지표가 필요합니다. 그중 하나는 9TF STOCH RSI를 사용하고 있습니다. 나는 단순하지만 신뢰할 수 있고 단 하나의 지표에서 9개의 시간 프레임을 모두 다루는 코드를 만들기 위해 밤낮으로 노력했습니다. 이 표시기의 몇 가지 장점을 살펴보겠습니다. 다채로운 히스토그램. 각 기간의 곡선 색상은 서로 다릅니다. STOCHASTIC 본선과 신호선의 교차점을 나타내는 화살표. (참고: 나타나는 마지막 화살표는 무시하십시오!) OBOS 레벨 라인. 실시간 9TF 대시보드 모니터. 9TF 대시보드 모니터 계산은 한 시간 프레임에서 다른 시간 프레임으로 변경하더라도 매우 정확합니다. 어떤 곡선이 과매수 수준 위에 있고 과매도 수준 아래에 있는지 모니터링합니다. 메인 STOCH가 신호 STOCH 위에 있는지 또는 그 반대인지 곡선을 모니터링합니다. 메인 STO
Analyzing multiple time frames of a currency pair in one window can make you confused. To analyze multiple time frames, you need reliable indicators. One of them is using 9TF RSI MA . I've been working day and night to create code that is simple but reliable and covers all nine time frames in just one indicator .  Let's look at some of the advantages of this indicator: Colorful histogram . The color of the curve in each timeframe is different from one another.  Arrows indicating the crossing of
하나의 창에서 통화 쌍의 여러 시간 프레임을 분석하면 혼란스러울 수 있습니다. 여러 시간 프레임을 분석하려면 신뢰할 수 있는 지표가 필요합니다. 그중 하나는 9TF Double RSI Double MA를 사용하고 있습니다. 나는 단순하지만 신뢰할 수 있고 단 하나의 지표에서 9개의 시간 프레임을 모두 다루는 코드를 만들기 위해 밤낮으로 노력했습니다. 이 표시기의 몇 가지 장점을 살펴보겠습니다. 이중 RSI, 즉 RSI는 더 빠르고 RSI는 더 느립니다. 이중 MA, 즉 MA는 더 빠르고 MA는 더 느립니다. 10 색 구성표. 각 기간의 곡선 색상은 서로 다릅니다. RSI의 OBOS 레벨 라인. 실시간 9TF 대시보드 모니터. 9TF 대시보드 모니터 계산은 한 시간 프레임에서 다른 시간 프레임으로 변경하더라도 매우 정확합니다. 어떤 RSI 곡선이 과매수 수준 위에 있고 과매도 수준 아래에 있는지 모니터링합니다. MA 빠른 라인이 MA 느린 라인 위에 있는지 또는 그 반대인지
하나의 창에서 통화 쌍의 여러 시간 프레임을 분석하면 혼란스러울 수 있습니다. 여러 시간 프레임을 분석하려면 신뢰할 수 있는 지표가 필요합니다. 그중 하나는 9TF Double CCI Double MA를 사용하고 있습니다. 나는 단순하지만 신뢰할 수 있고 단 하나의 지표에서 9개의 시간 프레임을 모두 다루는 코드를 만들기 위해 밤낮으로 노력했습니다. 이 표시기의 몇 가지 장점을 살펴보겠습니다. 이중 CCI, 즉 CCI는 더 빠르고 CCI는 더 느립니다. 이중 MA, 즉 MA는 더 빠르고 MA는 더 느립니다. 10 색 구성표. 각 기간의 곡선 색상은 서로 다릅니다. CCI의 OBOS 레벨 라인. 실시간 9TF 대시보드 모니터. 9TF 대시보드 모니터 계산은 한 시간 프레임에서 다른 시간 프레임으로 변경하더라도 매우 정확합니다. 어떤 CCI 곡선이 과매수 수준 위에 있고 과매도 수준 아래에 있는지 모니터링합니다. MA 빠른 라인이 MA 느린 라인 위에 있는지 또는 그 반대인지
정확한 CCI 지표를 사용할 수 있습니다. 대시보드 트렌드 바 스마트 레벨 9TF Double CCI. 이중 CCI, 즉 빠른 CCI 및 느린 CCI 두 번째 CCI가 필요한 이유는 무엇입니까? 추가 지표를 사용하면 라이브 거래에서 더 많은 확신을 얻을 수 있습니다. 9TF 빠른 CCI 곡선 9TF 느린 CCI 곡선 9TF 실시간 CCI 각도 9TF 실시간 CCI 값 9TF 실시간 CCI 방향/위상 9TF 트렌드 바 추세 막대 계산의 새로운 알고리즘 켜기/끄기 버튼. 한 번의 클릭으로 표시기를 표시하거나 숨길 때 매우 유용합니다. 실시간 9TF 대시보드 모니터 추세 막대만 표시하는 기능 CCI 곡선만 표시하는 기능 대시보드만 표시하는 기능 표시할 CCI 곡선을 선택하는 기능 추세의 화살표 유형 선택 기능 obos 선 스타일을 선택하는 기능 범례 표시/숨기기 기능 막대 수를 늘리거나 줄이는 기능 색 구성표 수준을 선택하는 기능 최대 10개의 대시보드 추세 막대 색 구성표를 선택하는
정확한 RSI 지표를 사용할 수 있습니다. 대시보드 트렌드 바 스마트 레벨 9TF Double RSI. 이중 RSI, 즉 빠른 RSI 및 느린 RSI 두 번째 RSI가 필요한 이유는 무엇입니까? 추가 지표를 사용하면 라이브 거래에서 더 많은 확신을 얻을 수 있습니다. 9TF 빠른 RSI 곡선 9TF 느린 RSI 곡선 9TF 실시간 RSI 각도 9TF 실시간 RSI 값 9TF 실시간 RSI 방향/위상 9TF 트렌드 바 추세 막대 계산의 새로운 알고리즘 켜기/끄기 버튼. 한 번의 클릭으로 표시기를 표시하거나 숨길 때 매우 유용합니다. 실시간 9TF 대시보드 모니터 추세 막대만 표시하는 기능 RSI 곡선만 표시하는 기능 대시보드만 표시하는 기능 표시할 RSI 곡선을 선택하는 기능 추세의 화살표 유형 선택 기능 obos 선 스타일을 선택하는 기능 범례 표시/숨기기 기능 막대 수를 늘리거나 줄이는 기능 색 구성표 수준을 선택하는 기능 최대 10개의 대시보드 추세 막대 색 구성표를 선택하는
정확한 MACD 지표를 사용할 수 있습니다. 대시보드 트렌드 바 스마트 레벨 9TF Double MACD. 이중 MACD, 즉 Fast(MACD 1) 및 Slow(MACD 2) 두 번째 MACD가 필요한 이유는 무엇입니까? 추가 지표를 사용하면 라이브 거래에서 더 많은 확신을 얻을 수 있습니다. 9TF 빠른 MACD 1 곡선 9TF 느린 MACD 2 곡선 9TF 실시간 MACD 각도 9TF 실시간 MACD 값 9TF 실시간 MACD 방향정확한 MACD 지표를 사용할 수 있습니다. 대시보드 트렌드 바 스마트 레벨 9TF Double MACD. 이중 MACD, 즉 Fast(MACD 1) 및 Slow(MACD 2) 두 번째 MACD가 필요한 이유는 무엇입니까? 추가 지표를 사용하면 라이브 거래에서 더 많은 확신을 얻을 수 있습니다. 9TF 빠른 MACD 1 곡선 9TF 느린 MACD 2 곡선 9TF 실시간 MACD 각도 9TF 실시간 MACD 값 9TF 실시간 MACD 방향/위상 9
정확한 스토캐스틱 지표를 사용할 수 있습니다. 대시보드 트렌드 바 스마트 레벨 9TF 듀얼 스토캐스틱. 이중 스토캐스틱, 즉 빠른 스토캐스틱 및 느린 스토캐스틱 두 번째 스토캐스틱이 필요한 이유는 무엇입니까? 추가 지표를 사용하면 라이브 거래에서 더 많은 확신을 얻을 수 있습니다. 9TF 빠른 확률 곡선 9TF 느린 확률 곡선 9TF 실시간 확률 각도 9TF 실시간 스토캐스틱 값 9TF 실시간 확률적 방향/위상 9TF 트렌드 바 추세 막대 계산의 새로운 알고리즘 켜기/끄기 버튼. 한 번의 클릭으로 표시기를 표시하거나 숨기는 데 매우 유용합니다. 실시간 9TF 대시보드 모니터 추세 막대만 표시하는 기능 확률적 곡선만 표시하는 기능 대시보드만 표시하는 기능 표시할 확률 곡선을 선택하는 기능 추세의 화살표 유형 선택 기능 obos 선 스타일을 선택하는 기능 범례 표시/숨기기 기능 막대 수를 늘리거나 줄이는 기능 색 구성표 수준을 선택하는 기능 최대 10개의 대시보드 추세 막대 색 구성
하나의 지표만 사용하여 거래를 자주 잃는다면 이 거래 도구를 사용해 보십시오. 이 거래 도구는 하나 이상의 지표를 사용합니다. 나는 RSI 지표만 사용하는 트레이더를 자주 관찰합니다. 시장이 과매도 상태이지만 여전히 하락세이거나, 시장이 과매수 상태이지만 여전히 상승하는 경우가 많습니다. 이러한 이유로 하나 이상의 지표를 사용해야 합니다. 새 버전 V 3.40 MTF PPAAF 소개: 다중 시간 프레임 정확한 가격 동작 화살표 필터링. 이 거래 도구는 다양한 지표를 사용하여 시장 움직임의 방향을 강화합니다. 이 거래 도구에 사용되는 첫 번째 지표는 듀얼 스토캐스틱(Dual Stochastic)입니다. 여기서는 Fast Stochastic과 Slow Stochastic이라는 두 가지 Stochastic을 사용합니다. Fast Stochastic에는 Fast Stochastic 메인 라인과 Fast Stochastic 신호 라인이 있습니다. 마찬가지로 Slow Stochastic에는
[V 1.00] MTF NRPA 5 이동 평균 RTD가 출시되었습니다! 비 다시 그리기 화살표 실시간 대시보드. 최고의 이동 평균 지표를 찾고 있다면 올바른 페이지에 있습니다. 일반적으로 사람들은 두 이동 평균의 교차점(교차)이 다음 가격 추세의 방향을 결정하기 때문에 두 이동 평균을 설정합니다. 빠른 이동 평균이 느린 이동 평균과 교차하고 빠른 > 느린 경우 추세가 상승합니다. 반대로 빠른 이동 평균이 느린 이동 평균과 교차하고 빠른 < 느린 경우 추세가 하락합니다. 두 이동 평균의 단점은 장기적인 추세를 볼 수 없다는 것입니다. 이것이 제가 이 거래 도구를 개발한 이유입니다. 설명 방법은 다음과 같습니다. 이 거래 도구에서는 5개의 이동 평균을 사용합니다. 예, 다섯! 기본적으로 저는 MA 1과 MA 2를 큰 시간 프레임인 H1에 설정했습니다. MA 1과 MA 2의 교차점은 H1 기간에 추세 변화가 있음을 의미합니다. 그런 다음 MA 3 및 MA 4는 현재 시간 프레임(
[V 1.00] 기동특무부대 NRPA 5 RSI RTD 출시! 다시 칠하지 않는 화살표 실시간 대시보드. 다양한 RSI 지표를 사용하는 데 지쳤지만 정확하지 않은 경우 이 도구를 사용해 보십시오. 일반적으로 사람들은 일정 기간 동안 OBOS 수준을 결정하기 위해 1 RSI만 설치합니다. 나쁜 소식은 다양한 시간대의 OBOS 수준과 추세를 한 번에 볼 수 없다는 것입니다. 이것이 제가 이 거래 도구를 개발한 이유입니다. 설명 방법은 다음과 같습니다. 이 거래 도구에서는 5개의 RSI를 사용합니다. 예, 다섯! 기본적으로 M30이라는 큰 시간 프레임에 RSI 1과 RSI 2를 설정합니다. RSI 1과 RSI 2의 교차점은 M30 시간대에 추세 변화가 있음을 의미합니다. 그런 다음 현재(작은) 시간대에 RSI 3과 RSI 4를 설정합니다. 예를 들어 M5에서 차트를 엽니다. RSI 3과 RSI 4의 교차점은 현재 시간대(M5)에 추세 변화가 있음을 의미합니다. 그런 다음 추세 움
If you are curious about the position of the stochastic, RSI, CCI curve, whether it is at the OBOS level or not, then this trading tool is for you. Introducing the advanced trading tools of 2024. ATF Trend Following Trend Bar OBOS. This indicator is similar to MTF PPAAF Model S but have two layers.  Click here to learn more about MTF PPAAFS . This trading tool is equipped with various powerful features : MTF = Multi Time Frame = Time Frame can be changed. On/off button. Customizable parameter,
안녕하세요 상인 여러분. 최고의 거래 도구를 소개합니다. MTF PPAAF 모델 T. 다중 시간 프레임 정확한 가격 조치 화살표가 모델 T를 필터링했습니다.  이 거래 도구는 수년간 다양한 거래 도구를 만든 후 최고의 작품입니다. 이 거래 도구가 왜 최고이고 신뢰할 수 있습니까?  1. 이 도구는 6가지 지표를 사용합니다.  이중 CCI = 빠른 CCI x 느린 CCI 듀얼 스토캐스틱 = 빠른 스토캐스틱(빠른 스토캐스틱 주선 x 빠른 스토캐스틱 신호선) 및 느린 스토캐스틱(느린 스토캐스틱 주선 x 느린 스토캐스틱 신호선)  듀얼 MACD = 빠른 MACD(빠른 MACD 메인 라인 x 빠른 MACD 신호 라인) 및 느린 MACD(느린 MACD 메인 라인 x 느린 MACD 신호 라인) 6가지 이동 평균 = MA 1 x MA 2, MA 3 x MA 4 및 MA 5 x MA 6 듀얼 더블 RSI = 빠른 DRSI(빠른 DRSI 메인 라인 x 빠른 DRSI
15 years old, 15 years old, 15 years old. 2024 years ago: ️ What to do next. I want to know what I want to know. Sorry, I don't know what to do. I want to know, I want to know, I want to know. I want to know what I want to know. I want to know what I want to know. H4(단지 M1에서 M30) I'm here. I'm here. I want to know what I want to know. I want to know what I'm saying. I want to know what I want to know. I want to know what I want to know. I want to know what I want to know. I want to
이 거래 도구를 사용하면 15개 시장을 동시에 스캔할 수 있습니다. 2024년 새로운 거래 지표 소개: ️ 대시보드 다중 통화 다중 시간 프레임 이중 CCI. 제가 이 거래 도구를 만든 이유는 최소한 두 가지입니다. 첫째, 하나의 시장만 관찰하는 것이 지루합니다. 둘째, 다른 시장에 진입하는 순간을 놓치고 싶지 않습니다. 그렇기 때문에 동시에 다른 시장 상황도 알고 싶습니다. 이러한 이유로 여러 시장의 상황을 동시에 스캔할 수 있는 스캐너가 필요합니다. 나는 종종 빠른 CCI 라인 > (또는 <=) 느린 CCI 라인이 M1에서 H4(또는 단지 M1에서 M30)까지 시작하는 시장을 찾습니다. 내 분석에 동의하신다면 이것이 바로 귀하가 찾고 있던 거래 지표입니다. 시장 상황이 위의 요구 사항을 충족하는 순간을 놓치지 마십시오. 이것은 많은 훌륭한 기능을 갖춘 확률론적 스캐너 또는 대시보드입니다. 빠른 CCI 라인의 데이터를 표시할 수 있습니다. 느린 CCI 라인의
이 거래 도구를 사용하면 15개 시장을 동시에 스캔할 수 있습니다. 2024년 새로운 거래 지표 소개: ️ 대시보드 다중 통화 다중 시간 프레임 이중 RSI. 제가 이 거래 도구를 만든 이유는 최소한 두 가지입니다. 첫째, 하나의 시장만 관찰하는 것이 지루합니다. 둘째, 다른 시장에 진입하는 순간을 놓치고 싶지 않습니다. 그렇기 때문에 동시에 다른 시장 상황도 알고 싶습니다. 이러한 이유로 여러 시장의 상황을 동시에 스캔할 수 있는 스캐너가 필요합니다. 나는 종종 빠른 RSI 라인 > (또는 <=) 느린 RSI 라인이 M1에서 H4(또는 단지 M1에서 M30)까지 시작하는 시장을 찾습니다. 그리고 M1부터 M30까지 과매도/과매수 상태인 시장을 자주 찾아봅니다. 내 분석에 동의하신다면 이것이 바로 귀하가 찾고 있던 거래 지표입니다. 시장 상황이 위의 요구 사항을 충족하는 순간을 놓치지 마십시오. 이것은 많은 훌륭한 기능을 갖춘 확률론적 스캐너 또는 대시보드입니
Looking for a trading tool based on the CCI indicator that can display crossovers arrows on all time frames? Introducing trading indicator : All Time Frame Double CCI Model T ready to help you achieve daily profits. This tool is created using the intersection of two CCI (Double CCI) indicator lines: the main CCI and the signal CCI. Using this tool makes it easier to observe the real-time dashboard and intersections of multiple timeframes simultaneously. Viewing both higher and lower timeframes
Looking for a trading tool based on the CCI indicator that can display crossovers arrows on all time frames? Introducing trading indicator : All Time Frame Double CCI Model S ready to help you achieve daily profits. This tool is created using the intersection of two CCI (Double CCI) indicator lines: the main CCI and the signal CCI. Using this tool makes it easier to observe the real-time dashboard and intersections of multiple timeframes simultaneously. Viewing both higher and lower timeframes
Looking for a trading tool based on the MACD indicator that can display crossovers arrows on all time frames? Introducing trading indicator : All Time Frame MACD Model T ready to help you achieve daily profits. This tool is created using the intersection of two indicator lines of MACD : the main MACD and the signal MACD. Using this tool makes it easier to observe the real-time dashboard and intersections of multiple timeframes simultaneously. Viewing both higher and lower timeframes simultaneou
Looking for a trading tool based on the MACD indicator that can display crossovers arrows on all time frames? Introducing trading indicator : All Time Frame MACD Model S ready to help you achieve daily profits. This tool is created using the intersection of two indicator lines of MACD : the main MACD and the signal MACD. Using this tool makes it easier to observe the real-time dashboard and intersections of multiple timeframes simultaneously. Viewing both higher and lower timeframes simultaneou
Looking for a trading tool based on the Stochastic indicator that can display crossovers arrows on all time frames? Introducing trading indicator : All Time Frame Stochastic Model T ready to help you achieve daily profits. This tool is created using the intersection of two indicator lines of Stochastic  : the main Stochastic  and the signal Stochastic . Using this tool makes it easier to observe the real-time dashboard and intersections of multiple timeframes simultaneously. Viewing both higher
Looking for a trading tool based on the Stochastic indicator that can display crossovers arrows on all time frames? Introducing trading indicator : All Time Frame Stochastic Model S ready to help you achieve daily profits. This tool is created using the intersection of two indicator lines of Stochastic  : the main Stochastic and the signal Stochastic . Using this tool makes it easier to observe the real-time dashboard and intersections of multiple timeframes simultaneously. Viewing both higher
Looking for a trading tool based on the RSI indicator that can display crossovers arrows on all time frames? Introducing trading indicator : All Time Frame Double RSI Model T ready to help you achieve daily profits. This tool is created using the intersection of two RSI (Double RSI) indicator lines: the main RSI and the signal RSI. Using this tool makes it easier to observe the real-time dashboard and intersections of multiple timeframes simultaneously. Viewing both higher and lower timeframes
Looking for a trading tool based on the RSI indicator that can display crossovers arrows on all time frames? Introducing trading indicator : All Time Frame Double RSI Model S ready to help you achieve daily profits. This tool is created using the intersection of two RSI (Double RSI) indicator lines: the main RSI and the signal RSI. Using this tool makes it easier to observe the real-time dashboard and intersections of multiple timeframes simultaneously. Viewing both higher and lower timeframes
Looking for a trading tool based on the moving average indicator that can display crossovers arrows on all time frames? Introducing trading indicator : All Time Frame Two MA Model T ready to help you achieve daily profits. This tool is created using the intersection of two moving average  indicator lines: the main MA1 and the signal MA2. Using this tool makes it easier to observe the real-time dashboard and intersections of multiple timeframes simultaneously. Viewing both higher and lower timef
Looking for a trading tool based on the moving average indicator that can display crossovers arrows on all time frames? Introducing trading indicator : All Time Frame Two MA Model S ready to help you achieve daily profits. This tool is created using the intersection of two moving average indicator lines: the main MA1 and the signal MA2. Using this tool makes it easier to observe the real-time dashboard and intersections of multiple timeframes simultaneously. Viewing both higher and lower timefr
필터:
리뷰 없음
리뷰 답변