OneKey 28 Year Shift

1. What is this

Many of the EA's on the market have cheats inside to optimize its money curve, which results in the buyer wasting money and effort and buying a junk EA.

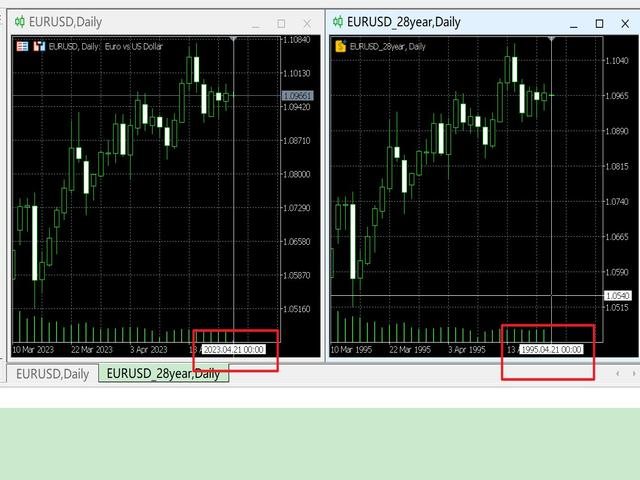
This tool is an effective tool for detecting whether an EA is cheating by allowing the data to be panned to the left for 28 years.
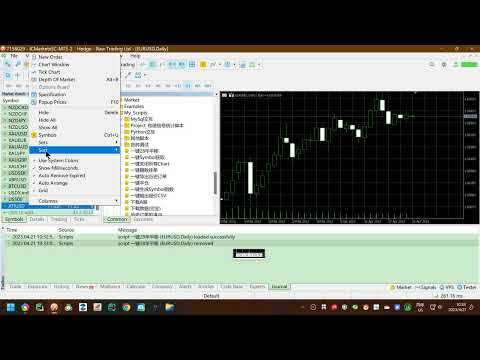
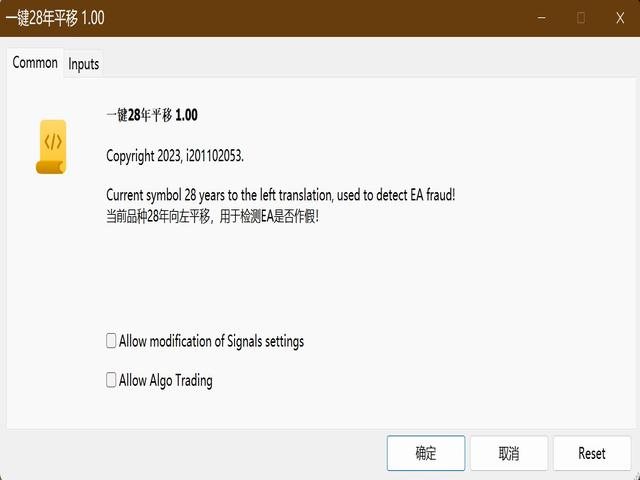
2. How to use

  • a. Load it and it will generate a new symbol, usually it will be named with a suffix. 
    • For example, EURUSD --> EURUSD_28year.
  • b. If your want to test one EA, you should open The time frame corresponding to the  EURUSD_28year. 
    • For example, you want to test M15, your should open  EURUSD_28year M1, and  EURUSD_28year M15.

If you buy an EA that needs to be tested on EURUSD, maybe the money curve is very nice. You also need to check again on EURSUD_28year to see if the EA is cheating.

The minimum accuracy is 1 minute, it does not support tick because the amount of data is too large and unnecessary, usually 1 minute is enough.

It can test the EA DEMO version on the market. The purpose of developing it is to help others identify cheating EA.
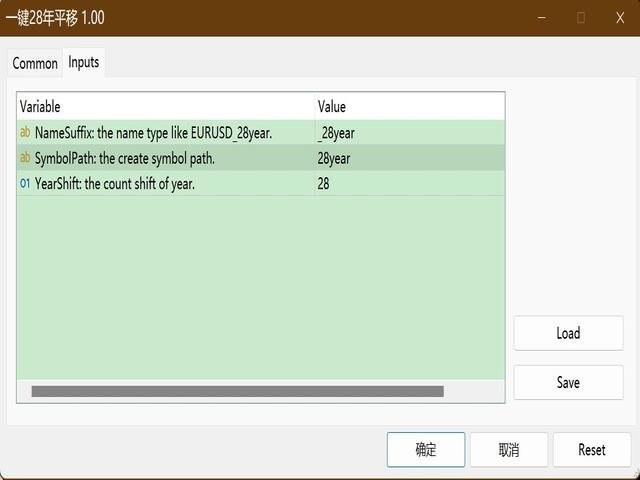
For example, use 28yearsshift to generate Eurusd_28year.  You need to test an EA DEMO version on EURUSD, and then test EURUSD_28year.  Two results are compared to determine whether EA has cheating.


3. Parameters:

  • NameSuffix = "_28year"; // NameSuffix: the name type like EURUSD_28year.
  • SymbolPath = "28year"; // SymbolPath: the create symbol path.
  • YearShift = 28; // YearShift: the count shift of year. >0 is shift to left, 2028->2000; <0 is shift to right, 2028->2056.


Thanks for using it and look forward to you finding a good EA instead of getting ripped off.


추천 제품
Trading Utility for Forex Currency Pairs Only not for Gold  Functions Auto Lot Calculation based on Risk Auto stoploss  Auto TakeProfit Breakeven Auto Close Half % Close in percentage with respect to the PIPs Pending Orders BuyLimit Sell Limit with distances BuyStop Sell Stop    with distances Trading Informations Risk in percentage For Multiple trades Combine Takeprofit and Combine Stoplosses
Overview Mirror Signals Service EA (Text only)   is a powerful monitoring Expert Advisor that automatically sends   real-time Telegram notifications   for all important trade events on your MetaTrader 5 account. It is engineered specifically for   signal providers ,   trade-copier operators ,   auditors ,   educators , and   professional trading services   that require immediate, detailed, and reliable reporting. Everything from   entries, exits, SL/TP changes, comment changes, trailing sto
CosmiCLab FIBO
Kirils Subins
CosmiCLab SMC FIBO CosmiCLab SMC FIBO is a professional trading indicator designed for traders who use Smart Money Concepts (SMC), market structure analysis and Fibonacci retracement levels. The indicator automatically detects market swings and builds Fibonacci levels based on the latest impulse movement. It also identifies market structure changes such as BOS (Break of Structure) and CHOCH (Change of Character), helping traders understand the current market direction. CosmiCLab SMC FIBO also pr
Noize Absorption Index
Ekaterina Saltykova
Noize Absorption Index - is the manual trading system that measures the difference of pressure between bears forces and bulls forces. Green line - is a noize free index that showing curent situation. Zero value of index shows totally choppy/flat market.Values above zero level shows how powerfull bullish wave is and values below zero measures bearish forces.Up arrow appears on bearish market when it's ready to reverse, dn arrow appears on weak bullish market, as a result of reverse expectation.
Premium level Pro
Dmitriy Kashevich
Premium level is a unique indicator with more than 80% accuracy of correct predictions! This indicator has been tested for more than two months by the best Trading Specialists! The author's indicator you will not find anywhere else! From the screenshots you can see for yourself the accuracy of this tool! 1 is great for trading binary options with an expiration time of 1 candle. 2 works on all currency pairs, stocks, commodities, cryptocurrencies Instructions: As soon as the red arrow app
Inverted_Chart_EA Utility Expert Advisor Inverted_Chart_EA creates and maintains a mirror-inverted chart of any symbol and timeframe. It automatically generates a custom instrument (e.g. US30_INV ) and keeps its price history updated in real time, with bars mirrored around a chosen pivot. This utility gives traders a new way to analyze the market from a different perspective by flipping the chart upside down. Why use an inverted chart? Highlight hidden patterns – price formations that look ordin
RRtoolBox
David Ruiz Moreno
RRtoolbox - Professional Tools: Risk:Reward Trading Tool (SL/TP Horizontals + Pending orders + Diagonals), Alerts set on trend lines (for alerts on diagonal levels), SelfManagement (BE, partials...), close/cancelling by time, Statistics, Info and trading on chart. One-Click Trading with Visual Risk:Reward Management RRtoolbox is a comprehensive trading panel that combines one-click order execution,  statistics and  powerful visual Risk:Reward tools, alerts set with trendlines, on chart butt
Expert TP SL v04 - Professional Trading Assistant with AI Motivation System Advanced manual trading tool with automatic risk management, overtrading protection, and intelligent psychological support for disciplined trading. PRODUCT OVERVIEW Expert TP SL v04 is a comprehensive trading assistant designed for manual traders who want to maintain emotional discipline while automating risk calculations. This isn't just another order placement tool - it's a complete trading psychology system that pr
SMC Venom Model BPR 지표는 Smart Money(SMC) 개념 내에서 일하는 트레이더를 위한 전문 도구입니다. 가격 차트에서 두 가지 주요 패턴을 자동으로 식별합니다. FVG (공정 가치 갭)는 3개의 캔들의 조합으로, 첫 번째와 세 번째 캔들 사이에 갭이 있습니다. 이는 볼륨 지원이 없는 레벨 사이에 구역을 형성하여 종종 가격 수정으로 이어집니다. BPR (균형 가격 범위)은 두 개의 FVG 패턴의 조합으로, "브리지"를 형성합니다. 이는 가격이 낮은 볼륨 활동으로 움직일 때 브레이크아웃과 레벨로의 복귀 구역으로, 캔들 사이에 갭을 생성합니다. 이러한 패턴은 거래자가 차트에서 거래량과 가격 역학을 분석하여 주요 지지/저항 수준, 돌파 구역 및 진입 지점을 식별하는 데 도움이 되며, 여기서 대형 시장 참여자와 일반 참여자 간의 상호 작용이 발생합니다. 이 지표는 사각형과 화살표 형태로 패턴을 시각화하며 유연한 경고 설정도 지원합니다. 주요 특징: 패턴 표시 모드
Pro Gold System Indicator
PEDRO JOAQUIM GONCALVES GOMES
ADVANCED FUNCTIONALITIES: Trend Score (0-100) with visual bar Intelligent signals with adjustable strength (1-10) Risk management with automatic TP/SL Audible and visual alerts Price zones with smooth filling Multi-indicator analysis (RSI, ATR, BB, EMAs) DESIGN FEATURES Modern Visual: Smooth and well-spaced lines (EMA with 2-3px width) Vibrant and professional colors (Sky Blue, Orange, Gold) Modern arrows (code 233/234) for buy/sell signals Configurable dark/light theme Adjustable transparency f
Overview Mirror Signals EA is a powerful monitoring Expert Advisor that automatically sends real-time Telegram notifications for all important trade events on your MetaTrader 5 account. It is engineered specifically for signal providers , trade-copier operators , auditors , educators , and professional trading services that require immediate, detailed, and reliable reporting. Everything from entries, exits, SL/TP changes, comment changes, trailing stop activations, pending order modifications
Price Magnet — Price Density and Attraction Levels Indicator Price Magnet is a professional analytical tool designed to identify key support and resistance levels based on statistical Price Density. The indicator analyzes a specified historical period and detects price levels where the market spent the most time. These zones act as “magnets,” attracting price action or forming a structural base for potential reversals. Unlike traditional Volume Profile tools, Price Magnet focuses on price-time d
Blahtech Market Profile MT5
Blahtech Limited
5 (10)
Was: $249  Now: $99   Market Profile defines a number of day types that can help the trader to determine market behaviour. A key feature is the Value Area, representing the range of price action where 70% of trading took place. Understanding the Value Area can give traders valuable insight into market direction and establish the higher odds trade. It is an excellent addition to any system you may be using. Inspired by Jim Dalton’s book “Mind Over Markets”, this indicator is designed to suit the
Timeframe Trading Limiter
AL MOOSAWI ABDULLAH JAFFER BAQER
Timeframe Trading Limiter is a professional risk management and trade discipline utility designed for MetaTrader 5. It empowers traders to enforce strict, automated limits on the number of trades and the maximum allowable drawdown within each trading period, based directly on the chart timeframe selected. Whether you are a discretionary trader prone to overtrading, a prop firm challenge participant needing to adhere to strict rules, or an algorithmic trader running multiple strategies, this tool
Universal Trend
Maryna Shulzhenko
The Universal Trend indicator was created to detect trends in price movement and allows you to quickly determine not only the direction of the trend, but also understand the levels of interaction between buyers and sellers. The indicator works on all timeframes and currency pairs. The indicator gives fairly accurate signals and it is customary to use it both in trending and flat markets. It is advisable to use the indicator in combination with other tools for more reliable signals and making a
CoPilot dashboard MT5
Frederic Jacques Collomb
CoPilot — 일일 트레이딩 대시보드 숫자를 파악하세요. 명확하게 트레이딩하세요. MT4 버전 CoPilot이란? CoPilot은 전문가 수준의 트레이딩 어시스턴트로, 모든 일일 성과 통계를 실시간으로 차트에 직접 표시합니다 — 라이브 에퀴티 커브 는 거래마다 업데이트됩니다. 차트를 벗어나지 않고 세션을 즉시 파악해야 하는 활발한 트레이더를 위해 설계되었으며, CoPilot은 모든 심볼의 당일 모든 청산된 거래 를 집계하여 깔끔하고 색상 코딩된 인터랙티브 패널로 표시합니다. 터미널 히스토리 탭으로 전환할 필요가 없습니다. 수동 계산도 필요 없습니다. CoPilot은 당신의 부조종사 로서 — 항상 주시하고, 항상 계산하며, 항상 눈앞에 있습니다. 실시간 통계 패널 CoPilot은 세 섹션으로 구성된 완전한 일일 성과 지표를 표시합니다: 활동 — 오늘의 총 거래 수, 청산된 거래, 오픈 포지션, 수익/손실 횟수, 승률 (%) 및 손익분기 거래. 승률 색상은 동적으로 변경: 50% 초
TradePilotmt5
Hossein Khalil Alishir
TradePilot Expert Advisor (EA) for MetaTrader 5 TradePilot is a professional and user-friendly Expert Advisor (EA) for MetaTrader 5 (MT5) . It simplifies automated trading , risk management , and trade execution with a smart trading panel . Perfect for beginners and experienced traders looking for a reliable trade manager EA with automated lot size calculation and smart position management. Key Advantages User-Friendly Trading Panel: Customizable panel with buttons and hotkeys for fast ex
RBreaker
Zhong Long Wu
RBreaker Gold Indicators는 금 선물을 위한 단기 데이 트레이딩 전략으로, 추세 추종과 데이 내 반전의 두 가지 거래 방식을 결합합니다. 추세 장에서 수익을 포착할 수 있을 뿐만 아니라, 시장이 반전될 때 적시에 이익을 확정하고 추세에 맞춰 반대 포지션을 잡을 수 있습니다. 이 전략은 미국 잡지 Futures Truth에서 15년 연속으로 가장 수익성 높은 트레이딩 전략 상위 10위 안에 선정되었습니다. 긴 라이프사이클을 자랑하며, 현재까지 국내외에서 널리 사용되고 연구되고 있습니다. 본 지표는 2026년 금 선물의 움직임을 반영하여 14일 ATR 지표를 기반으로 돌파 계수 A, 관찰 계수 B, 반전 계수 R을 보다 합리적인 값으로 정의했습니다. 매우 훌륭한 지표이며, 안정적인 연간 수익성을 달성했습니다. 강력히 추천합니다~ 위 지표는 변동성이 높은 상품에 적합하며, 매개변수는 금 선물, 주가 지수 선물 등에 적합합니다. 다른 상품이 필요한 경우 돌파 계수 A
Classic SNR MetaTrader 5 Expert Advisor | Multi-Symbol Support & Resistance Trading with Trend-Based Logic Overview Classic SNR Breakout EA is a professional trading robot that identifies structural Support & Resistance levels using daily swing points and executes trades based on H1 price action relative to these levels. The EA applies   dual logic : in an uptrend, it sells on H1 rejection below an SNR level; in a downtrend, it buys on H1 rejection above an SNR level. Breakout confirmations are
Trade Manger
Israr Hussain Shah
Here   our more valuable tools SMC Trend Trading   ,  Easy SMC Trading  ,  Institutional SMC Architect Volume Analysis Tools  ,  Volume flow Profile  ,  Market volume profile  , FVG with Volume  , Liquidity Heatmap Profile  ,  Volume Spread Analysis You Give an Instruction: When you run the script, a window pops up with a dropdown menu. You choose exactly what you want it to do from the list (e.g., "Close Profit Only" or "Delete Pending Orders"). It Scans Your Positions: The script then reads
| Fully-automated Smart Money Concept (ICT) inspired trading solution with multi-strategy capabilities | Built by a grid trader >> for grid traders.  This is MT5 version, click  here  for  Blue CARA MT4  (settings and logics are same in both versions)     Real monitoring signal  -->  Cara Gold Intro Blue CARA EA   ('CARA') - short for  C omprehensive  A lgorithmic   R esponsive   A dvisor is a next-gen  multi-currency    multi-timeframe  EA base on the widely known (and perhaps the most popul
Order Book, known also as Market Book, market depth, Level 2, - is a dynamically updated table with current volumes of orders to buy and to sell specific financial instument at price levels near Bid and Ask. MetaTrader 5 provides the means for receiving market book from your broker, but in real time only, without access to its history. The indicator OrderBook Cumulative Indicator accumulates market book data online and visualizes them on the chart. In addition, the indicator can show the market
ALIEN Dashboard
Youssef Esseghaiar
ALIEN DASHBOARD FULL EDITION – Professional ICT & Precision Trading Dashboard for MT5 ( HYBRID ENGINE ) Overview The   Alien Dashboard Full Edition   is a comprehensive, all‑in‑one technical indicator for MetaTrader 5 that merges the most powerful concepts from Inner Circle Trader (ICT) methodology with advanced precision‑entry logic, multi‑timeframe analysis, and an intuitive on‑chart dashboard. Designed for serious traders who want to visualise institutional order flow, identify high‑probabili
차트에 직접 메모를 작성하고 거래 시 관찰 내용을 활용하세요 심볼 간 리마인더 동기화 옵션을 사용하면 현재 시장 상태에 대한 중요한 정보를 기억할 수 있습니다 따라서 , 이 도구는 이전에 확인한 중요한 정보가 거래 중 누락되는 상황을 방지하는 데 도움을 줍니다 . 다기능 도구 : 66+ 기능, 이 도구 포함  |   질문이 있으면 연락주세요   |   MT4 버전 설정: 메모 동기화 방법 : 동일한 심볼 간 동기화; 각 차트에 고유한 메모; 모든 곳에 동일한 메모 ; 선택적으로 , 메모를 생성한 시간 프레임과 연결할 수 있습니다 ; 시각화 설정 : 텍스트 위치; 폰트: 색상, 스타일, 크기; 메모를 편집하려면 , 오른쪽 하단 모서리에 있는 버튼 [ e] 을 클릭하세요 : 입력 필드가 표시됩니다 . 프로그램 파일은 " Indicators " 디렉토리에 위치해야 합니다.
SmartRAL
Jemy Yeferson Dimu Ludji
SmartRAL (Smart Risk Auto-Lot EA) SmartRAL: The Ultimate Risk & Lot Management Expert Advisor (EA) SmartRAL is an essential tool for traders who demand precise risk management and automated position sizing in MetaTrader 5. Stop guessing your lot size and let the algorithm handle the calculations. This EA allows you to trade with confidence by guaranteeing your risk exposure on every single trade, while offering absolute flexibility in setting your Stop Loss (SL). Key Features & Benefits Guarante
SolarTrade Suite Financial Robot: LaunchPad Market Expert - 거래를 시작하도록 설계되었습니다! 이 거래 로봇은 특별하고 혁신적이며 고급 알고리즘을 사용하여 가치를 계산합니다. 금융 시장의 세계에서 여러분의 조수입니다. SolarTrade Suite 시리즈의 지표 세트를 사용하여 이 로봇을 시작할 순간을 더 잘 선택하세요. 설명 하단에서 SolarTrade Suite 시리즈의 다른 제품을 확인하세요. 투자와 금융 시장의 세계를 자신 있게 탐색하고 싶으신가요? SolarTrade Suite Financial Robot: LaunchPad Market Expert는 정보에 입각한 투자 결정을 내리고 수익을 늘리는 데 도움이 되도록 만들어진 혁신적인 소프트웨어입니다. SolarTrade Suite Financial Robot: LaunchPad Market Expert의 장점: - 정확한 계산: 로봇은 고급 알고리즘과 분석 방법을 사
Headline ShikaaTraders Gold Grid Pro is a high-performance trade management utility designed specifically for XAUUSD (Gold) and high-volatility pairs. It allows traders to execute complex grid-layering strategies with a single click, ensuring you never miss an entry during fast market moves. Why Choose Gold Grid Pro? Manual trading on Gold requires speed. Manually calculating distances and opening multiple positions takes too much time. This utility automates the "Scaling-In" process, allowing y
MT5용 암호화폐 외환 지표 "WPR with 2 Moving Averages" (리페인트 없음) - WPR 자체는 스캘핑에 가장 적합한 오실레이터 중 하나입니다. - "WPR and 2 Moving Averages" 지표는 WPR 오실레이터의 빠른 이동평균과 느린 이동평균을 함께 보여줍니다. - 이 지표는 가격 조정을 매우 빠르게 감지할 수 있도록 도와줍니다. - 매개변수를 통해 간편하게 설정할 수 있으며, 모든 시간대에 사용 가능합니다. - 매수 및 매도 진입 조건은 그림에서 확인할 수 있습니다. - WPR MA 교차 시 PC 및 모바일 알림 기능 제공. 매수 신호 조건 예시: (1) 빠른 이동평균이 느린 이동평균을 상향 돌파하고 WPR 값이 -50 미만이면 매수 진입. (2) WPR 값이 -20 이상으로 과매수 영역에 진입하면 매수 포지션 청산. 매도 신호 조건 예시: (1) 빠른 이동평균이 느린 이동평균을 하향 돌파하고 WPR 값이 -50 이상이면 매도 진입. (2) -
"Impulses and Corrections 5" is created to help traders navigate the market situation. The indicator shows multi-time frame upward and downward "Impulses" of price movements. These impulses are the basis for determining the "Base" , which is composed of zones of corrections of price movements, as well as "Potential" zones for possible scenarios of price movement. Up and down impulses are determined based on a modified formula of Bill Williams' "Fractals" indicator. The last impulse is always "U
이 제품의 구매자들이 또한 구매함
Trade Assistant MT5
Evgeniy Kravchenko
4.42 (212)
거래당 위험 계산, 라인을 사용한 손쉬운 신규 주문, 부분 청산 기능을 통한 주문 관리, 7가지 유형의 트레일링 스탑 및 기타 유용한 기능을 제공합니다. 추가 자료 및 지침 설치 지침   -   애플리케이션 지침   -   데모 계정용 애플리케이션 평가판 라인 기능       - 차트에 개시선, 손절매, 차익실현을 표시합니다. 이 기능을 사용하면 새로운 주문을 쉽게 하고 개봉 전에 추가 특성을 볼 수 있습니다. 위기 관리       -       위험 계산 기능은 설정된 위험과 손절매 주문의 크기를 고려하여 새 주문의 볼륨을 계산합니다. 이를 통해 손절매 크기를 설정하고 동시에 설정된 위험을 존중할 수 있습니다. 로트 계산 버튼 - 위험 계산을 활성화/비활성화합니다. 필요한 위험 값은 위험 필드에 0에서 100 사이의 백분율 또는 예금 통화로 설정됩니다. 설정 탭에서 위험 계산 옵션을 선택합니다. $ 통화, % 잔액, % 지분, % 자유 마진, % 사용자 정의, % AB 이전
Trade Manager EA에 오신 것을 환영합니다. 이 도구는 거래를 보다 직관적이고 정확하며 효율적으로 만들기 위해 설계된 궁극적인 리스크 관리 도구 입니다. 단순한 주문 실행 도구가 아닌, 원활한 거래 계획, 포지션 관리 및 리스크 제어를 위한 종합 솔루션입니다. 초보자부터 고급 트레이더, 빠른 실행이 필요한 스캘퍼에 이르기까지 Trade Manager EA는 외환, 지수, 상품, 암호화폐 등 다양한 시장에서 유연성을 제공합니다. Trade Manager EA를 사용하면 복잡한 계산은 이제 과거의 일이 됩니다. 시장을 분석하고 진입, 손절 및 익절 수준을 차트의 수평선으로 표시한 후 리스크를 설정하면, Trade Manager가 이상적인 포지션 크기를 즉시 계산하고 SL 및 TP 값을 실시간으로 표시합니다. 모든 거래가 간편하게 관리됩니다. 주요 기능: 포지션 크기 계산기 : 정의된 리스크에 따라 거래 크기를 즉시 결정합니다. 간단한 거래 계획 : 진입, 손절, 익절을 위한
Local Trade Copier EA MT5
Juvenille Emperor Limited
4.96 (140)
Local Trade Copier EA MT5 를 사용하여 매우 빠른 거래 복사 경험을 해보세요. 1분 안에 간편하게 설정할 수 있으며, 이 거래 복사기를 사용하면 Windows 컴퓨터 또는 Windows VPS에서 여러 개의 MetaTrader 터미널 간에 거래를 0.5초 미만의 초고속 복사 속도로 복사할 수 있습니다. 초보자든 전문가든   Local Trade Copier EA MT5 는 다양한 옵션을 제공하여 사용자의 특정 요구에 맞게 맞춤 설정할 수 있습니다. 이는 수익 잠재력을 높이려는 모든 사람을 위한 최고의 솔루션입니다. 지금 사용해보시고 이것이 왜 시장에서 가장 빠르고 쉬운 무역용 복사기인지 알아보세요! 팁: 여기 에서 데모 계정에서 Local Trade Copier EA MT5 데모 버전을 다운로드하여 사용해 볼 수 있습니다. 다운로드한 무료 데모 파일을 MT5 >> File >> Open Data Folder >> MQL5 >> Experts 폴더에 붙여넣고 터
베타 출시 Telegram to MT5 Signal Trader 는 곧 공식 알파 버전을 출시할 예정입니다. 일부 기능은 아직 개발 중이며, 작은 버그가 발생할 수 있습니다. 문제가 있으면 꼭 보고해 주세요. 여러분의 피드백은 소프트웨어 개선에 도움이 됩니다. Telegram to MT5 Signal Trader 는 Telegram 채널 또는 그룹의 거래 신호를 자동으로 MetaTrader 5 계정으로 복사하는 강력한 도구입니다. 공개 및 비공개 채널을 모두 지원하며, 여러 신호 제공자를 여러 MT5 계정에 연결할 수 있습니다. 소프트웨어는 빠르고 안정적으로 동작하며, 복사된 거래를 완벽히 제어할 수 있습니다. 인터페이스는 깔끔하며 대시보드와 차트가 시각적으로 구성되어 있고, 직관적인 네비게이션이 가능합니다. 여러 Signal Account를 관리하고, 공급자별 설정을 세밀하게 조정하며, 모든 동작을 실시간으로 모니터링할 수 있습니다. 필수 조건 MQL의 제한으로 인해 EA는 Te
AI Agent Supervisor is NOT an Expert Advisor. AI Agent Supervisor   is a   multi-agent AI risk & portfolio supervisor   that watches every EA on your account and intervenes in real time.  WANT AN AI PORTFOLIO MANAGER WATCHING YOUR FLEET 24/7?   Run your fleet on the same brokers I do:   IC MARKETS , IC TRADING   .  Unlike the centralized stock market, Forex has no single, unified price feed.  Every broker sources liquidity from different providers, creating unique data streams. The Supervisor r
TradePanel MT5
Alfiya Fazylova
4.87 (157)
Trade Panel은 다기능 거래 도우미입니다. 이 애플리케이션에는 50개 이상의 수동 거래 기능이 포함되어 있으며 대부분의 거래 작업을 자동화할 수 있습니다. 구매하기 전에 데모 계정에서 데모 버전을 테스트할 수 있습니다. 데모 계정용 애플리케이션 체험판 다운로드: https://www.mql5.com/en/blogs/post/750865 . 전체 지침 여기 . 거래. 한 번의 클릭으로 거래를 수행할 수 있습니다: 리스크 자동 계산과 함께 예약 주문 및 포지션 열기. 한 번의 클릭으로 여러 주문 및 포지션 열기. 주문 그리드 열기. 예약 주문 및 포지션을 그룹별로 닫기. 포지션 방향 전환 (Buy 닫기 > Sell 열기, Sell 닫기 > Buy 열기). 포지션 잠금 (부족한 포지션을 열어 Buy와 Sell 포지션의 수량을 동일하게 만들기). 모든 포지션 한 번의 클릭으로 부분적으로 닫기. 모든 포지션의 테이크 프로핏과 스톱로스를 같은 가격 수준에 설정. 모든 포지션의 스톱로스를
Trade Dashboard MT5
Fatemeh Ameri
4.95 (129)
Trade Dashboard simplifies how you open, manage, and control your trades, with built-in lot size calculation. It allows you to execute trades, manage risk, and control positions directly on the chart, with tools such as partial close, breakeven, and trailing stop. Designed to reduce manual work and help you stay focused on your trading decisions. A demo version is available for testing. Detailed explanations of features are provided within the MQL5 platform. Installation instructions are include
Farmed Hedge Yield Farming | All Markets (Manual - Hybrid - Semi/Automated EA) MULTI-ASSET SUPPORT Trade any asset available on your broker - Forex: Major, Minor, Exotic pairs - Crypto: BTC, ETH, XRP, SOL, BNB - Stocks: Apple, Tesla, Amazon, Google, etc. - Commodities: Gold, Silver, Oil, Gas - Indices: US30, NAS100, SPX500, DAX40 - Any CFD your broker offers VERIFIED TRADING RESULTS - Farmed Hedge Yield Axi Copy:  https://www.mql5.com/en/signals/2356376 - Farmed Hedge Yield Exn Copy:   https:/
Exp COPYLOT CLIENT for MT5
Vladislav Andruschenko
3.91 (33)
MetaTrader 5용 전문 트레이드 복사기 MetaTrader 용 빠르고 전문적이며 신뢰할 수 있는 트레이드 복사기 입니다. COPYLOT 은 MT4와 MT5 터미널 간의 Forex 거래 복사를 지원하며, Hedge 및 Netting 계좌를 모두 지원합니다. COPYLOT MT5 버전 지원 구성: - MT5 Hedge → MT5 Hedge - MT5 Hedge → MT5 Netting - MT5 Netting → MT5 Hedge - MT5 Netting → MT5 Netting - MT4 → MT5 Hedge - MT4 → MT5 Netting MT4 버전 전체 설명 + DEMO + PDF 구매 방법 설치 방법 로그 파일 확인 방법 테스트 및 최적화 방법 Expforex의 모든 제품 MT4 터미널로도 거래를 복사할 수 있습니다(MT4 → MT4, MT5 → MT4): COPYLOT CLIENT for MT4 COPYLOT은 2개, 3개, 심지어 10개의 터미널과 동시에 작동할
Premium Trade Manager - MetaTrader 5를 위한 빠르고 규율 있는 거래 관리 도구 Premium Trade Manager 는 결정에만 집중하고 나머지 루틴은 패널이 처리하길 원하는 트레이더를 위한 도구입니다. 크기 계산, 주문 배치, 분할 청산, 트레일링, 뉴스 대응, 프롭 펌 한도 관리까지, 모든 거래에서 동일하게 규율 있는 방식으로 실행됩니다. MetaTrader 5용 빠른 온차트 패널로, 모든 거래에서 기계적인 작업을 완전히 없애줍니다. 방향, 종목, 타이밍은 당신이 결정합니다. 패널이 리스크에 맞춰 포지션 크기를 계산하고, 스톱과 타겟이 설정된 주문을 배치하고, 분할 청산으로 스케일아웃하고, 나머지를 트레일합니다. 펀디드 트레이더에게는 한 걸음 더 나아갑니다. 8개 주요 외환 프롭 펌의 실제 규칙을 내장하고, 각 한도까지 남은 거리를 실시간으로 표시하며, 하드 한도를 위반할 주문은 차단합니다. 구매 전에 직접 체험해 보세요. 인터랙티브 walkthro
Quant AI Agents
Ho Tuan Thang
5 (1)
Quant AI Agents are independent trading Expert Advisors. Instead of trading using a fixed strategy like other conventional EAs, Quant AI Agents   is a   multi-agent AI trading framework   that turns natural-language strategy prompts into live.  WANT THE SAME RESULTS AS MY LIVE SIGNAL?   Use the exact same brokers I do:   IC MARKETS , IC TRADING   .  Unlike the centralized stock market, Forex has no single, unified price feed.  Every broker sources liquidity from different providers, creating un
파워 캔들 전략 스캐너 - 자체 최적화 다중 종목 설정 찾기 도구 파워 캔들 전략 스캐너는 마켓 워치에 등록된 모든 종목에 대해 파워 캔들 지표와 동일한 자체 최적화 엔진을 동시에 실행합니다. 하나의 패널에서 현재 통계적으로 거래 가능한 종목, 각 종목별 최적의 전략, 최적의 손절매/익절 조합을 알려주며, 새로운 신호가 발생하면 즉시 알림을 전송합니다. 이 도구는 Stein Investments 에코시스템의 일부입니다. 18개 이상의 도구와 함께 당신의 1대1 AI 트레이딩 멘토 Max.  항상 대기 중, 모든 인디케이터를 깊이 있게 이해, 무언가를 차근차근 생각해보고 싶은 순간에 도움을 줍니다.  https://stein.investments 에서 만나보세요 완벽한 시장 모니터링. 종목당 3,000건 이상의 자동 최적화. 2가지 알림 유형. 한 번의 클릭으로 차트를 전환하고 바로 거래하세요. 이 도구가 필요한 이유 대부분의 다중 종목 스캐너는 가격 변동만 보여줍니다. 티커별
The product will copy all telegram signal to MT5 ( which you are member) , also it can work as remote copier.  Easy to set up, copy order instant, can work with almost signal formats, image signal,  s upport to translate other language to English Work with all type of channel or group, even channel have "Restrict Saving Content", work with  multi channel, multi MT5 Work as remote copier: with signal have ticket number, it will copy exactly via ticket number. Support to backtest signal. How to s
================================================================================ POC BREAKOUT - V20.72. Full Professional Grade Toolkit ================================================================================ POC Breakout is a full MetaTrader 5 trading dashboard for discretionary traders who want breakout signals, Point of Control (POC) context, volume profiles, order flow, market structure, news, alerts, and advanced trade planning in one professional workspace. Attached directly to you
Signal TradingView to MT5 Pro Automator TradingView와 MetaTrader 5 간의 즉각적인 전문 실행 TradingView 알림과 MT5의 실제 실행을 연결하는 가장 강력한 커뮤니케이션 브리지로 거래 전략을 자동화하세요. 속도, 유연성 및 완벽한 위험 관리를 요구하는 트레이더를 위해 설계된 이 Expert Advisor는 모든 알림 메시지를 정확한 시장가 또는 지정가 주문으로 변환합니다. 강점 및 이점 범용 파싱 엔진(독점 기술): 모든 알림 형식에서 데이터를 자동으로 인식하고 추출할 수 있는 고급 기술입니다. 단일하고 엄격한 형식에 얽매일 필요가 없습니다. 시스템은 심볼, 액션, 가격, SL 및 TP를 자동으로 이해합니다. 실시간 실행: 지연 시간을 최소화하도록 최적화된 1초 미만의 초고속 폴링 기술. 신호 수신 후 몇 밀리초 내에 주문 실행이 이루어집니다. 기관 수준의 위험 관리: 다음 기준에 따른 자동적이고 정확한 로트(Lot) 크기 계
Trade copier MT5
Alfiya Fazylova
4.56 (45)
Trade Copier는 거래 계정 간의 거래를 복사하고 동기화하도록 설계된 전문 유틸리티입니다. 복사는 공급자의 계정/단말기에서 동일한 컴퓨터 또는 vps에 설치된 수신자의 계정/단말기로 발생합니다. 프로모션 - 이미 "Trade copier MT5"를 구매하셨다면, "Trade copier MT4"를 무료로 받으실 수 있습니다 (MT4 → MT5 및 MT4 ← MT5 복사용). 조건에 대한 자세한 정보를 원하시면, 개인 메시지를 통해 저희에게 문의해 주시기 바랍니다! 구매하기 전에 데모 계정에서 데모 버전을 테스트할 수 있습니다. 데모 버전 여기 . 전체 지침 여기 . 주요 기능 및 이점: 복사기는 "МТ5> МТ5", "МТ4> МТ5", "МТ5> МТ4" 복사를 지원합니다. 복사기는 데모 계정 > 실 계정, 실 계정 > 데모 계정, 데모 계정 > 데모 계정 및 실제 계정 > 실 계정 복사를 지원합니다. 복사기는 읽기 전용 암호가 적용된 투자자 계정에서 복사를 지원합니다. 하
Footprint Chart Pro — Professional OrderFlow EA for MetaTrader 5 Version 6.34 | Professional tool for real traders | Institutional-Grade Visualization DEMO USERS - PLEASE SELECT EVERY TICK / REAL TICK WHEN TESTING AND YOU HAVE DOWNLOADED HISTORICAL DATA. IF YOU SEE A WAITING SCREEN AND IT IS NOT DOWNLOADING, IT MEANS YOU HAVE LOW HISTORICAL DATA. TRY 1 MIN AND 5 MIN FIRST ON 1 DAY DATA. ONE DAY DATA SHOULD BE THE NEWEST AND MOST CURRENT DATE. PLEASE WAIT UNTIL THE MARKET HAS ROLLED OVER PERIOD.
The News Filter MT5
Leolouiski Gan
4.78 (23)
이 제품은 뉴스 시간 동안 모든 전문가 어드바이저 및 수동 차트를 필터링하여 수동 거래 설정이나 다른 전문가 어드바이저가 입력한 거래가 파괴될 수 있는 급격한 가격 상승으로부터 걱정하지 않아도 됩니다. 이 제품은 또한 뉴스 발표 전에 열린 포지션과 대기 주문을 처리할 수 있는 완전한 주문 관리 시스템이 함께 제공됩니다.   The News Filter  를 구매하면 더 이상 내장 뉴스 필터에 의존할 필요가 없으며 이제부터 모든 전문가 어드바이저를 여기서 필터링할 수 있습니다. 뉴스 선택 뉴스 소스는 Forex Factory의 경제 캘린더에서 얻어집니다. USD, EUR, GBP, JPY, AUD, CAD, CHF, NZD 및 CNY와 같은 어떤 통화 기준으로 선택할 수 있습니다. Non-Farm (NFP), FOMC, CPI 등과 같은 키워드 식별을 기준으로 선택할 수도 있습니다. 저, 중, 고 영향을 가지는 뉴스를 필터링할 수 있도록 선택할 수 있습니다. 차트와 관련된 뉴스만 선
Prop Firm Os
Gayathiri Gopalakrishnan
5 (1)
PROP FIRM OS Structured Trading Assistant for MetaTrader 5 PROP FIRM OS is a structured trading assistant designed for MetaTrader 5 users who prefer rule-based market analysis and organized trading workflows. The Expert Advisor combines market analysis tools, scanner functions, dashboard monitoring, alerts, risk-control settings, and trade management features inside one system. PROP FIRM OS is designed to help traders follow selected rules, filters, and monitoring conditions during trading activ
Timeless Charts
Samuel Manoel De Souza
5 (6)
Timeless Charts is an all-in-one trading utility for professional traders. It combines custom chart types such as Seconds Charts and Renko with advanced order flow analysis using Footprints , Clusters , Volume Profiles , VWAP studies, and anchored analysis tools for deeper market insight. Trading and position management are handled directly from the chart through an integrated trade management panel , while Market Replay and Virtual Accounts provide environments for practicing trading skills and
Seconds Chart MT5
Boris Sedov
4.59 (17)
Seconds Chart - MetaTrader 5에서 초 단위 차트를 생성하는 독특한 도구입니다. Seconds Chart 를 사용하면 초 단위로 설정된 타임프레임으로 차트를 작성할 수 있어, 표준 분 또는 시간 단위 차트에서는 불가능한 유연성과 정밀한 분석이 가능합니다. 예를 들어, S15 타임프레임은 15초 동안의 캔들로 구성된 차트를 의미합니다. 사용자 정의 심볼을 지원하는 모든 인디케이터와 전문가 어드바이저를 사용할 수 있습니다. 이를 사용하는 것은 표준 차트에서 거래하는 것만큼 편리합니다. 표준 도구와 달리, Seconds Chart 는 초고속 타임프레임에서도 높은 정확도와 지연 없이 작업할 수 있도록 지원합니다. 무료 데모: Seconds Chart v2.29 Demo.ex5 무료 데모를 다운로드하고 직접 확인하십시오: 완전한 기능 - 모든 기능을 제한 없이 사용 가능 24시간 테스트 - 정확성과 편리성을 평가하기에 충분한 시간 데모 계정만 - 대부분의 브로커에서 쉽게
Entry In The Zone with SMC Multi Timeframe is a real-time 2-in-1 market analysis tool that combines market structure analysis and a No Repaint BUY / SELL signal system into a single indicator, built on Smart Money Concepts (SMC) — a widely adopted framework used by professional traders to understand market structure. This indicator helps you see the market more clearly, make decisions based on structure rather than guesswork, and focus on high-probability zones where price is more likely to reac
Anchor Trade Manager
Kalinskie Gilliam
5 (3)
Anchor: The EA Manager Run your full EA portfolio without conflicts, without stacked risk, and without watching every chart yourself. Anchor coordinates up to 64 Expert Advisors on a single account. Attach Anchor to any chart. Type your EA names and magic numbers in one line. Click OK. Anchor begins coordinating immediately. Built for portfolios. Built for discipline. Built for prop firms. The Problem Running multiple EAs on the same account creates risk. Two gold EAs can open opposite positions
Working Demo Download Copy Cat More Trade Copier MT5 is a local trade copier and a complete risk management and execution framework designed for today’s trading challenges. From prop firm challenges to personal portfolio management, it adapts to every situation with a blend of robust execution, capital protection, flexible configuration, and advanced trade handling. The copier works in both Master (sender) and Slave (receiver) modes, with real-time synchronization of market and pending orders,
RiskGuard Management
MONTORIO MICHELE
5 (22)
ATTENTION For a free trial version, visit my website. Manual QUANTUM RiskGuard Management — Your ultimate ally for uncompromising trading. Lot Calculator — Automatic lot size calculation. Quantum — Automatic risk to maximize profits and reduce drawdowns. Automatic Journal — Included and freely downloadable from my website. Automatic Screenshot — Two screenshots: one at entry and one at exit. Partial Profit — Smartly managed partial exits. Smartphone Trading — Place orders from your mobile, mana
HINN MagicEntry Extra
ALGOFLOW OÜ
4.73 (15)
HINN MAGIC ENTRY – the ultimate tool for entry and position management! Place orders by selecting a level directly on the chart! full description   ::  demo-version  :: 60-sec-video-description Key features: - Market, limit, and pending orders - Automatic lot size calculation - Automatic spread and commission accounting - Unlimited partitial take-profits  - Breakeven and trailing stop-loss and take-profit  functions - Invalidation leves - Intuitive, adaptive, and customizable interface - Works
Trade Manager DaneTrades
Levi Dane Benjamin
4.28 (29)
거래 관리자는 위험을 자동으로 계산하는 동시에 거래를 빠르게 시작하고 종료하는 데 도움을 줍니다. 과잉 거래, 복수 거래 및 감정 거래를 방지하는 데 도움이 되는 기능이 포함되어 있습니다. 거래를 자동으로 관리할 수 있으며 계정 성과 지표를 그래프로 시각화할 수 있습니다. 이러한 기능은 이 패널을 모든 수동 거래자에게 이상적으로 만들고 MetaTrader 5 플랫폼을 향상시키는 데 도움이 됩니다. 다중 언어 지원. MT4 버전  |  사용자 가이드 + 데모 트레이드 매니저는 전략 테스터에서 작동하지 않습니다. 데모를 보려면 사용자 가이드로 이동하세요. 위기 관리 % 또는 $를 기준으로 위험 자동 조정 고정 로트 크기 또는 거래량과 핍을 기반으로 한 자동 로트 크기 계산을 사용하는 옵션 RR, Pips 또는 Price를 사용한 손익분기점 손실 설정 추적 중지 손실 설정 목표 달성 시 모든 거래를 자동으로 마감하는 최대 일일 손실률(%)입니다. 과도한 손실로부터 계정을 보호하고 과도한
Effortlessly calculate lot sizes and manage trades to save time and avoid costly errors The Trade Pad Pro EA is a tool for the Metatrader Platform that aims to help traders manage their trades more efficiently and effectively. It has a user-friendly visual interface that allows users to easily place and manage an unlimited number of trades, helping to avoid human errors and enhance their trading activity. [ Installation Guide | Update Guide | Troubleshooting | FAQ | All Products ] One of the k
News Filter EA
Rashed Samir
5 (1)
News Filter EA: Advanced Algo Trading Assistant News Filter EA is an advanced algo trading assistant designed to enhance your trading experience. By using the News Filter EA , you can integrate a Forex economic news filter into your existing expert advisor, even if you do not have access to its source code. In addition to the news filter, you can also specify trading days and hours for your expert. The News Filter EA also includes risk management  and equity protection features. MT4 Version KEY
MetaTrader 5용 트레이딩 패널 — 차트와 키보드에서 실행하는 프로페셔널 원클릭 트레이딩 활동적인 트레이더를 위해 설계된 고급 Trading Panel로, MetaTrader 기본 인터페이스보다 훨씬 빠르고 직관적으로 포지션과 주문을 열고, 관리하고, 종료할 수 있습니다. 이 패널은 포지션 관리, 대기 주문 제어, 총수익 관리, 체결 속도를 하나의 전문적인 작업 공간에 통합하고 싶은 트레이더를 위한 솔루션입니다. 이것은 단순한 보조 유틸리티가 아닙니다. MetaTrader 5를 위한 진정한 trading cockpit입니다. 차트에서 직접 거래하고, 키보드로 빠르게 명령을 실행하며, 자동 계산과 시각적 가이드를 통해 수동 트레이딩을 더 빠르고, 더 명확하고, 더 편리하게 만들어 줍니다.  이 패널을 사용하면 차트에서 단 한 번의 클릭으로 거래를 실행할 수 있으며, 표준 MetaTrader 컨트롤보다 최대 30배 빠르게 거래 작업을 수행할 수 있습니다. 새로운 프리미엄 버전
제작자의 제품 더 보기
1. Why did I develop this series of indicators I found that most traders need to use multiple time frame indicators. They usually switch time frame to see indicators. However, once the timeframe is switched, you cannot see the  corresponding relationship  between  the price in the smaller timeframe  and  the indicator in the larger timeframe . For example: if your price chart is in H1 timeframe, you can see H4, D1 and W1 indicators in H1 timeframe Chart. This is more helpful for you to find th
This product can be used to synchronize multiple Charts, and each Chart can be set to a different sync mode. With this product you can better view and manipulate charts: different time frames for a single Symbol, the same time frame for multiple Symbols... and more. PS: The link below is the FreeDemo product, you can use it on EURUSD/XUAUSD/USDCNH symbol: https://www.mql5.com/en/market/product/38557 Feature: Chart settings  can be synchronized, including : background, indentation, size, etc. M
Do you think it's a bit cumbersome when you need to switch symbols or timeframes with mouse click? 1. What is this? This is a program that can switch symbols and timeframes with direction keys. Fast switching, very convenient, no mouse click required. For traders, one symbol with multi-timeframe charts are usually added,  you can change symbol on those charts easily. For multi-currency traders, different symbol charts are usually added, you can also change those timeframes easily. I wrote this p
1. What is this         Rising volatility and falling volatility are not the same, whether it is academic research or actual testing has shown this point.         The original ATR indicator is calculated by putting up and down fluctuations together. This indicator is to calculate separately the upward volatility and the downward volatility, which can better help you study the market. 2. Indicator description          There are two modes for the calculation of this indicator, as shown in the fo
Have you ever take a long time to watch a Symbol when the network link is not good ? Have you ever wait for a long time when you switch chart between different Symbols or different TimeFrames ? If you do long-term backtesting , Have you ever to be downloaded datas for a long time ? Yes, If there is no data in the system, those will happen.  1. What is this: Download all the Symbol data in Market Watch to the system. PS: This is not outputting data to Files. This Link go to Demo version: https:/
This product can be used to synchronize multiple Charts, and each Chart can be set to a different sync mode. With this product you can better view and manipulate charts: different time frames for a single Symbol, the same time frame for multiple Symbols, system indicators for single/multiple Symbols... and more. Feature: Chart settings can be synchronized, including : background, indentation, size, etc. Multiple Chart window start times  or end times can be synchronized. Multiple Chart time fr
I see that many tools in the market deal with Position and Order in the form of operation panels. Which is loaded into a Chart in the form of an EA. However, once the operator panel EA is loaded, no other EAs can be loaded. So, I wrote the one-click operation of Position and Order as a script, so you can load other EAs and easily complete one-click operation of Trade. 1. What is this: This is a one-click script to close position order. Now you can close position tickets at high speed, for examp
I see that many tools in the market deal with Position and Order in the form of operation panels. Which is loaded into a Chart in the form of an EA. However, once the operator panel EA is loaded, no other EAs can be loaded. So, I wrote the one-click operation of Position and Order as a script, so you can load other EAs and easily complete one-click operation of Trade. 1. What is this: This is a one-click script to delete the pending order . Now you can delete pending tickets at high speed, for
Do you think it's a bit cumbersome when you need to switch symbols or timeframes with mouse click? 1. What is this? This is a program that can switch symbols and timeframes with direction keys. Fast switching, very convenient, no mouse click required. For traders, one symbol with multi-timeframe charts are usually added,  you can change symbol on those charts  easily . For multi-currency traders, different symbol charts are usually added, you can also change those timeframes easily. I wrote thi
According to trading experience: Some symbols are easy to reverse on certain days, such as Monday, or afternoon, and so on. So comparing the current price with the corresponding historical moment price is valuable. If the price coordinate system uses a logarithmic price, you will get a lot of valuable information. 1. What is this? This program can convert the symbol price and add it to your Chart. You can compare it with your major chart. The DEMO version Link: https://www.mql5.com/en/market/pr
What is this: Violent trading: means sending a large number of orders to your brokerage server,  it can conduct a stress test of the trading. In this program you can run a variety of trading tests.  Now you can trade at high speed, For example 1000 orders in an instant. The Demo version's link:  https://www.mql5.com/en/market/product/38431/ Why to use: Whether manual trading or EA trading,  the status of the broker server is very important. So it is beneficial to conduct a trading stress test on
1. Why did I develop this series of indicators I found that most traders need to use multiple time frame indicators. They usually switch time frame to see indicators. However, once the timeframe is switched, you cannot see the  corresponding relationship  between  the price in the smaller timeframe  and  the indicator in the larger timeframe . For example: if your price chart is in H1 timeframe, you can see H4, D1 and W1 indicators in H1 timeframe Chart. This is more helpful for you to find th
필터:
Аврора
96
Аврора 2023.04.21 05:11 
 

사용자가 평가에 대한 코멘트를 남기지 않았습니다

리뷰 답변