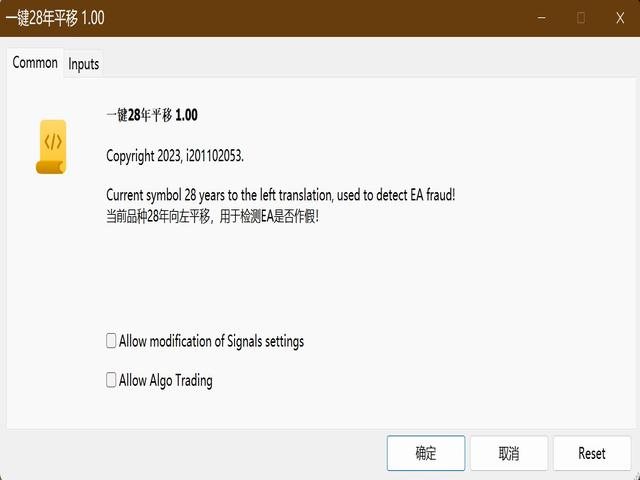
OneKey 28 Year Shift

1. What is this

Many of the EA's on the market have cheats inside to optimize its money curve, which results in the buyer wasting money and effort and buying a junk EA.

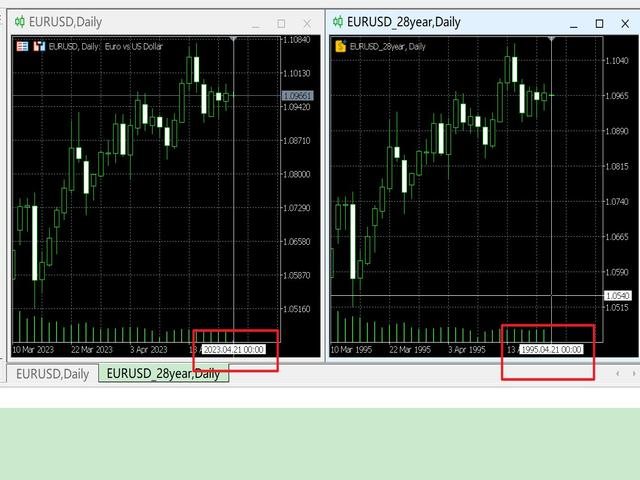
This tool is an effective tool for detecting whether an EA is cheating by allowing the data to be panned to the left for 28 years.
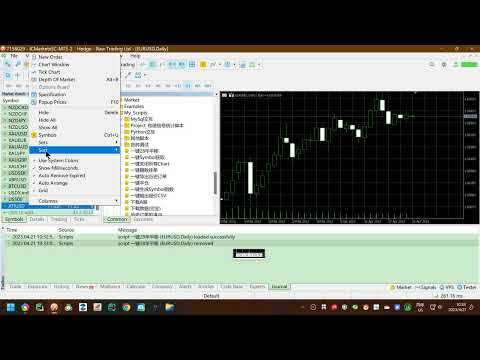
2. How to use

  • a. Load it and it will generate a new symbol, usually it will be named with a suffix. 
    • For example, EURUSD --> EURUSD_28year.
  • b. If your want to test one EA, you should open The time frame corresponding to the  EURUSD_28year. 
    • For example, you want to test M15, your should open  EURUSD_28year M1, and  EURUSD_28year M15.

If you buy an EA that needs to be tested on EURUSD, maybe the money curve is very nice. You also need to check again on EURSUD_28year to see if the EA is cheating.

The minimum accuracy is 1 minute, it does not support tick because the amount of data is too large and unnecessary, usually 1 minute is enough.

It can test the EA DEMO version on the market. The purpose of developing it is to help others identify cheating EA.
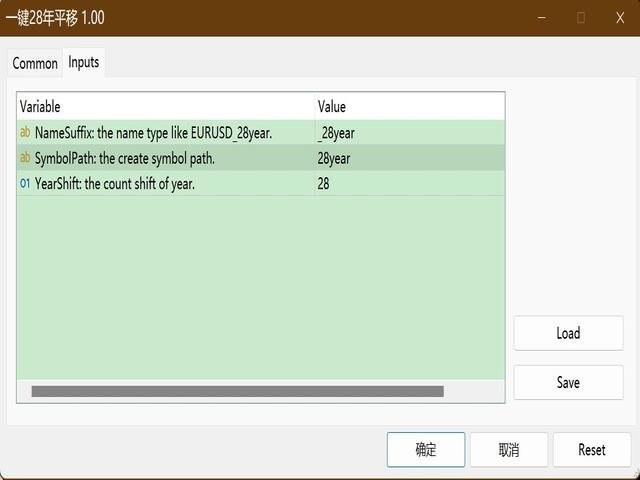
For example, use 28yearsshift to generate Eurusd_28year.  You need to test an EA DEMO version on EURUSD, and then test EURUSD_28year.  Two results are compared to determine whether EA has cheating.


3. Parameters:

  • NameSuffix = "_28year"; // NameSuffix: the name type like EURUSD_28year.
  • SymbolPath = "28year"; // SymbolPath: the create symbol path.
  • YearShift = 28; // YearShift: the count shift of year. >0 is shift to left, 2028->2000; <0 is shift to right, 2028->2056.


Thanks for using it and look forward to you finding a good EA instead of getting ripped off.


Produits recommandés
Trading Utility for Forex Currency Pairs Only not for Gold  Functions Auto Lot Calculation based on Risk Auto stoploss  Auto TakeProfit Breakeven Auto Close Half % Close in percentage with respect to the PIPs Pending Orders BuyLimit Sell Limit with distances BuyStop Sell Stop    with distances Trading Informations Risk in percentage For Multiple trades Combine Takeprofit and Combine Stoplosses
Overview Mirror Signals Service EA (Text only)   is a powerful monitoring Expert Advisor that automatically sends   real-time Telegram notifications   for all important trade events on your MetaTrader 5 account. It is engineered specifically for   signal providers ,   trade-copier operators ,   auditors ,   educators , and   professional trading services   that require immediate, detailed, and reliable reporting. Everything from   entries, exits, SL/TP changes, comment changes, trailing sto
CosmiCLab SMC FIBO CosmiCLab SMC FIBO is a professional trading indicator designed for traders who use Smart Money Concepts (SMC), market structure analysis and Fibonacci retracement levels. The indicator automatically detects market swings and builds Fibonacci levels based on the latest impulse movement. It also identifies market structure changes such as BOS (Break of Structure) and CHOCH (Change of Character), helping traders understand the current market direction. CosmiCLab SMC FIBO also pr
Noize Absorption Index - is the manual trading system that measures the difference of pressure between bears forces and bulls forces. Green line - is a noize free index that showing curent situation. Zero value of index shows totally choppy/flat market.Values above zero level shows how powerfull bullish wave is and values below zero measures bearish forces.Up arrow appears on bearish market when it's ready to reverse, dn arrow appears on weak bullish market, as a result of reverse expectation.
Le niveau Premium est un indicateur unique avec une précision de plus de 80 % des prédictions correctes ! Cet indicateur a été testé par les meilleurs Trading Specialists depuis plus de deux mois ! L'indicateur de l'auteur que vous ne trouverez nulle part ailleurs ! À partir des captures d'écran, vous pouvez constater par vous-même la précision de cet outil ! 1 est idéal pour le trading d'options binaires avec un délai d'expiration de 1 bougie. 2 fonctionne sur toutes les paires de devises
Inverted_Chart_EA Utility Expert Advisor Inverted_Chart_EA creates and maintains a mirror-inverted chart of any symbol and timeframe. It automatically generates a custom instrument (e.g. US30_INV ) and keeps its price history updated in real time, with bars mirrored around a chosen pivot. This utility gives traders a new way to analyze the market from a different perspective by flipping the chart upside down. Why use an inverted chart? Highlight hidden patterns – price formations that look ordin
RRtoolBox
David Ruiz Moreno
RRtoolbox - Professional Tools: Risk:Reward Trading Tool (SL/TP Horizontals + Pending orders + Diagonals), Alerts set on trend lines (for alerts on diagonal levels), SelfManagement (BE, partials...), close/cancelling by time, Statistics, Info and trading on chart. One-Click Trading with Visual Risk:Reward Management RRtoolbox is a comprehensive trading panel that combines one-click order execution,  statistics and  powerful visual Risk:Reward tools, alerts set with trendlines, on chart butt
Expert TP SL v04 - Professional Trading Assistant with AI Motivation System Advanced manual trading tool with automatic risk management, overtrading protection, and intelligent psychological support for disciplined trading. PRODUCT OVERVIEW Expert TP SL v04 is a comprehensive trading assistant designed for manual traders who want to maintain emotional discipline while automating risk calculations. This isn't just another order placement tool - it's a complete trading psychology system that pr
L'indicateur SMC Venom Model BPR est un outil professionnel pour les traders travaillant dans le concept Smart Money (SMC). Il identifie automatiquement deux modèles clés sur le graphique des prix: FVG   (Fair Value Gap) est une combinaison de trois bougies, dans laquelle il y a un écart entre la première et la troisième bougie. Forme une zone entre les niveaux où il n'y a pas de support de volume, ce qui conduit souvent à une correction des prix. BPR   (Balanced Price Range) est une combinaiso
Pro Gold System Indicator
PEDRO JOAQUIM GONCALVES GOMES
ADVANCED FUNCTIONALITIES: Trend Score (0-100) with visual bar Intelligent signals with adjustable strength (1-10) Risk management with automatic TP/SL Audible and visual alerts Price zones with smooth filling Multi-indicator analysis (RSI, ATR, BB, EMAs) DESIGN FEATURES Modern Visual: Smooth and well-spaced lines (EMA with 2-3px width) Vibrant and professional colors (Sky Blue, Orange, Gold) Modern arrows (code 233/234) for buy/sell signals Configurable dark/light theme Adjustable transparency f
Overview Mirror Signals EA is a powerful monitoring Expert Advisor that automatically sends real-time Telegram notifications for all important trade events on your MetaTrader 5 account. It is engineered specifically for signal providers , trade-copier operators , auditors , educators , and professional trading services that require immediate, detailed, and reliable reporting. Everything from entries, exits, SL/TP changes, comment changes, trailing stop activations, pending order modifications
Price Magnet — Price Density and Attraction Levels Indicator Price Magnet is a professional analytical tool designed to identify key support and resistance levels based on statistical Price Density. The indicator analyzes a specified historical period and detects price levels where the market spent the most time. These zones act as “magnets,” attracting price action or forming a structural base for potential reversals. Unlike traditional Volume Profile tools, Price Magnet focuses on price-time d
Was: $249  Now: $99   Market Profile defines a number of day types that can help the trader to determine market behaviour. A key feature is the Value Area, representing the range of price action where 70% of trading took place. Understanding the Value Area can give traders valuable insight into market direction and establish the higher odds trade. It is an excellent addition to any system you may be using. Inspired by Jim Dalton’s book “Mind Over Markets”, this indicator is designed to suit the
Timeframe Trading Limiter
AL MOOSAWI ABDULLAH JAFFER BAQER
Timeframe Trading Limiter is a professional risk management and trade discipline utility designed for MetaTrader 5. It empowers traders to enforce strict, automated limits on the number of trades and the maximum allowable drawdown within each trading period, based directly on the chart timeframe selected. Whether you are a discretionary trader prone to overtrading, a prop firm challenge participant needing to adhere to strict rules, or an algorithmic trader running multiple strategies, this tool
Universal Trend
Maryna Shulzhenko
The Universal Trend indicator was created to detect trends in price movement and allows you to quickly determine not only the direction of the trend, but also understand the levels of interaction between buyers and sellers. The indicator works on all timeframes and currency pairs. The indicator gives fairly accurate signals and it is customary to use it both in trending and flat markets. It is advisable to use the indicator in combination with other tools for more reliable signals and making a
Utilitaire de gestion automatique des commandes et des risques. Permet de tirer le maximum des bénéfices et de limiter vos pertes. Créé par un commerçant pratiquant pour les commerçants. L'utilitaire est facile à utiliser, fonctionne avec tous les ordres de marché ouverts manuellement par un trader ou avec l'aide de conseillers. Peut filtrer les transactions par nombre magique. L'utilitaire peut fonctionner avec n'importe quel nombre de commandes en même temps. A les fonctions suivantes : 1
CoPilot dashboard MT5
Frederic Jacques Collomb
CoPilot — Tableau de bord de trading journalier Connaissez vos chiffres. Tradez avec clarté. MT4 version Qu'est-ce que CoPilot ? CoPilot est un assistant de trading de niveau professionnel qui affiche en temps réel toutes vos statistiques de performance journalière directement sur le graphique — avec une courbe d'équité live qui se met à jour trade par trade. Conçu pour les traders actifs qui ont besoin d'une visibilité instantanée sur leur session sans quitter le graphique, CoPilot agrège chaqu
TradePilotmt5
Hossein Khalil Alishir
TradePilot Expert Advisor (EA) for MetaTrader 5 TradePilot is a professional and user-friendly Expert Advisor (EA) for MetaTrader 5 (MT5) . It simplifies automated trading , risk management , and trade execution with a smart trading panel . Perfect for beginners and experienced traders looking for a reliable trade manager EA with automated lot size calculation and smart position management. Key Advantages User-Friendly Trading Panel: Customizable panel with buttons and hotkeys for fast ex
RBreaker
Zhong Long Wu
RBreaker Gold Indicators est une stratégie de trading intraday à court terme pour les contrats à terme sur l'or, qui combine deux approches : le suivi de tendance et le retournement intraday. Elle permet non seulement de capturer les profits dans les marchés en tendance, mais aussi de prendre des bénéfices en temps opportun lors des retournements de marché et d'ouvrir une position en sens inverse. Cette stratégie a été classée pendant 15 années consécutives parmi les dix stratégies de trading l
Classic SNR MetaTrader 5 Expert Advisor | Multi-Symbol Support & Resistance Trading with Trend-Based Logic Overview Classic SNR Breakout EA is a professional trading robot that identifies structural Support & Resistance levels using daily swing points and executes trades based on H1 price action relative to these levels. The EA applies   dual logic : in an uptrend, it sells on H1 rejection below an SNR level; in a downtrend, it buys on H1 rejection above an SNR level. Breakout confirmations are
Trade Manger
Israr Hussain Shah
Here   our more valuable tools SMC Trend Trading   ,  Easy SMC Trading  ,  Institutional SMC Architect Volume Analysis Tools  ,  Volume flow Profile  ,  Market volume profile  , FVG with Volume  , Liquidity Heatmap Profile  ,  Volume Spread Analysis You Give an Instruction: When you run the script, a window pops up with a dropdown menu. You choose exactly what you want it to do from the list (e.g., "Close Profit Only" or "Delete Pending Orders"). It Scans Your Positions: The script then reads
| Fully-automated Smart Money Concept (ICT) inspired trading solution with multi-strategy capabilities | Built by a grid trader >> for grid traders.  This is MT5 version, click  here  for  Blue CARA MT4  (settings and logics are same in both versions)     Real monitoring signal  -->  Cara Gold Intro Blue CARA EA   ('CARA') - short for  C omprehensive  A lgorithmic   R esponsive   A dvisor is a next-gen  multi-currency    multi-timeframe  EA base on the widely known (and perhaps the most popul
Order Book, known also as Market Book, market depth, Level 2, - is a dynamically updated table with current volumes of orders to buy and to sell specific financial instument at price levels near Bid and Ask. MetaTrader 5 provides the means for receiving market book from your broker, but in real time only, without access to its history. The indicator OrderBook Cumulative Indicator accumulates market book data online and visualizes them on the chart. In addition, the indicator can show the market
ALIEN Dashboard
Youssef Esseghaiar
ALIEN DASHBOARD FULL EDITION – Professional ICT & Precision Trading Dashboard for MT5 ( HYBRID ENGINE ) Overview The   Alien Dashboard Full Edition   is a comprehensive, all‑in‑one technical indicator for MetaTrader 5 that merges the most powerful concepts from Inner Circle Trader (ICT) methodology with advanced precision‑entry logic, multi‑timeframe analysis, and an intuitive on‑chart dashboard. Designed for serious traders who want to visualise institutional order flow, identify high‑probabili
Écrivez des notes directement sur le graphique et utilisez vos observations lors du trading L' option de synchronisation  des rappels  entre  les Symboles  vous permet de vous souvenir des informations importantes sur l' état  actuel  du marché Ainsi , cet outil vous aidera à éviter une situation où des informations importantes que vous avez remarquées plus tôt sont manquées lors du trading . Outil multifonctionnel : 66+ fonctionnalités, incluant cet outil  |   Contactez-moi  si vous avez des q
SmartRAL
Jemy Yeferson Dimu Ludji
SmartRAL (Smart Risk Auto-Lot EA) SmartRAL: The Ultimate Risk & Lot Management Expert Advisor (EA) SmartRAL is an essential tool for traders who demand precise risk management and automated position sizing in MetaTrader 5. Stop guessing your lot size and let the algorithm handle the calculations. This EA allows you to trade with confidence by guaranteeing your risk exposure on every single trade, while offering absolute flexibility in setting your Stop Loss (SL). Key Features & Benefits Guarante
SolarTrade Suite Financial Robot: LaunchPad Market Expert - conçu pour ouvrir des transactions ! Il s'agit d'un robot de trading qui utilise des algorithmes spéciaux innovants et avancés pour calculer ses valeurs, votre assistant dans le monde des marchés financiers. Utilisez notre ensemble d'indicateurs de la série SolarTrade Suite pour mieux choisir le moment de lancer ce robot. Découvrez nos autres produits de la série SolarTrade Suite en bas de la description. Vous souhaitez naviguer en
Headline ShikaaTraders Gold Grid Pro is a high-performance trade management utility designed specifically for XAUUSD (Gold) and high-volatility pairs. It allows traders to execute complex grid-layering strategies with a single click, ensuring you never miss an entry during fast market moves. Why Choose Gold Grid Pro? Manual trading on Gold requires speed. Manually calculating distances and opening multiple positions takes too much time. This utility automates the "Scaling-In" process, allowing y
Indicateur Crypto_Forex « WPR avec 2 Moyennes Mobiles » pour MT5, sans repeint. - Le WPR est l'un des meilleurs oscillateurs pour le scalping. - L'indicateur « WPR et 2 Moyennes Mobiles » permet de visualiser les moyennes mobiles rapide et lente de l'oscillateur WPR. - Cet indicateur permet d'anticiper les corrections de prix. - Très facile à configurer via ses paramètres, il est utilisable sur toutes les unités de temps. - Les conditions d'entrée à l'achat et à la vente sont illustrées. - Ave
"Impulses and Corrections 5" is created to help traders navigate the market situation. The indicator shows multi-time frame upward and downward "Impulses" of price movements. These impulses are the basis for determining the "Base" , which is composed of zones of corrections of price movements, as well as "Potential" zones for possible scenarios of price movement. Up and down impulses are determined based on a modified formula of Bill Williams' "Fractals" indicator. The last impulse is always "U
Les acheteurs de ce produit ont également acheté
Trade Assistant MT5
Evgeniy Kravchenko
4.42 (212)
It helps to calculate the risk per trade, the easy installation of a new order, order management with partial closing functions, trailing stop of 7 types and other useful functions. Additional materials and instructions Installation instructions - Application instructions - Trial version of the application for a demo account Line function -   shows on the chart the Opening line, Stop Loss, Take Profit. With this function it is easy to set a new order and see its additional characteristics bef
Bienvenue sur Trade Manager EA, l’outil ultime de gestion des risques conçu pour rendre le trading plus intuitif, précis et efficace. Ce n’est pas seulement un outil d’exécution d’ordres ; c’est une solution complète pour la planification des trades, la gestion des positions et le contrôle des risques. Que vous soyez débutant, trader expérimenté ou scalpeur ayant besoin d’une exécution rapide, Trade Manager EA s’adapte à vos besoins, offrant une flexibilité sur tous les marchés, des devises et i
Local Trade Copier EA MT5
Juvenille Emperor Limited
4.96 (139)
Découvrez une expérience exceptionnellement rapide de copie de trades avec le   Local Trade Copier EA MT5 . Avec sa configuration facile en 1 minute, ce copieur de trades vous permet de copier des trades entre plusieurs terminaux MetaTrader sur le même ordinateur Windows ou Windows VPS avec des vitesses de copie ultra-rapides de moins de 0.5 seconde. Que vous soyez un trader débutant ou professionnel, le   Local Trade Copier EA MT5   offre une large gamme d'options pour le personnaliser en fonc
Version Bêta Le Telegram to MT5 Signal Trader est presque prêt pour la sortie officielle en version alpha. Certaines fonctionnalités sont encore en développement et vous pourriez rencontrer de petits bugs. Si vous rencontrez des problèmes, merci de les signaler, vos retours aident à améliorer le logiciel pour tout le monde. Telegram to MT5 Signal Trader est un outil puissant qui copie automatiquement les signaux de trading depuis des chaînes ou groupes Telegram vers votre compte MetaTrader 5 .
AI Agent Supervisor is NOT an Expert Advisor. AI Agent Supervisor   is a   multi-agent AI risk & portfolio supervisor   that watches every EA on your account and intervenes in real time.  WANT AN AI PORTFOLIO MANAGER WATCHING YOUR FLEET 24/7?   Run your fleet on the same brokers I do:   IC MARKETS , IC TRADING   .  Unlike the centralized stock market, Forex has no single, unified price feed.  Every broker sources liquidity from different providers, creating unique data streams. The Supervisor r
TradePanel MT5
Alfiya Fazylova
4.87 (156)
Trade Panel est un assistant commercial multifonction. L'application contient plus de 50 fonctions de trading pour le trading manuel et permet d'automatiser la plupart des tâches commerciales. Avant l'achat, vous pouvez tester la version de démonstration sur un compte de démonstration. Télécharger la version d'essai de l'application pour un compte de démonstration : https://www.mql5.com/fr/blogs/post/762644 . Instructions complètes ici . Commerce. Permet d'effectuer des opérations commerciales e
Trade Dashboard MT5
Fatemeh Ameri
4.95 (129)
Trade Dashboard simplifies how you open, manage, and control your trades, with built-in lot size calculation. It allows you to execute trades, manage risk, and control positions directly on the chart, with tools such as partial close, breakeven, and trailing stop. Designed to reduce manual work and help you stay focused on your trading decisions. A demo version is available for testing. Detailed explanations of features are provided within the MQL5 platform. Installation instructions are include
Power Candles Strategy Scanner - Outil de recherche de configurations multi-symboles à optimisation automatique Le Power Candles Strategy Scanner utilise le même moteur d'auto-optimisation que celui qui alimente l'indicateur Power Candles, pour chaque symbole de votre Market Watch, en parallèle. Un panneau vous indique quels symboles sont statistiquement négociables à l'instant, quelle stratégie est la plus performante pour chacun, la paire Stop Loss / Take Profit optimale, et vous alerte dès qu
Exp COPYLOT CLIENT for MT5
Vladislav Andruschenko
3.91 (33)
Copieur professionnel de trades pour MetaTrader 5 Un copieur de trades rapide, professionnel et fiable pour MetaTrader . COPYLOT permet de copier des trades Forex entre les terminaux MT4 et MT5 avec prise en charge des comptes Hedge et Netting . La version MT5 de COPYLOT prend en charge : - MT5 Hedge → MT5 Hedge - MT5 Hedge → MT5 Netting - MT5 Netting → MT5 Hedge - MT5 Netting → MT5 Netting - MT4 → MT5 Hedge - MT4 → MT5 Netting Version MT4 Description complète + DEMO + PDF Comment acheter Comme
Premium Trade Manager - Gestion de trades rapide et disciplinée pour MetaTrader 5 Premium Trade Manager est fait pour les traders qui veulent garder leur attention sur la décision pendant que le panneau prend en charge la routine : dimensionnement, placement, partiels, trailing, actualités et limites de prop firm, traités de la même façon disciplinée à chaque trade. C'est un panneau rapide sur le graphique pour MetaTrader 5 qui supprime le travail mécanique de chaque trade. Vous décidez de la di
Quant AI Agents
Ho Tuan Thang
5 (1)
Quant AI Agents are independent trading Expert Advisors. Instead of trading using a fixed strategy like other conventional EAs, Quant AI Agents   is a   multi-agent AI trading framework   that turns natural-language strategy prompts into live.  WANT THE SAME RESULTS AS MY LIVE SIGNAL?   Use the exact same brokers I do:   IC MARKETS , IC TRADING   .  Unlike the centralized stock market, Forex has no single, unified price feed.  Every broker sources liquidity from different providers, creating un
Farmed Hedge Yield Farming | All Markets (Manual - Hybrid - Semi/Automated EA) MULTI-ASSET SUPPORT Trade any asset available on your broker - Forex: Major, Minor, Exotic pairs - Crypto: BTC, ETH, XRP, SOL, BNB - Stocks: Apple, Tesla, Amazon, Google, etc. - Commodities: Gold, Silver, Oil, Gas - Indices: US30, NAS100, SPX500, DAX40 - Any CFD your broker offers VERIFIED TRADING RESULTS - Farmed Hedge Yield Axi Copy:  https://www.mql5.com/en/signals/2356376 - Farmed Hedge Yield Exn Copy:   https:/
The product will copy all telegram signal to MT5 ( which you are member) , also it can work as remote copier.  Easy to set up, copy order instant, can work with almost signal formats, image signal,  s upport to translate other language to English Work with all type of channel or group, even channel have "Restrict Saving Content", work with  multi channel, multi MT5 Work as remote copier: with signal have ticket number, it will copy exactly via ticket number. Support to backtest signal. How to s
================================================================================ POC BREAKOUT - V20.72. Full Professional Grade Toolkit ================================================================================ POC Breakout is a full MetaTrader 5 trading dashboard for discretionary traders who want breakout signals, Point of Control (POC) context, volume profiles, order flow, market structure, news, alerts, and advanced trade planning in one professional workspace. Attached directly to you
Timeless Charts
Samuel Manoel De Souza
5 (6)
Timeless Charts est un utilitaire de trading tout-en-un destiné aux traders professionnels. Il combine des types de graphiques personnalisés tels que les graphiques en secondes et Renko avec une analyse avancée du flux d’ordre s utilisant Footprints , Clusters , Profils de Volume , études VWAP et outils d’analyse ancrés pour une compréhension plus approfondie du marché. Le trading et la gestion des positions sont effectués directement depuis le graphique via un panneau intégré de gestion des ord
Footprint Chart Pro — Professional OrderFlow EA for MetaTrader 5 Version 6.34 | Professional tool for real traders | Institutional-Grade Visualization DEMO USERS - PLEASE SELECT EVERY TICK / REAL TICK WHEN TESTING AND YOU HAVE DOWNLOADED HISTORICAL DATA. IF YOU SEE A WAITING SCREEN AND IT IS NOT DOWNLOADING, IT MEANS YOU HAVE LOW HISTORICAL DATA. TRY 1 MIN AND 5 MIN FIRST ON 1 DAY DATA. ONE DAY DATA SHOULD BE THE NEWEST AND MOST CURRENT DATE. PLEASE WAIT UNTIL THE MARKET HAS ROLLED OVER PERIOD.
AntiOverfit PRO MT5
Enrique Enguix
5 (6)
Avant d’acheter un EA, vérifiez s’il tient vraiment la route ou s’il a simplement eu de la chance en backtest. La plupart des robots se vendent avec un beau backtest. Une courbe qui monte. Un bon profit factor. Très peu de doutes. Et pourtant, beaucoup de ces EA s’effondrent dès que le marché cesse de se comporter comme dans cet historique précis. Pourquoi ? Parce qu’un backtest ne prouve qu’une seule chose : que cette stratégie a fonctionné sur un parcours de prix bien précis. Il ne prouve pas
Trade copier MT5
Alfiya Fazylova
4.56 (45)
Trade Copier est un utilitaire professionnel conçu pour copier et synchroniser les commandesentre les comptes de trading. Les commandes sont copiées du compte/terminal du fournisseur vers le compte/terminal du destinataire, qui sont installés sur le même ordinateur ou vps. PROMOTION - Si vous avez déjà acquis le "Trade copier MT5", vous pouvez obtenir le "Trade copier MT4" gratuitement (pour la copie MT4 > MT5 et MT4 < MT5). Pour obtenir des informations plus détaillées sur les conditions, veuil
The News Filter MT5
Leolouiski Gan
4.78 (23)
Ce produit filtre tous les conseillers experts et les graphiques manuels pendant les heures de publication des actualités, de sorte que vous n'avez pas à vous soucier des pics de prix soudains qui pourraient détruire vos configurations de trading manuelles ou les transactions entrées par d'autres conseillers experts. Ce produit est également livré avec un système de gestion des ordres complet qui peut gérer vos positions ouvertes et vos ordres en attente avant la publication de toute actualité.
Prop Firm Os
Gayathiri Gopalakrishnan
5 (1)
PROP FIRM OS Structured Trading Assistant for MetaTrader 5 PROP FIRM OS is a structured trading assistant designed for MetaTrader 5 users who prefer rule-based market analysis and organized trading workflows. The Expert Advisor combines market analysis tools, scanner functions, dashboard monitoring, alerts, risk-control settings, and trade management features inside one system. PROP FIRM OS is designed to help traders follow selected rules, filters, and monitoring conditions during trading activ
Copy Cat More Trade Copier MT5 (Chat Copieur MT5) est un copieur de trades local et un framework complet de gestion des risques et d'exécution conçu pour les défis commerciaux d'aujourd'hui. Des défis de prop firms à la gestion de portefeuille personnel, il s'adapte à chaque situation avec une combinaison d'exécution robuste, de protection du capital, de configuration flexible et de gestion avancée des trades. Le copieur fonctionne à la fois en mode Master (expéditeur) et Slave (récepteur), avec
Entry In The Zone with SMC Multi Timeframe is a real-time 2-in-1 market analysis tool that combines market structure analysis and a No Repaint BUY / SELL signal system into a single indicator, built on Smart Money Concepts (SMC) — a widely adopted framework used by professional traders to understand market structure. This indicator helps you see the market more clearly, make decisions based on structure rather than guesswork, and focus on high-probability zones where price is more likely to reac
Seconds Chart MT5
Boris Sedov
4.59 (17)
Seconds Chart - un outil unique pour créer des graphiques en secondes dans MetaTrader 5 . Grâce à Seconds Chart , vous pouvez créer un graphique avec une période définie en secondes, offrant une flexibilité et une précision idéales pour l'analyse, indisponibles sur les graphiques standards en minutes ou en heures. Par exemple, la période S15 indique un graphique avec des bougies d'une durée de 15 secondes. Vous pouvez utiliser n'importe quels indicateurs et experts advisors compatibles avec les
YuClusters
Yury Kulikov
4.93 (42)
Attention: You can view the program operation in the free version  YuClusters DEMO .  YuClusters is a professional market analysis system. The trader has unique opportunities to analyze the flow of orders, trade volumes, price movements using various charts, profiles, indicators, and graphical objects. YuClusters operates on data based on Time&Sales or ticks information, depending on what is available in the quotes of a financial instrument. YuClusters allows you to build graphs by combining da
Signal TradingView to MT5 Pro Automator Exécution professionnelle instantanée entre TradingView et MetaTrader 5 Automatisez votre stratégie de trading avec le pont de communication le plus robuste entre les alertes TradingView et l'exécution réelle sur MT5. Conçu pour les traders qui exigent vitesse, flexibilité et une gestion des risques impeccable, cet Expert Advisor transforme tout message d'alerte en un ordre au marché ou à cours limité précis. POINTS FORTS ET AVANTAGES Moteur d'analyse univ
HINN MagicEntry Extra
ALGOFLOW OÜ
4.73 (15)
HINN MAGIC ENTRY – the ultimate tool for entry and position management! Place orders by selecting a level directly on the chart! full description   ::  demo-version  :: 60-sec-video-description Key features: - Market, limit, and pending orders - Automatic lot size calculation - Automatic spread and commission accounting - Unlimited partitial take-profits  - Breakeven and trailing stop-loss and take-profit  functions - Invalidation leves - Intuitive, adaptive, and customizable interface - Works
SMC Trade Pilot MT5 Assistant de trading semi-automatique pour les traders Smart Money Concepts. Recevez les signaux directement sur Telegram avec capture du graphique, puis placez le trade en un seul appui. Gérez vos positions depuis votre téléphone, même loin de votre ordinateur. Le problème résolu Les setups Smart Money n'attendent pas. Les Order Blocks et les Liquidity Sweeps se forment pendant l'ouverture de Londres, de New York ou en plein milieu de la session asiatique, souvent quand vous
Trade Manager DaneTrades
Levi Dane Benjamin
4.28 (29)
Trade Manager pour vous aider à entrer et sortir rapidement des transactions tout en calculant automatiquement votre risque. Y compris des fonctionnalités pour vous aider à éviter le sur-trading, le trading de vengeance et le trading émotionnel. Les transactions peuvent être gérées automatiquement et les mesures de performances du compte peuvent être visualisées dans un graphique. Ces fonctionnalités rendent ce panneau idéal pour tous les traders manuels et contribuent à améliorer la plateforme
PZ Trade Pad Pro MT5
PZ TRADING SLU
1 (1)
Effortlessly calculate lot sizes and manage trades to save time and avoid costly errors The Trade Pad Pro EA is a tool for the Metatrader Platform that aims to help traders manage their trades more efficiently and effectively. It has a user-friendly visual interface that allows users to easily place and manage an unlimited number of trades, helping to avoid human errors and enhance their trading activity. [ Installation Guide | Update Guide | Troubleshooting | FAQ | All Products ] One of the k
Custom Alerts AIO : Surveillez tous les marchés à la fois — sans aucune configuration Présentation Custom Alerts AIO est une solution de surveillance du marché prête à l’emploi, sans configuration nécessaire. Tous les indicateurs requis — FX Power, FX Volume, FX Dynamic, FX Levels, IX Power — sont directement intégrés. Aucun graphique n’est affiché, ce qui rend cet outil idéal pour la génération d’alertes en temps réel. Il prend en charge toutes les classes d’actifs proposées par votre courtie
Plus de l'auteur
1. Why did I develop this series of indicators I found that most traders need to use multiple time frame indicators. They usually switch time frame to see indicators. However, once the timeframe is switched, you cannot see the  corresponding relationship  between  the price in the smaller timeframe  and  the indicator in the larger timeframe . For example: if your price chart is in H1 timeframe, you can see H4, D1 and W1 indicators in H1 timeframe Chart. This is more helpful for you to find th
This product can be used to synchronize multiple Charts, and each Chart can be set to a different sync mode. With this product you can better view and manipulate charts: different time frames for a single Symbol, the same time frame for multiple Symbols... and more. PS: The link below is the FreeDemo product, you can use it on EURUSD/XUAUSD/USDCNH symbol: https://www.mql5.com/en/market/product/38557 Feature: Chart settings  can be synchronized, including : background, indentation, size, etc. M
Do you think it's a bit cumbersome when you need to switch symbols or timeframes with mouse click? 1. What is this? This is a program that can switch symbols and timeframes with direction keys. Fast switching, very convenient, no mouse click required. For traders, one symbol with multi-timeframe charts are usually added,  you can change symbol on those charts easily. For multi-currency traders, different symbol charts are usually added, you can also change those timeframes easily. I wrote this p
1. What is this         Rising volatility and falling volatility are not the same, whether it is academic research or actual testing has shown this point.         The original ATR indicator is calculated by putting up and down fluctuations together. This indicator is to calculate separately the upward volatility and the downward volatility, which can better help you study the market. 2. Indicator description          There are two modes for the calculation of this indicator, as shown in the fo
Have you ever take a long time to watch a Symbol when the network link is not good ? Have you ever wait for a long time when you switch chart between different Symbols or different TimeFrames ? If you do long-term backtesting , Have you ever to be downloaded datas for a long time ? Yes, If there is no data in the system, those will happen.  1. What is this: Download all the Symbol data in Market Watch to the system. PS: This is not outputting data to Files. This Link go to Demo version: https:/
This product can be used to synchronize multiple Charts, and each Chart can be set to a different sync mode. With this product you can better view and manipulate charts: different time frames for a single Symbol, the same time frame for multiple Symbols, system indicators for single/multiple Symbols... and more. Feature: Chart settings can be synchronized, including : background, indentation, size, etc. Multiple Chart window start times  or end times can be synchronized. Multiple Chart time fr
I see that many tools in the market deal with Position and Order in the form of operation panels. Which is loaded into a Chart in the form of an EA. However, once the operator panel EA is loaded, no other EAs can be loaded. So, I wrote the one-click operation of Position and Order as a script, so you can load other EAs and easily complete one-click operation of Trade. 1. What is this: This is a one-click script to close position order. Now you can close position tickets at high speed, for examp
I see that many tools in the market deal with Position and Order in the form of operation panels. Which is loaded into a Chart in the form of an EA. However, once the operator panel EA is loaded, no other EAs can be loaded. So, I wrote the one-click operation of Position and Order as a script, so you can load other EAs and easily complete one-click operation of Trade. 1. What is this: This is a one-click script to delete the pending order . Now you can delete pending tickets at high speed, for
Do you think it's a bit cumbersome when you need to switch symbols or timeframes with mouse click? 1. What is this? This is a program that can switch symbols and timeframes with direction keys. Fast switching, very convenient, no mouse click required. For traders, one symbol with multi-timeframe charts are usually added,  you can change symbol on those charts  easily . For multi-currency traders, different symbol charts are usually added, you can also change those timeframes easily. I wrote thi
According to trading experience: Some symbols are easy to reverse on certain days, such as Monday, or afternoon, and so on. So comparing the current price with the corresponding historical moment price is valuable. If the price coordinate system uses a logarithmic price, you will get a lot of valuable information. 1. What is this? This program can convert the symbol price and add it to your Chart. You can compare it with your major chart. The DEMO version Link: https://www.mql5.com/en/market/pr
What is this: Violent trading: means sending a large number of orders to your brokerage server,  it can conduct a stress test of the trading. In this program you can run a variety of trading tests.  Now you can trade at high speed, For example 1000 orders in an instant. The Demo version's link:  https://www.mql5.com/en/market/product/38431/ Why to use: Whether manual trading or EA trading,  the status of the broker server is very important. So it is beneficial to conduct a trading stress test on
1. Why did I develop this series of indicators I found that most traders need to use multiple time frame indicators. They usually switch time frame to see indicators. However, once the timeframe is switched, you cannot see the  corresponding relationship  between  the price in the smaller timeframe  and  the indicator in the larger timeframe . For example: if your price chart is in H1 timeframe, you can see H4, D1 and W1 indicators in H1 timeframe Chart. This is more helpful for you to find th
Filtrer:
Аврора
96
Аврора 2023.04.21 05:11 
 

L'utilisateur n'a laissé aucun commentaire sur la note

Répondre à l'avis