Symbol

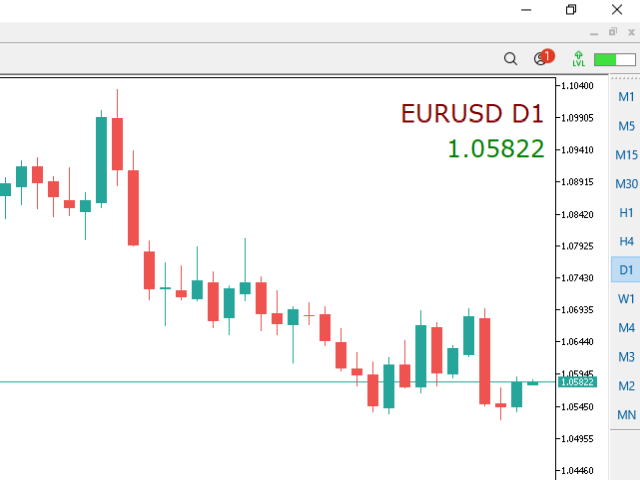
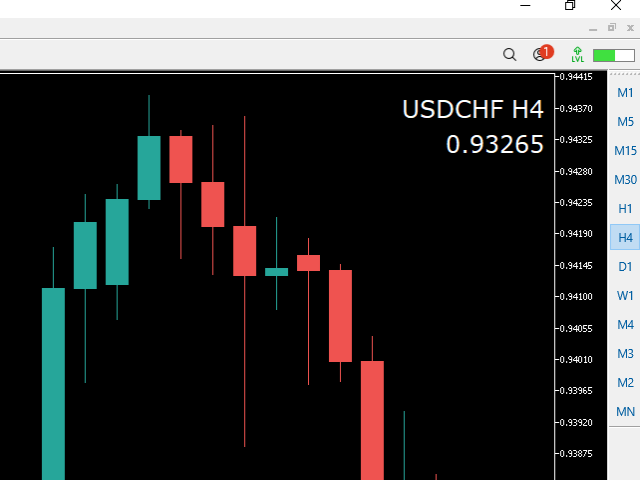
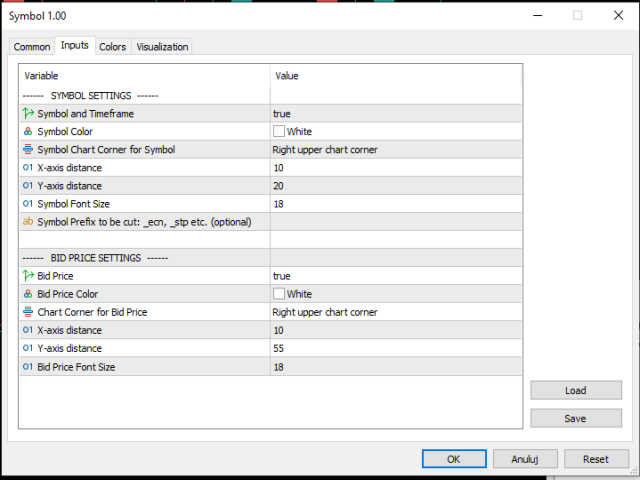
For those who monitor charts from afar, this utility is essential. It displays the chart symbol, time frame, and bid price as text. Users can adjust the text position, color, and font size. It’s also a useful tool for forex video publishers. There will be no more complaints about which symbol and time frame are displayed on the screen, even if the content is viewed on a phone. Symbol prefixes such as “_ecn” or “_stp” can be removed from the displayed symbol.
추천 제품
Zigzag Price Arrows
Aiman Saeed Salem Dahbag
The Zigzag Price Arrow indicator is an enhanced version of the classic Zigzag indicator, combining the traditional zigzag pattern with advanced visual features. It not only identifies major market turning points but also provides clear trading signals through: • Directional arrows: Displays colored arrows (green for buy, magenta for sell) indicating potential trend directions. • Price labels: Shows the exact price values at each pivot point directly on the chart. • Improved visual clarity: Make
FREE
Donchian Breakout And Rsi
Mattia Impicciatore
5 (1)
개요 이 지표는 클래식 돈치안 채널(Donchian Channel) 의 향상된 버전으로, 실전 트레이딩을 위한 다양한 기능이 추가되었습니다. 표준 세 개의 선(상단, 하단, 중앙선) 외에도 브레이크아웃 을 감지하여 차트에 화살표로 시각적으로 표시하며, 차트를 깔끔하게 보기 위해 현재 추세 방향의 반대 라인만 표시 합니다. 지표 기능: 시각적 신호 : 브레이크아웃 시 컬러 화살표 표시 자동 알림 : 팝업, 푸시 알림, 이메일 RSI 필터 : 시장의 상대 강도를 기반으로 신호 검증 사용자 맞춤 설정 : 색상, 선 두께, 화살표 코드, RSI 임계값 등 동작 원리 돈치안 채널은 다음을 계산합니다: 상단선 : 최근 N개의 종가 완료 캔들에서 가장 높은 고가 하단선 : 최근 N개의 종가 완료 캔들에서 가장 낮은 저가 중앙선 : 고가와 저가의 평균값 상방 브레이크아웃 은 종가가 상단선을 돌파할 때 발생하며, 하방 브레이크아웃 은 종가가 하단선 아래로 내려갈 때 발생합니다. 이 지표는: 세 개의
FREE
Order Book, known also as Market Book, market depth, Level 2, - is a dynamically updated table with current volumes of orders to buy and to sell specific financial instument at price levels near Bid and Ask. MetaTrader 5 provides the means for receiving market book from your broker, but in real time only, without access to its history. This expert adviser OrderBook History Playback allows you to playback the market book events on the history using files, created by OrderBook Recorder . The exper
FREE
Weis Waves
Flavio Javier Jarabeck
2.83 (18)
The original author is David Weis, an expert in the Wyckoff Method. The Weis Wave is a modern adaptation of the 1930's Wyckoff Method, another expert in Tape Reading techniques and Chart Analysis. Weis Waves takes market volume and stacks it into waves according to price conditions giving the trader valuable insights about the market conditions. If you want to learn more about this subject you can find tons of videos in YouTube. Just look for "The Wickoff Method", "Weis Wave" and "Volume Spread
FREE
MACD Enhanced
Nikita Berdnikov
5 (3)
Introducing the MACD  Enhanced – an advanced MACD (Moving Average Convergence Divergence) indicator that provides traders with extended capabilities for trend and momentum analysis in financial markets. The indicator uses the difference between the fast and slow exponential moving averages to determine momentum, direction, and strength of the trend, creating clear visual signals for potential entry and exit points. Attention! To achieve the best results, it is recommended to adapt the indicator
FREE
Order Book, known also as Market Book, market depth, Level 2, - is a dynamically updated table with current volumes of orders to buy and to sell specific financial instument at price levels near Bid and Ask. MetaTrader 5 provides the means for receiving market book from your broker in real time. The expert OrderBook Recorder records market book changes and stores them in local files for further usage in indicators and expert adviser, including testing in the tester. The expert stores market book
FREE
Trendline mt5 indicator
David Muriithi
3 (1)
Are you tired of drawing trendlines every time you're analyzing charts? Or perhaps you would like more consistency in your technical analysis. Then this is for you. This indicator will draw trend lines automatically when dropped on a chart. How it works Works similar to standard deviation channel found on mt4 and mt5. It has 2 parameters: 1. Starting Bar 2. Number of bars for calculation The   starting bar   is the bar which drawing of the trend lines will begin, while the   number of bars for c
FREE
Important Lines
Terence Gronowski
4.88 (24)
This indicator displays Pivot-Lines, preday high and low, preday close and the minimum and maximum of the previous hour. You just have to put this single indicator to the chart to have all these important lines, no need to setup many single indicators. Why certain lines are important Preday high and low : These are watched by traders who trade in a daily chart. Very often, if price climbs over or falls under a preday low/high there is an acceleration in buying/selling. It is a breakout out of a
FREE
Introduction Welcome to the world of Forex trading, where every tick of the market can be influenced by news events. Introducing our expert advisor for MetaTrader, your ultimate tool for navigating the complexities of news trading. This innovative advisor is specifically designed to automate your trading strategy during key macroeconomic releases, ensuring you never miss an opportunity.  When important indicators are announced, volatility often spikes, creating potential for profit. Our expert
FREE
The utility draws pivot levels based on a selection from day week month The previous candlestick of the selected timeframe is taken and the values for the levels are calculated using the following formulas: Pivot = (high + close + low) / 3 R1 = ( 2 * Pivot) - low S1 = ( 2 * Pivot) - high R2 = Pivot + (R1 -S1) R3 = high + ( 2 * (Pivot - low)) S2 = Pivot - (R1 - S1) S3 = low - ( 2 * (high - Pivot)); The style and thickness for all lines are adjusted. The colors for the R, Pivot and S lines ar
FREE
PZ Penta O MT5
PZ TRADING SLU
3.5 (4)
The Penta-O is a 6-point retracement harmonacci pattern which usually precedes big market movements. Penta-O patterns can expand and repaint quite a bit. To make things easier this indicator implements a twist: it waits for a donchian breakout in the right direction before signaling the trade. The end result is an otherwise repainting indicator with a very reliable trading signal. The donchian breakout period is entered as an input. [ Installation Guide | Update Guide | Troubleshooting | FAQ | A
FREE
Follow The Line MT5
Oliver Gideon Amofa Appiah
4.6 (35)
This indicator obeys the popular maxim that: "THE TREND IS YOUR FRIEND" It paints a GREEN line for BUY and also paints a RED line for SELL. (you can change the colors). It gives alarms and alerts of all kinds. IT DOES NOT REPAINT and can be used for all currency pairs and timeframes. Yes, as easy and simple as that. Even a newbie can use it to make great and reliable trades. NB: For best results, get my other premium indicators for more powerful and reliable signals. Get them here: https://www.m
FREE
Magic 7 Indicator
Marek Pawel Szczesny
5 (1)
Overview Magic 7 Indicator is a comprehensive MetaTrader 5 (MQL5) indicator that identifies seven different trading scenarios based on candlestick patterns and technical analysis. The indicator combines traditional price action patterns with modern concepts like Fair Value Gaps (FVG) to provide trading signals with precise entry points and stop loss levels. Features 7 Trading Scenarios : Each scenario identifies specific market conditions and trading opportunities Visual Signals : Clear buy/sell
FREE
Stat Monitor 5
Sergei Linskii
5 (1)
Stat Monitor is a good information indicator. Benefits of the indicator: The indicator provides useful information - the current spread, the cost of one lot of the symbol, trading leverage and the recommended lot size for trading. You can use the indicator on the MetaTrader 5 trading platform of any broker. The indicator provides useful information. Version of the Stat Monitor indicator for MetaTrader 4 I wish you all good luck in trading and stable profit!
FREE
Waves Sizer
Flavio Javier Jarabeck
3.86 (7)
Wyckoff fans, enjoy! Ideally to be used with the Weis Waves indicator, but it can be easily used alone, the Waves Sizer puts the range (in resulting Price movement) done by the Price on its market swings. You can control how accurate or loose will be the swings. This tool is very helpful for visually know how much the Price has traveled in your Timeframe. This way you can confront this level of effort with the resulting Volume, etc... Weis Waves indicator: https://www.mql5.com/en/market/produc
FREE
Value Chart Candlesticks
Flavio Javier Jarabeck
4.69 (13)
The idea of a Value Chart indicator was presented in the very good book I read back in 2020 , " Dynamic Trading Indicators: Winning with Value Charts and Price Action Profile ", from the authors Mark Helweg and David Stendahl. The idea is simple and the result is pure genius: Present candlestick Price analysis in a detrended way! HOW TO READ THIS INDICATOR Look for Overbought and Oversold levels. Of course, you will need to test the settings a lot to find the "correct" one for your approach. It
FREE
Tenet Support and Resistance Pro
Lucas De Melo Carvalho Cruz
Ideal for scalpers, day traders and swing trades. Automatically identifies key support and resistance levels based on historical price data. It displays real-time trading zones and a precise countdown timer for each candle, helping traders make faster and more confident decisions. Fully customizable for multiple timeframes and instruments. The indicator analyzes historical price data to draw horizontal levels that represent key trading areas. It also displays, in real time, the current zone whe
FREE
LT Agression Indicator
Thiago Duarte
5 (3)
This is a buyer and seller aggression indicator that analyzes the shape of each candle and project this data in a histogram form. There are 4 histograms in one. On the front we have two: Upper - Buyer force. Lower - Seller force. At the background we also have two histogram, both with same color. They measure the combined strenght of buyers and sellers. This histograms can be turned off in Input Parameters. It is also possible to have the real or tick volume to help on this force measurement. IN
FREE
This indicator creates a Renko-based custom symbol in MetaTrader 5. Renko charts are built using price movement only, not time, making them useful for analyzing trends and filtering noise. Features Customizable brick size in points. Option to calculate brick size using ATR (adaptive). Ability to show or hide wicks. Creates and updates a custom Renko chart symbol. Automatically opens the chart window (optional). Maintains a limited bar history for performance. Inputs BrickSizePoints – brick size
FREE
This indicator show the candle remaining time on the chart and/or in the corner of the window. It also display notificaton (popup and push) when a new candle is formed (optional). You configure the timer on candles and at chart corner. I don't need to explain the functions because are very simple. MT4 version:  https://www.mql5.com/en/market/product/38677 Any doubt or suggestion please contact us. Enjoy! This is a free indicator, but it took hours to develop. If you want to pay me a coffee, I a
FREE
Haven Key Levels PDH PDL
Maksim Tarutin
5 (8)
"Haven Key Levels PDH PDL"   인디케이터는 트레이더가 차트에서 핵심 레벨을 시각화하는 데 도움을 줍니다. 다음 레벨을 자동으로 표시합니다: DO (Daily Open)   — 일일 시가. NYM (New York Midnight)   — 뉴욕 자정 레벨. PDH (Previous Day High)   — 전일 고가. PDL (Previous Day Low)   — 전일 저가. WO (Weekly Open)   — 주간 시가. MO (Monthly Open)   — 월간 시가. PWH (Previous Week High)   — 전주 고가. PWL (Previous Week Low)   — 전주 저가. CMH (Current Month High)   — 당월 고가. CML (Current Month Low)   — 당월 저가. PMH (Previous Month High)   — 전월 고가. PML (Previous Month Low)   — 전월 저가. 다른
FREE
Indicator and Expert Adviser  EA Available in the comments section of this product. Download with Indicator must have indicator installed for EA to work. Mt5 indicator alerts for bollinger band and envelope extremes occurring at the same time. Buy signal alerts occur when A bullish candle has formed below both the lower bollinger band and the lower envelope  Bar must open and close below both these indicators. Sell signal occur when A bear bar is formed above the upper bollinger band and upper
FREE
Daily Support and Resistance Levels 는 클래식 피벗 포인트 방식으로 일중 거래 핵심 가격 레벨을 자동 계산/표시하는 전문 지표입니다. 주요 기능: 피벗 포인트(PP) 자동 계산 3개의 저항 레벨(R1, R2, R3) 3개의 지지 레벨(S1, S2, S3) 전일 고가/저가 표시 실시간 정보 패널 상승/하락 바이어스 표시 최근 레벨까지 거리 표시 색상/표시 완전 사용자 설정 매일 자동 업데이트 모든 타임프레임 지원 계산 방식: 전일 고가/저가/종가 기반 클래식 피벗 포인트. 트레이딩 활용: 지지/저항 반등 매매 돌파 전략 레인지 거래 방향성 판단 목표가 설정 사용 방법: 차트에 인디케이터 적용 레벨 자동 생성 가격 > PP = 상승 바이어스 가격 < PP = 하락 바이어스 S1-S3 = 지지 구간 R1-R3 = 저항 구간 설정 옵션: 피벗/지지/저항 색상 라인 굵기/스타일 가격 라벨 표시/숨기기 정보 패널 ON/OFF 패널 위치/폰트 크기 전일 고가/저가 표
FREE
Renko Box
Andrey Dik
5 (1)
Description. The basis for the formation of the Renko chart is the price range. If the price goes beyond its limits, the chart shows a box above or below the previous one. As a result, we see price movement without additional "noise" and important support and resistance levels. Features. For use in conjunction with the Expert Advisor, an additional buffer is implemented-a box counter. For convenience and to increase the speed of testing, the user can use the "new box" event, which the indicator
FREE
Haven FVG Indicator
Maksim Tarutin
5 (7)
인디케이터   Haven FVG   는 시장을 분석하는 도구로, 차트에서 비효율성 영역(Fair Value Gaps, FVG)을 식별하여 트레이더에게 가격 분석 및 거래 결정을 위한 주요 수준을 제공합니다. 다른 제품 ->  여기 주요 특징: 개별 색상 설정: 상승 FVG 색상   (Bullish FVG Color). 하락 FVG 색상   (Bearish FVG Color). 유연한 FVG 시각화: FVG를 검색할 최대 캔들 수. FVG 영역을 특정 바 수만큼 추가로 연장. FVG에 대한 채우기를 활성화할 수 있습니다. 중앙선(Middle Line): 색상 및 선 스타일 선택(예: 점선). 더 정확한 선 두께 조정. 일반 설정: FVG를 현재 바까지 확장. 채우기가 있는 역사적 FVG 제외하여 최신 데이터에 집중. 차트에서 비효율성 영역을 분석하고 근거 있는 거래 결정을 내리는 간단하고 효과적인 방법.
FREE
Account Info EA It is a tool that presents on the graph all the positions of the account, and specific information concerning the positions, but also the account. It enables the user to have an image of his account at a glance. Use like any expert advisor. You can't attach it in the same chart with other expert advisor. It does not have the ability to open or manage positions. You can attach it on any chart and any timeframe.
FREE
Show Pips for MT5
Roman Podpora
4.52 (27)
이 정보 표시기는 계정의 현재 상황을 항상 알고 싶어하는 사람들에게 유용합니다. VERSION MT 4 -   More useful indicators 표시기는 포인트, 백분율, 통화 단위의 이익뿐만 아니라 현재 쌍의 스프레드와 현재 기간에서 막대가 마감될 때까지의 시간과 같은 데이터를 표시합니다. 차트에 정보선을 배치하는 데는 여러 가지 옵션이 있습니다. 가격 오른쪽(가격보다 뒤에 있음) 코멘트(차트의 왼쪽 상단) 화면의 선택된 모서리에 있습니다. 정보 구분 기호를 선택할 수도 있습니다. | / \ # 이 표시기는 사용하기 쉽고 매우 유익합니다. 설정에서 불필요한 정보 항목을 비활성화할 수 있습니다. 설정 외모의 종류       - 정보 라인 표시 유형. 세 가지 옵션이 있습니다: 가격을 따르세요       - 가격을 따르세요. 댓글로       - 코멘트로; 화면의 선택된 모서리에서       - 화면의 선택한 모서리에 있습니다. 첨부용 그래프 코너       - 화면의 선택한
FREE
Reversal Composite Candles
MetaQuotes Ltd.
3.67 (15)
The idea of the system is to indentify the reversal patterns using the calculation of the composite candle. The reversal patterns is similar to the "Hammer" and "Hanging Man" patterns in Japanese candlestick analysis. But it uses the composite candle instead the single candle and doesn't need the small body of the composite candle to confirm the reversal. Input parameters: Range - maximal number of bars, used in the calculation of the composite candle. Minimum - minimal size of the composite can
FREE
Free automatic Fibonacci is an indicator that automatically plots a Fibonacci retracement based on the number of bars you select on the BarsToScan setting in the indicator. The Fibonacci is automatically updated in real time as new highest and lowest values appears amongst the selected bars. You can select which level values to be displayed in the indicator settings. You can also select the color of the levels thus enabling the trader to be able to attach the indicator several times with differe
FREE
Statistical Arbitrage Spread Generator for Cointegration [MT5] What is Pair Trading? Pair trading is a market-neutral strategy that looks to exploit the relative price movement between two correlated assets — instead of betting on the direction of the market. The idea? When two assets that usually move together diverge beyond a statistically significant threshold, one is likely mispriced. You sell the expensive one, buy the cheap one , and profit when they converge again. It’s a statistica
FREE
이 제품의 구매자들이 또한 구매함
Trade Assistant MT5
Evgeniy Kravchenko
4.42 (208)
거래당 위험 계산, 라인을 사용한 손쉬운 신규 주문, 부분 청산 기능을 통한 주문 관리, 7가지 유형의 트레일링 스탑 및 기타 유용한 기능을 제공합니다. 추가 자료 및 지침 설치 지침   -   애플리케이션 지침   -   데모 계정용 애플리케이션 평가판 라인 기능       - 차트에 개시선, 손절매, 차익실현을 표시합니다. 이 기능을 사용하면 새로운 주문을 쉽게 하고 개봉 전에 추가 특성을 볼 수 있습니다. 위기 관리       -       위험 계산 기능은 설정된 위험과 손절매 주문의 크기를 고려하여 새 주문의 볼륨을 계산합니다. 이를 통해 손절매 크기를 설정하고 동시에 설정된 위험을 존중할 수 있습니다. 로트 계산 버튼 - 위험 계산을 활성화/비활성화합니다. 필요한 위험 값은 위험 필드에 0에서 100 사이의 백분율 또는 예금 통화로 설정됩니다. 설정 탭에서 위험 계산 옵션을 선택합니다. $ 통화, % 잔액, % 지분, % 자유 마진, % 사용자 정의, % AB 이전
Trade Manager EA에 오신 것을 환영합니다. 이 도구는 거래를 보다 직관적이고 정확하며 효율적으로 만들기 위해 설계된 궁극적인 리스크 관리 도구 입니다. 단순한 주문 실행 도구가 아닌, 원활한 거래 계획, 포지션 관리 및 리스크 제어를 위한 종합 솔루션입니다. 초보자부터 고급 트레이더, 빠른 실행이 필요한 스캘퍼에 이르기까지 Trade Manager EA는 외환, 지수, 상품, 암호화폐 등 다양한 시장에서 유연성을 제공합니다. Trade Manager EA를 사용하면 복잡한 계산은 이제 과거의 일이 됩니다. 시장을 분석하고 진입, 손절 및 익절 수준을 차트의 수평선으로 표시한 후 리스크를 설정하면, Trade Manager가 이상적인 포지션 크기를 즉시 계산하고 SL 및 TP 값을 실시간으로 표시합니다. 모든 거래가 간편하게 관리됩니다. 주요 기능: 포지션 크기 계산기 : 정의된 리스크에 따라 거래 크기를 즉시 결정합니다. 간단한 거래 계획 : 진입, 손절, 익절을 위한
Local Trade Copier EA MT5
Juvenille Emperor Limited
4.96 (129)
Local Trade Copier EA MT5 를 사용하여 매우 빠른 거래 복사 경험을 해보세요. 1분 안에 간편하게 설정할 수 있으며, 이 거래 복사기를 사용하면 Windows 컴퓨터 또는 Windows VPS에서 여러 개의 MetaTrader 터미널 간에 거래를 0.5초 미만의 초고속 복사 속도로 복사할 수 있습니다. 초보자든 전문가든   Local Trade Copier EA MT5 는 다양한 옵션을 제공하여 사용자의 특정 요구에 맞게 맞춤 설정할 수 있습니다. 이는 수익 잠재력을 높이려는 모든 사람을 위한 최고의 솔루션입니다. 지금 사용해보시고 이것이 왜 시장에서 가장 빠르고 쉬운 무역용 복사기인지 알아보세요! 팁: 여기 에서 데모 계정에서 Local Trade Copier EA MT5 데모 버전을 다운로드하여 사용해 볼 수 있습니다. 다운로드한 무료 데모 파일을 MT5 >> File >> Open Data Folder >> MQL5 >> Experts 폴더에 붙여넣고 터
TradePanel MT5
Alfiya Fazylova
4.86 (148)
Trade Panel은 다기능 거래 보조원입니다. 이 애플리케이션에는 수동 거래를 위한 50개 이상의 거래 기능이 포함되어 있으며 대부분의 거래 작업을 자동화할 수 있습니다. 전략 테스터에서는 애플리케이션이 작동하지 않습니다. 구매하기 전에 데모 계정에서 데모 버전을 테스트할 수 있습니다. 데모 버전 여기 . 전체 지침 여기 . 거래. 한 번의 클릭으로 거래 작업을 수행할 수 있습니다: 자동 위험 계산을 통해 지정가 주문 및 포지션을 엽니다. 한 번의 클릭으로 여러 주문과 포지션을 열 수 있습니다. 주문 그리드를 엽니다. 그룹별 대기 주문 및 포지션을 마감합니다. 포지션 반전(매수 청산 후 매도 개시 또는 매도 청산 후 매수 개시). 포지션 고정(매수 포지션과 매도 포지션의 양을 동일하게 하는 추가 포지션 개설). 한 번의 클릭으로 모든 포지션을 부분 청산합니다. 모든 포지션의 이익실현과 손절매를 동일한 가격 수준으로 설정합니다. 모든 포지션에 대한 손절매를 해당 포지션의 손익 분기
베타 출시 Telegram to MT5 Signal Trader 는 곧 공식 알파 버전을 출시할 예정입니다. 일부 기능은 아직 개발 중이며, 작은 버그가 발생할 수 있습니다. 문제가 있으면 꼭 보고해 주세요. 여러분의 피드백은 소프트웨어 개선에 도움이 됩니다. Telegram to MT5 Signal Trader 는 Telegram 채널 또는 그룹의 거래 신호를 자동으로 MetaTrader 5 계정으로 복사하는 강력한 도구입니다. 공개 및 비공개 채널을 모두 지원하며, 여러 신호 제공자를 여러 MT5 계정에 연결할 수 있습니다. 소프트웨어는 빠르고 안정적으로 동작하며, 복사된 거래를 완벽히 제어할 수 있습니다. 인터페이스는 깔끔하며 대시보드와 차트가 시각적으로 구성되어 있고, 직관적인 네비게이션이 가능합니다. 여러 Signal Account를 관리하고, 공급자별 설정을 세밀하게 조정하며, 모든 동작을 실시간으로 모니터링할 수 있습니다. 필수 조건 MQL의 제한으로 인해 EA는 Te
Trade Dashboard MT5
Fatemeh Ameri
4.97 (117)
Tired of complex order placement and manual calculations? Trade Dashboard is your solution. With its user-friendly interface, placing orders becomes effortless, by a single click, you can open trades, set stop loss and take profit levels, manage trade lot size, and calculate risk to reward ratios, allowing you to only focus on your strategy. Say goodbye to manual calculations and streamline your trading experience with Trade Dashboard. Download  Demo Version  right now. You can find  Details of
Farmed Hedge Yield Farming - Professional Pair Trading Dashboard (Manual - Hybrid - Semi/Automated EA) VERSION 3 - WILD HARVEST UPDATE Trading Approach: - Manual Trading: Primary focus - Auto Pilot: Optional supplementary feature - Full Automation: Not the main purpose Recommended Timeframe: H1-H4 DEMO VERSION Download the free demo to test functionality. Use Strategy Tester with Visual Mode to see how it works. VERSION 3 - NEW FEATURES Summary Dashboard (SRA Panel) - Quick pair selection w
Copy Cat More Trade Copier MT5 (복사 고양이 MT5) 는 오늘날의 거래 과제를 위해 설계된 로컬 거래 복사기이자 완전한 위험 관리 및 실행 프레임워크입니다. 프롭펌 챌린지부터 개인 포트폴리오 관리까지, 견고한 실행, 자본 보호, 유연한 구성 및 고급 거래 처리의 조합으로 모든 상황에 적응합니다. 복사기는 마스터(송신자)와 슬레이브(수신자) 모드 모두에서 작동하며, 시장 주문과 예약 주문, 거래 수정, 부분 청산 및 헷지 청산 작업의 실시간 동기화를 제공합니다. 데모 및 실계좌, 거래 또는 투자자 로그인과 호환되며, EA, 터미널 또는 VPS가 재시작되어도 지속적인 거래 메모리 시스템을 통해 복구를 보장합니다. 고유 ID로 여러 마스터와 슬레이브를 동시에 관리할 수 있으며, 브로커 간 차이는 접두사/접미사 조정 또는 사용자 정의 심볼 매핑을 통해 자동으로 처리됩니다. 매뉴얼/설정  | Copy Cat More MT4 | 채널  특별 기능: 설정이 간편함 —
Exp COPYLOT CLIENT for MT5
Vladislav Andruschenko
3.82 (34)
MT5용 트레이드 복사기는 metaТrader 5 플랫폼용 트레이드 복사기입니다   . 그것은 사이의   외환 거래를 복사합니다       모든 계정   COPYLOT MT5 버전의 경우   MT5   -   MT5, MT4   -   MT5 (또는 COPYLOT MT4 버전의 경우   MT4 -   MT4 MT5   -  MT4) 믿을 수 있는 복사기! MT4 버전 전체 설명   +DEMO +PDF 구입 방법 설치하는 방법     로그 파일을 얻는 방법     테스트 및 최적화 방법     Expforex의 모든 제품 МТ4 터미널에서 거래를 복사할 수도 있습니다(   МТ4   -   МТ4, МТ5   -   МТ4   ):   COPYLOT CLIENT for MT4 이 버전은 МТ5   -   МТ5, МТ4   -   МТ5   터미널 간을 포함합니다. 거래 복사기는 2/3/10 터미널 사이의 거래/포지션을 복사하기 위해 만들어졌습니다. 데모 계정 및 투자 계정에서
HINN MagicEntry Extra
ALGOFLOW OÜ
4.69 (13)
HINN MAGIC ENTRY – the ultimate tool for entry and position management! Place orders by selecting a level directly on the chart! full description   ::  demo-version  :: 60-sec-video-description Key features: - Market, limit, and pending orders - Automatic lot size calculation - Automatic spread and commission accounting - Unlimited partitial take-profits  - Breakeven and trailing stop-loss and take-profit  functions - Invalidation leves - Intuitive, adaptive, and customizable interface - Works
Ultimate Extractor
Clifton Creath
5 (9)
Ultimate Extractor - Professional Trading Analytics for MT5 *****this is the local HTML version of Ultimate Extractor. Check out Ultimate Extractor Cloud on mql5 for the Cloud version****** Ultimate Extractor transforms your MetaTrader 5 trading history into actionable insights with comprehensive analytics, interactive charts, and real-time performance tracking. What It Does Automatically analyzes your MT5 trading history across all Expert Advisors and generates detailed HTML reports with inte
Trade Manager DaneTrades
Levi Dane Benjamin
4.36 (28)
거래 관리자는 위험을 자동으로 계산하는 동시에 거래를 빠르게 시작하고 종료하는 데 도움을 줍니다. 과잉 거래, 복수 거래 및 감정 거래를 방지하는 데 도움이 되는 기능이 포함되어 있습니다. 거래를 자동으로 관리할 수 있으며 계정 성과 지표를 그래프로 시각화할 수 있습니다. 이러한 기능은 이 패널을 모든 수동 거래자에게 이상적으로 만들고 MetaTrader 5 플랫폼을 향상시키는 데 도움이 됩니다. 다중 언어 지원. MT4 버전  |  사용자 가이드 + 데모 트레이드 매니저는 전략 테스터에서 작동하지 않습니다. 데모를 보려면 사용자 가이드로 이동하세요. 위기 관리 % 또는 $를 기준으로 위험 자동 조정 고정 로트 크기 또는 거래량과 핍을 기반으로 한 자동 로트 크기 계산을 사용하는 옵션 RR, Pips 또는 Price를 사용한 손익분기점 손실 설정 추적 중지 손실 설정 목표 달성 시 모든 거래를 자동으로 마감하는 최대 일일 손실률(%)입니다. 과도한 손실로부터 계정을 보호하고 과도한
MT5 to Telegram Signal Provider 는 사용하기 쉽고 완전히 커스터마이즈 가능한 유틸리티로, 특정 신호를 Telegram의 채팅, 채널 또는 그룹으로 전송하고, 귀하의 계정을 신호 제공자 로 만듭니다. 경쟁 제품과 달리 DLL 임포트를 사용하지 않습니다. [ 데모 ] [ 매뉴얼 ] [ MT4 버전 ] [ 디스코드 버전 ] [ 텔레그램 채널 ]  New: [ Telegram To MT5 ] 설정 단계별 사용자 가이드 가 제공됩니다. 텔레그램 API에 대한 지식은 필요하지 않습니다; 개발자가 제공하는 모든 것이 필요합니다. 주요 특징 구독자에게 보낸 주문 상세 정보를 커스터마이즈할 수 있습니다. 예를 들어, 브론즈, 실버, 골드와 같은 계층 구독 모델을 만들 수 있습니다. 골드 구독에서는 모든 신호를 받습니다. id, 심볼, 또는 코멘트로 주문을 필터링할 수 있습니다. 주문이 실행된 차트의 스크린샷이 포함됩니다 보낸 스크린샷에 닫힌 주문을 그려 추가 검증을 합니다
Trade copier MT5
Alfiya Fazylova
4.63 (38)
Trade Copier는 거래 계정 간의 거래를 복사하고 동기화하도록 설계된 전문 유틸리티입니다. 복사는 공급자의 계정/단말기에서 동일한 컴퓨터 또는 vps에 설치된 수신자의 계정/단말기로 발생합니다. 구매하기 전에 데모 계정에서 데모 버전을 테스트할 수 있습니다. 데모 버전 여기 . 전체 지침 여기 . 주요 기능 및 이점: 복사기는 "МТ5> МТ5", "МТ4> МТ5", "МТ5> МТ4" 복사를 지원합니다. 복사기는 데모 계정 > 실 계정, 실 계정 > 데모 계정, 데모 계정 > 데모 계정 및 실제 계정 > 실 계정 복사를 지원합니다. 복사기는 읽기 전용 암호가 적용된 투자자 계정에서 복사를 지원합니다. 하나의 공급자 터미널은 여러 수신 터미널로 트랜잭션을 보낼 수 있고 하나의 수신 터미널은 여러 공급자 터미널에서 트랜잭션을 수신할 수 있습니다. 복사기는 귀하 또는 귀하의 고문이 거래하는 동일한 터미널에서 작동할 수 있습니다. 높은 복사 속도(0.5초 미만). 복사기에는 간편
Smart Stop Manager – 전문 트레이더 수준의 자동 스톱로스 실행 개요 Smart Stop Manager는 Smart Stop 라인업의 실행 계층으로, 여러 개의 오픈 포지션을 보유한 트레이더를 위해 설계된 구조적이고 신뢰할 수 있으며 완전 자동화된 스톱로스 관리 시스템입니다. 모든 활성 거래를 지속적으로 모니터링하고, Smart Stop 시장 구조 로직을 사용해 최적의 스톱레벨을 계산하며, 명확하고 투명한 규칙에 따라 스톱을 자동으로 업데이트합니다. 단일 자산부터 전체 멀티심볼 포트폴리오까지, Smart Stop Manager는 모든 거래에 규율, 일관성, 그리고 완전한 리스크 가시성을 제공합니다. 감정적 판단을 제거하고, 수동 작업을 줄이며, 모든 스톱이 항상 시장 구조 기반의 논리적 진행을 따르도록 보장합니다. 하이라이트 시장 구조 기반 자동 스톱 배치 • 모든 오픈 포지션을 평가하여 Smart Stop 로직에 기반한 최적의 스톱로스를 자동 적용합니다. 포트폴
Smart Stop Scanner – 실제 시장 구조 기반의 멀티자산 스톱로스 분석 시스템 개요 Smart Stop Scanner는 여러 시장에서 스톱로스 구조를 전문적으로 모니터링하기 위해 설계된 강력한 도구입니다. 실제 시장 구조, 핵심 브레이크아웃, 가격 행동 로직을 기반으로 가장 의미 있는 스톱 영역을 자동으로 감지하며, 고해상도(DPI 지원)의 깔끔하고 일관된 패널에 모든 정보를 표시합니다. 포렉스(FOREX), 금, 지수, 금속, 암호화폐 등 다양한 자산군을 지원합니다. 스톱 레벨 계산 방식 이 시스템은 기존의 인디케이터 공식을 사용하지 않습니다. 대신 브레이크아웃, 더 높은 고점, 더 낮은 저점 과 같은 실제 시장 구조 이벤트를 분석합니다. 스톱 레벨은 이러한 구조적 지점에서 직접 생성되므로 시장의 실제 움직임과 자연스럽게 일치하며, 더 신뢰도 높은 스톱 시스템을 제공합니다. 주요 기능 • 고정밀 멀티자산 호환성 포렉스, 금속, 금, 지수, 암호화폐 등 다양한
Advanced Dashboard Ultra
Mirel Daniel Gheonu
5 (1)
MT5용 통계 대시보드 & 저널 ULTRA (Stats Dashboard & Journal ULTRA) 완벽한 트레이딩 지휘 본부: 분석, 자동화 및 뉴스 인텔리전스. Stats Dashboard ULTRA는 Pro 분석 도구의 궁극적인 진화형입니다. 이는 MetaTrader 5를 전문 트레이딩 스테이션으로 변모시키며, 기관급 성과 분석과 자동화된 뉴스 보호 및 고급 심리 지표를 결합합니다. 완전한 통제력을 원하는 수동 트레이더와 EA 포트폴리오 관리자를 위해 설계되었습니다. ULTRA 버전의 새로운 기능 뉴스 인텔리전스 엔진 (News Intelligence Engine): 뉴스를 보기만 하지 말고 분석하십시오. 대시보드는 과거 뉴스 이벤트가 오픈된 포지션에 어떤 영향을 미쳤는지 시뮬레이션하여 포지션을 보유할지 청산할지 알려줍니다. EA 봇 가드 (자동 보호): 중요도가 높은 뉴스(High-Impact News) 발표 중에 다른 전문가 자문(EA)을 자동으로 일시 중지하고 시장이
Equity Protect Pro: 안심 거래를 위한 종합 계좌 보호 전문가 계좌 보호, 자산 보호, 포트폴리오 보호, 다중 전략 보호, 수익 보호, 수익 확보, 거래 보안, 위험 관리 프로그램, 자동 위험 관리, 자동 청산, 조건부 청산, 예약 청산, 동적 청산, 추적 손절매, 원클릭 종료, 원클릭 청산, 원클릭 복원 등의 기능을 찾고 있다면 Equity Protect Pro가 바로 필요한 프로그램입니다. 설정이 간편하고 사전 설정된 조건이 충족되면 모든 차트를 닫을 수 있으며 신호 구독 취소도 지원합니다(이는 모든 거래 프로그램도 중지됨을 의미합니다). 이 시점에서 새로운 주문이 생성되지 않으며 최종적으로 모든 주문이 종료되어 예상치 못한 손실을 효과적으로 방지하고 안심하고 거래할 수 있습니다. Equity Protect Pro Demo Version for yo u to test   Equity Protect Pro MT4 Demo.ex4 Equity Protect Pro M
Pulsar Terminal 은 Astralys LLC 의 상표인 Pulsar Technologies 의 제품입니다. Pulsar Terminal은 MetaTrader 5용 유틸리티 애드온입니다. Expert Advisor 를 통해 MetaTrader 5 계정에 연결되는 동반 애플리케이션 내에서 실행 도구와 결합된 비주얼 인터페이스 입니다. 표준 MT5 패널보다 더 고급 비주얼 인터페이스와 워크플로우를 제공하기 위해 동반 애플리케이션을 사용하여 도구의 기능을 극대화합니다. Pulsar Terminal은 독립형 애플리케이션이 아니며 작동하려면 MetaTrader 5가 필요합니다. EA는 Pulsar Terminal 동반 애플리케이션과 localhost를 통해서만 통신합니다. 동반 애플리케이션 설치 프로그램은 설치 가이드(MQL5 블로그 게시물)를 통해 구매자에게 제공됩니다. 인터페이스를 통해 주문 실행, 리스크 관리, 거래 통계 확인, 그리고 MetaTrader 5에 연결된 동반
Trade Manager DashPlus
Henry Lyubomir Wallace
5 (13)
DashPlus 는 MetaTrader 5 플랫폼에서 거래 효율성과 효과를 향상시키기 위해 설계된 고급 거래 관리 도구입니다. 리스크 계산, 주문 관리, 고급 그리드 시스템, 차트 기반 도구 및 성과 분석 등 포괄적인 기능을 제공합니다. 주요 기능 1. 리커버리 그리드 불리한 시장 상황에서 거래를 관리하기 위한 평균화 및 유연한 그리드 시스템을 구현합니다. 거래 회복을 최적화할 수 있도록 전략적인 진입 및 종료 포인트를 제공합니다. 2. 스택 그리드 강한 시장 움직임 동안 포지션을 추가하여 유리한 거래에서 잠재적 수익을 극대화하도록 설계되었습니다. 유리한 시장 트렌드에서 승률을 높이며 거래를 확장할 수 있도록 합니다. 3. 손익(P&L) 라인 차트에서 잠재적인 수익 및 손실 시나리오를 시각적으로 표현합니다. 설정을 조정하고 P&L 라인을 드래그하여 실행 전에 다양한 거래 결과를 평가할 수 있습니다. 4. 바스켓 모드 동일한 심볼에 여러 포지션을 단일 집계 포지션으로 결합하여 관리합니
The product will copy all telegram signal to MT5 ( which you are member) , also it can work as remote copier.  Easy to set up, copy order instant, can work with almost signal formats, image signal,  s upport to translate other language to English Work with all type of channel or group, even channel have "Restrict Saving Content", work with  multi channel, multi MT5 Work as remote copier: with signal have ticket number, it will copy exactly via ticket number. Support to backtest signal. How to s
Telegram to MT5 Coppy
Sergey Batudayev
5 (8)
Telegram에서 MT5로:   최고의 신호 복사 솔루션 DLL 없이도 Telegram 채널과 채팅에서 MetaTrader 5 플랫폼으로 거래 신호를 직접 복사하는 최신 도구인 Telegram to MT5를 사용하여 거래를 간소화하세요. 이 강력한 솔루션은 정밀한 신호 실행, 광범위한 사용자 정의 옵션을 제공하고 시간을 절약하며 효율성을 높여줍니다. [ Instructions and DEMO ] 주요 특징 직접 Telegram API 통합 전화번호와 보안 코드를 통해 인증하세요. 사용자 친화적인 EXE 브리지를 통해 채팅 ID를 쉽게 관리하세요. 여러 채널/채팅을 추가, 삭제, 새로 고침하여 동시에 신호를 복사합니다. 고급 필터를 사용한 신호 파싱 예외 단어(예: "보고서", "결과")가 포함된 원치 않는 신호를 건너뜁니다. 유연한 SL 및 TP 형식을 지원합니다: 가격, 핍 또는 포인트. 가격 대신 포인트를 지정하는 신호에 대한 진입 포인트를 자동으로 계산합니다. 주문 맞춤화 및
설치 가이드:    여기를 클릭하세요! 여러 전문가 자문가의 의견을 종합적으로 분석합니다. 매직 넘버를 기준으로 EA 결과를 비교해 보세요. 수익성 및 손실 추이 추적 날짜 범위를 기준으로 결과 필터링 시각적 형평성 곡선 및 상세 지표 1분 안에 사용 준비 완료 EA 포트폴리오 분석기 EA 포트폴리오 분석기는   여러 전문가용 투자 자문 시스템(EA)의 실시간 성과를   명확하고 체계적인 방식으로   모니터링하도록 설계된   전문 분석 도구 입니다. 동일한 계정에서 여러 개의 EA를 실행할 때 각 EA가 전체 결과에 어떻게 기여하는지 파악하기 어려울 수 있습니다. EA 포트폴리오 분석기를 사용하면   매직 넘버를 기준으로 EA를 필터링하고 조합하여 특정   EA 하나, 선택한 몇 개의 EA 또는 전체 포트폴리오   의 성과를 확인할 수 있습니다   . 이를 통해 다양한 EA 조합을   쉽게 테스트하고   자산 곡선이 어떻게 함께 움직이는지 확인할 수 있습니다. 이를 통해   보다
Custom Alerts AIO: 다중 시장을 동시에 모니터링 – 설정 없이 즉시 사용 가능 개요 Custom Alerts AIO 는 복잡한 설정 없이 즉시 사용할 수 있는 통합 시장 모니터링 도구입니다. FX Power, FX Volume, FX Dynamic, FX Levels, IX Power 등 필요한 모든 지표가 내장되어 있어 별도의 설치나 구성 없이 알림 기능을 바로 사용할 수 있습니다. 차트 그래픽 없이 작동하며, Forex, 금속, 지수, 암호화폐 등 주요 자산군을 모두 지원합니다. 주식(Symbols)은 별도로 입력하여 추가할 수 있으나, MetaTrader에서는 일반적으로 제한적으로만 사용됩니다. 1. 왜 Custom Alerts AIO를 선택해야 하나요? 추가 라이선스가 필요 없습니다 • 모든 Stein Investments 지표가 내장되어 있어 별도 구매가 필요 없습니다. • 즉시 알림 기능을 시작할 수 있어 빠르고 간편합니다. 모든 시장을 하나의 도구로
Anchor: The EA Manager A coordination system for traders running multiple EAs. Anchor ensures only one EA can trade at a time, preventing conflicting positions and keeping your portfolio safer. Attach Anchor to any chart. Configure your EAs and their magic numbers. Anchor handles the rest. Built for portfolios. Built for discipline. Built for prop firms. The Problem Running multiple EAs on the same account creates risk. Two gold EAs can open opposite positions on the same candle. Three EA
Seconds Chart MT5
Boris Sedov
4.59 (17)
Seconds Chart — MetaTrader 5에서 초 단위 차트를 생성하는 독특한 도구입니다. Seconds Chart 를 사용하면 초 단위로 설정된 타임프레임으로 차트를 작성할 수 있어, 표준 분 또는 시간 단위 차트에서는 불가능한 유연성과 정밀한 분석이 가능합니다. 예를 들어, S15 타임프레임은 15초 동안의 캔들로 구성된 차트를 의미합니다. 사용자 정의 심볼을 지원하는 모든 인디케이터와 전문가 어드바이저를 사용할 수 있습니다. 이를 사용하는 것은 표준 차트에서 거래하는 것만큼 편리합니다. 표준 도구와 달리, Seconds Chart 는 초고속 타임프레임에서도 높은 정확도와 지연 없이 작업할 수 있도록 지원합니다. Seconds Chart의 장점 1초부터 900초까지 의 타임프레임 지원. 내장 틱 데이터베이스 덕분에 역사 데이터 즉시 로딩 . 실시간 데이터 업데이트로 지연이나 차이 없음 . 여러 초 단위 차트를 동시에 생성 가능. Seconds Chart가 이상적인 경우
Timeless Charts
Samuel Manoel De Souza
5 (3)
Timeless Charts is an advanced charting solution designed for professional traders seeking for custom charts / custom timeframes , including seconds charts / seconds timeframe, renko charts / renko bars, cluster charts / footprint charts and advanced tools present in most of the popular platforms. Unlike traditional offline charts or simplistic custom indicators, this solution constructs fully custom bars with true timestamp accuracy , down to miliseconds, allowing for a powerful and precise tr
YuClusters
Yury Kulikov
4.93 (43)
Attention: You can view the program operation in the free version  YuClusters DEMO .  YuClusters is a professional market analysis system. The trader has unique opportunities to analyze the flow of orders, trade volumes, price movements using various charts, profiles, indicators, and graphical objects. YuClusters operates on data based on Time&Sales or ticks information, depending on what is available in the quotes of a financial instrument. YuClusters allows you to build graphs by combining da
Take a Break MT5
Eric Emmrich
4.75 (24)
One tool to protect all your EAs — news filter, equity protection, time filter and more — free demo available Take a Break has evolved from a basic news filter into a comprehensive account protection solution. It pauses your other Expert Advisors during news events or based on custom filters. When trading resumes, it automatically restores your entire chart setup , including all EA settings. Typical use cases: One news filter for all your EAs. Pause trading during news or high volatility — and c
The News Filter MT5
Leolouiski Gan
4.74 (19)
이 제품은 뉴스 시간 동안 모든 전문가 어드바이저 및 수동 차트를 필터링하여 수동 거래 설정이나 다른 전문가 어드바이저가 입력한 거래가 파괴될 수 있는 급격한 가격 상승으로부터 걱정하지 않아도 됩니다. 이 제품은 또한 뉴스 발표 전에 열린 포지션과 대기 주문을 처리할 수 있는 완전한 주문 관리 시스템이 함께 제공됩니다.   The News Filter  를 구매하면 더 이상 내장 뉴스 필터에 의존할 필요가 없으며 이제부터 모든 전문가 어드바이저를 여기서 필터링할 수 있습니다. 뉴스 선택 뉴스 소스는 Forex Factory의 경제 캘린더에서 얻어집니다. USD, EUR, GBP, JPY, AUD, CAD, CHF, NZD 및 CNY와 같은 어떤 통화 기준으로 선택할 수 있습니다. Non-Farm (NFP), FOMC, CPI 등과 같은 키워드 식별을 기준으로 선택할 수도 있습니다. 저, 중, 고 영향을 가지는 뉴스를 필터링할 수 있도록 선택할 수 있습니다. 차트와 관련된 뉴스만 선
제작자의 제품 더 보기
Supply Demand Ranger
Krzysztof Janusz Stankiewic
5 (4)
The indicator draws supply and demand zones. The zone timeframe can be set independently of the chart timeframe. For instance, it is possible to set M5 zones on an H4 chart. The importance of zones can be adjusted using the zone strength parameter. Demand zones are displayed if at least one candle in the range of the zone is entirely above the zone. Similarly, supply zones are displayed if at least one candle within the zone is entirely below the zone.
Integrated Dashboard Scanner
Krzysztof Janusz Stankiewic
5 (1)
Integrated Dashboard Scanner – Version 4.00 The Ultimate Market Command Center just got smarter. Now with Programmable Logic Presets. The Integrated Dashboard Scanner (IDS) monitors multiple symbols and timeframes from a single, DPI-aware panel. Version 4.00 introduces a revolutionary Preset Editor , allowing you to combine signals from different modules into complex, custom strategies without writing a single line of code. NEW IN VERSION 4.00: Filter Presets & Logic Editor Stop scanning for
MACD Divergence and TFR for MT5
Krzysztof Janusz Stankiewic
5 (1)
The indicator identifies divergence by analyzing the slopes of lines connecting price and MACD histogram peaks or troughs. Bullish Divergence (Convergence): Occurs when the lines connecting MACD troughs and corresponding price troughs have opposite slopes and are converging. Bearish Divergence: Occurs when the lines connecting MACD peaks and corresponding price peaks have opposite slopes and are diverging. When a divergence signal is detected, the indicator marks the chart with dots at the pric
The First Red MT5
Krzysztof Janusz Stankiewic
"The First Red" 지표는 Dariusz Dargo가 만든 전략을 기반으로 하며, "The First Red" 전략과 "Second Red," "First Green," "Second Green"과 같은 확장 조건을 충족하는 캔들을 차트에서 식별하고 표시하도록 설계되었습니다. 이 전략은 지역적 극한값과 MACD 오실레이터의 신호를 분석하는 데 중점을 둡니다. 첫 번째 빨간 캔들 (First Red Candle):   캔들이 지역적 최고점을 형성하고 MACD 히스토그램이 하락 방향으로 전환될 때 "First Red"로 표시됩니다. 차트 기호: 캔들 위의 빨간색 아래 화살표. 두 번째 빨간 캔들 (Second Red Candle):   "First Red" 이후의 두 번째 하락 캔들로, 방향 전환을 확인합니다. 차트 기호: 캔들 위의 빨간 숫자 "2". 첫 번째 녹색 캔들 (First Green Candle):   캔들이 지역적 최저점을 형성하고 MACD 히스토그램이 상승 방향
MACD Divergence and TFR for MT4
Krzysztof Janusz Stankiewic
5 (1)
The indicator identifies divergence by analyzing the slopes of lines connecting price and MACD histogram peaks or troughs. Bullish Divergence (Convergence): Occurs when the lines connecting MACD troughs and corresponding price troughs have opposite slopes and are converging. Bearish Divergence: Occurs when the lines connecting MACD peaks and corresponding price peaks have opposite slopes and are diverging. When a divergence signal is detected, the indicator marks the chart with dots at the pric
Supply Demand FVG Zones
Krzysztof Janusz Stankiewic
5 (1)
Supply or demand zones refer to price areas where a significant amount of supply or demand had previously entered the market, causing prices to either fall or rise. If the price returns to the demand or supply zone, it is likely to bounce off due to the large number of orders previously placed within the zone. These orders will be defended in these areas. The Fair Value Gap (FVG) is a concept used to identify imbalances in the equilibrium of buying and selling. Fair Value Gaps are formed in a t
MT5 Macd Divergence Scanner
Krzysztof Janusz Stankiewic
This indicator helps you monitor multiple currency pairs and timeframes all at once. It displays the occurrence of divergences between price and the MACD indicator in a clear and easy-to-read table. Monitoring multiple timeframes and currency pairs in one place helps traders identify a divergence without needing to switch between charts. Divergences can be bullish or bearish. For example, if the price forms a higher high while the MACD forms a lower high, this indicates bearish divergence. On th
Purpose of the Inside Bar and Outside Bar Breakout Scanner Indicator: The Inside Bar & Outside Bar Breakout Scanner  is an advanced dashboard designed to scan multiple instruments and timeframes simultaneously. Its primary function is to identify two powerful candlestick patterns—the  Inside Bar (IB)  and the  Outside Bar (OB) —and then to detect and classify breakouts from these formations. The indicator presents its findings in a clean, organized table, signaling potential trend continuation o
Supply Demand FVG
Krzysztof Janusz Stankiewic
3 (2)
The indicator offers a comprehensive suite of features for identifying key market areas, including: Supply Zones Demand Zones Fair Value Gaps (FVG) and provides alerts whenever price reaches a supply or demand zone. Key Features: Historical Zones: In addition to active zones, the indicator now includes historical supply, demand, and FVG zones, allowing for a deeper analysis of past price behavior. Flexible Zone Timeframes: Zones can be plotted independently of the chart's timeframe, enabling sce
MT4 Macd Divergence Scanner
Krzysztof Janusz Stankiewic
이 지표는 여러 통화쌍과 시간대를 동시에 모니터링할 수 있는 효율적인 방법을 제공합니다. 가격과 MACD 간 다이버전스를 명확하고 읽기 쉬운 표 형태로 시각화하여, 트레이더들이 차트를 계속 전환할 필요 없이 잠재적인 시장 전환점을 파악할 수 있습니다. 다이버전스는 상승(강세) 또는 하락(약세) 추세 전환 신호로 작용할 수 있습니다. 예를 들어, 가격이 새 고점을 기록했지만 MACD가 이를 더 높은 고점으로 확인하지 못한다면 이는 약세 다이버전스입니다. 반대로, 가격이 더 낮은 저점을 형성하는 동안 MACD가 더 높은 저점을 형성한다면 이는 강세 다이버전스입니다. 지표의 표에서 각 종목(예: EURUSD, GBPUSD)은 왼쪽에 세로로 나열되고, 선택한 시간대(M5, H1, D1 등)는 상단에 가로로 배치됩니다. 단순한 점은 다이버전스가 감지되지 않았음을 의미하며, “UP” 또는 “DN”(하락) 표시가 나타나면 잠재적 거래 신호를 강조합니다. 녹색 “UP”은 매수 기회를, 빨간색 “D
The First Red MT4
Krzysztof Janusz Stankiewic
"The First Red" 지표는 Dariusz Dargo가 만든 전략을 기반으로 하며, "The First Red" 전략과 "Second Red," "First Green," "Second Green"과 같은 확장 조건을 충족하는 캔들을 차트에서 식별하고 표시하도록 설계되었습니다. 이 전략은 지역적 극한값과 MACD 오실레이터의 신호를 분석하는 데 중점을 둡니다. 첫 번째 빨간 캔들 (First Red Candle):   캔들이 지역적 최고점을 형성하고 MACD 히스토그램이 하락 방향으로 전환될 때 "First Red"로 표시됩니다. 차트 기호: 캔들 위의 빨간색 아래 화살표. 두 번째 빨간 캔들 (Second Red Candle):   "First Red" 이후의 두 번째 하락 캔들로, 방향 전환을 확인합니다. 차트 기호: 캔들 위의 빨간 숫자 "2". 첫 번째 녹색 캔들 (First Green Candle):   캔들이 지역적 최저점을 형성하고 MACD 히스토그램이 상승 방향
필터:
리뷰 없음
리뷰 답변