TRharmonic v21

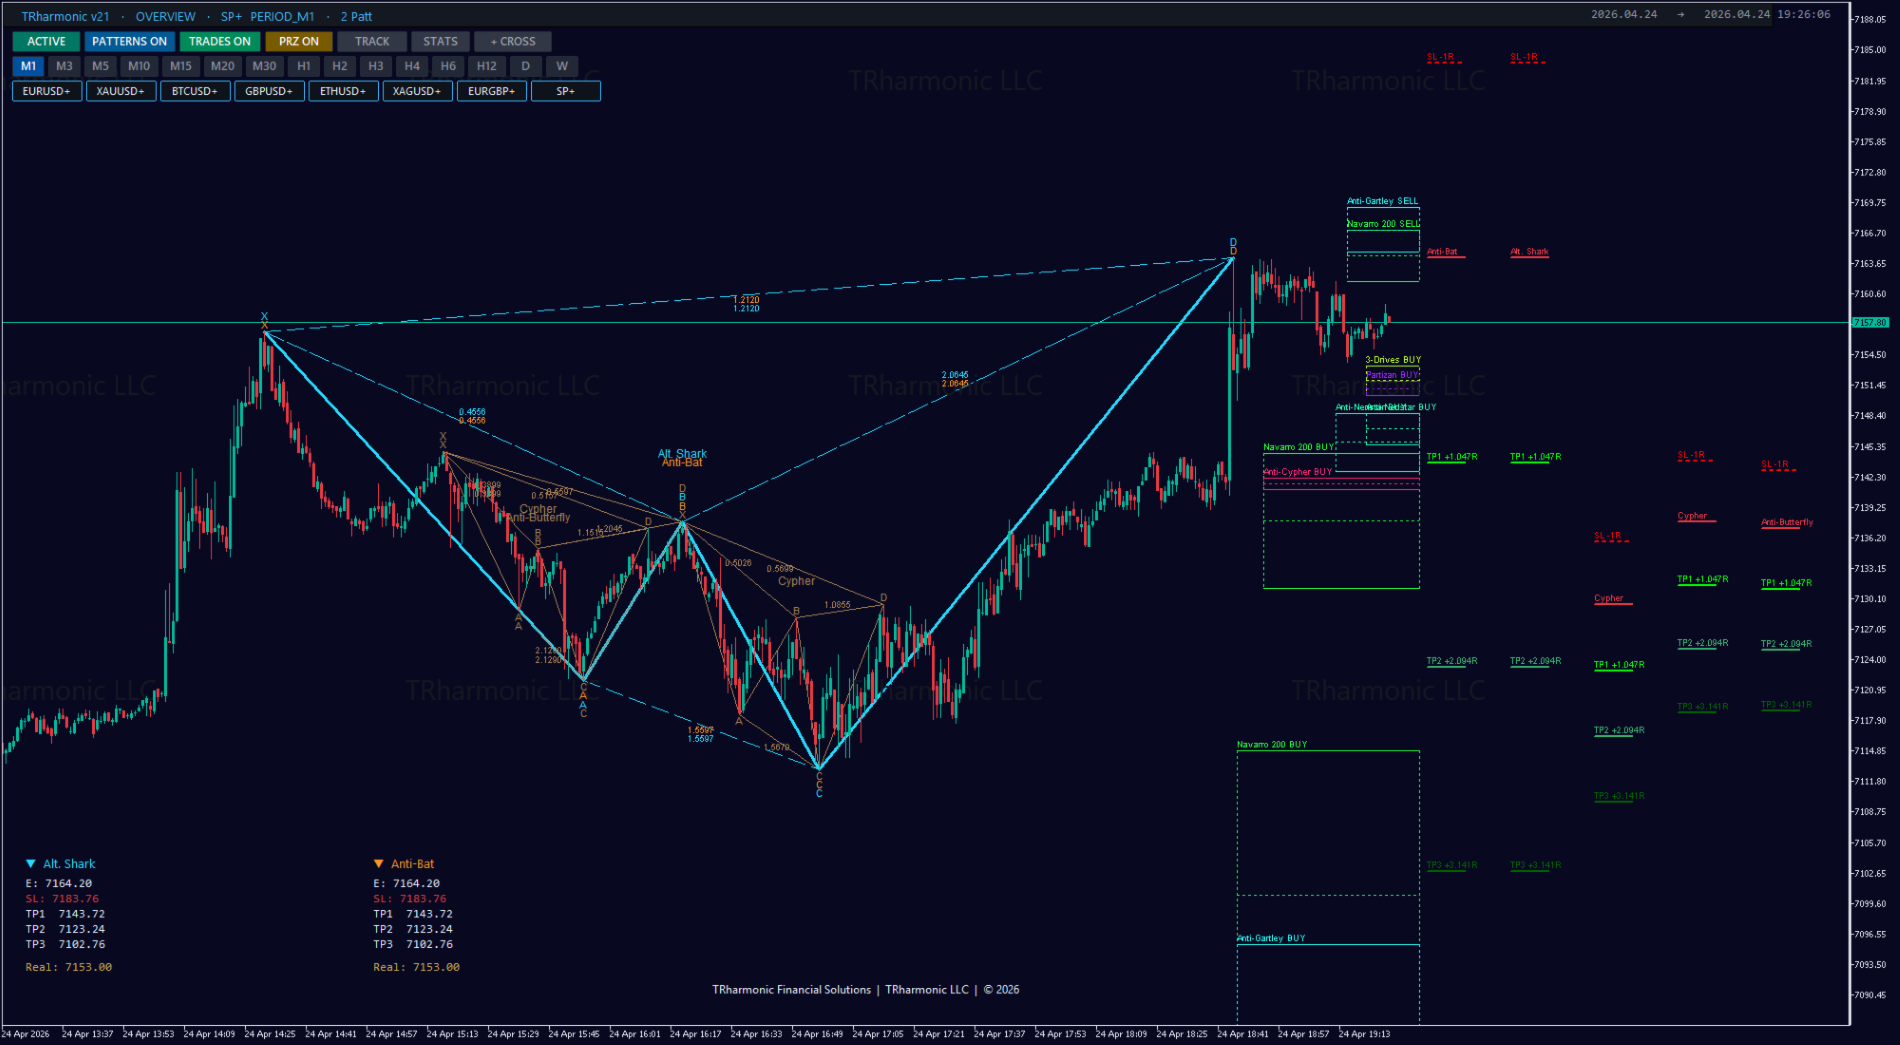
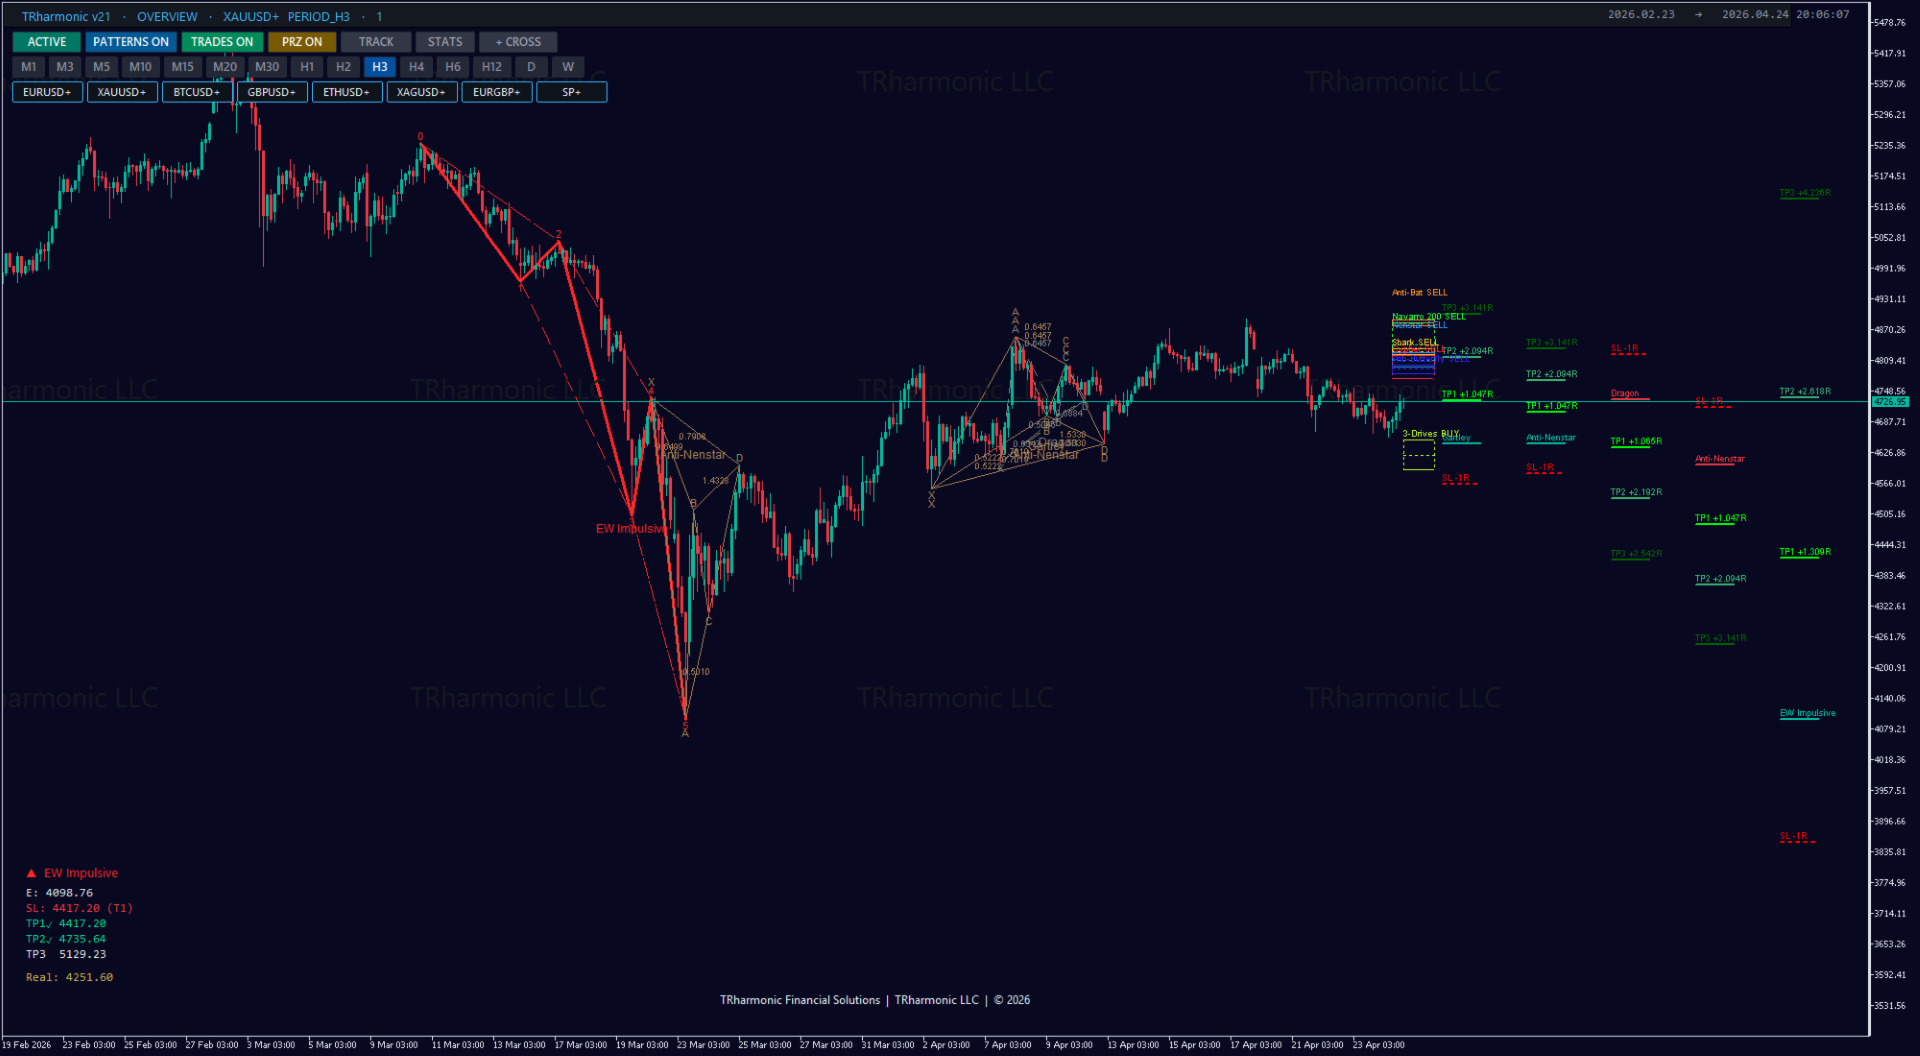
TRharmonic v21 — Harmonic Pattern Detector

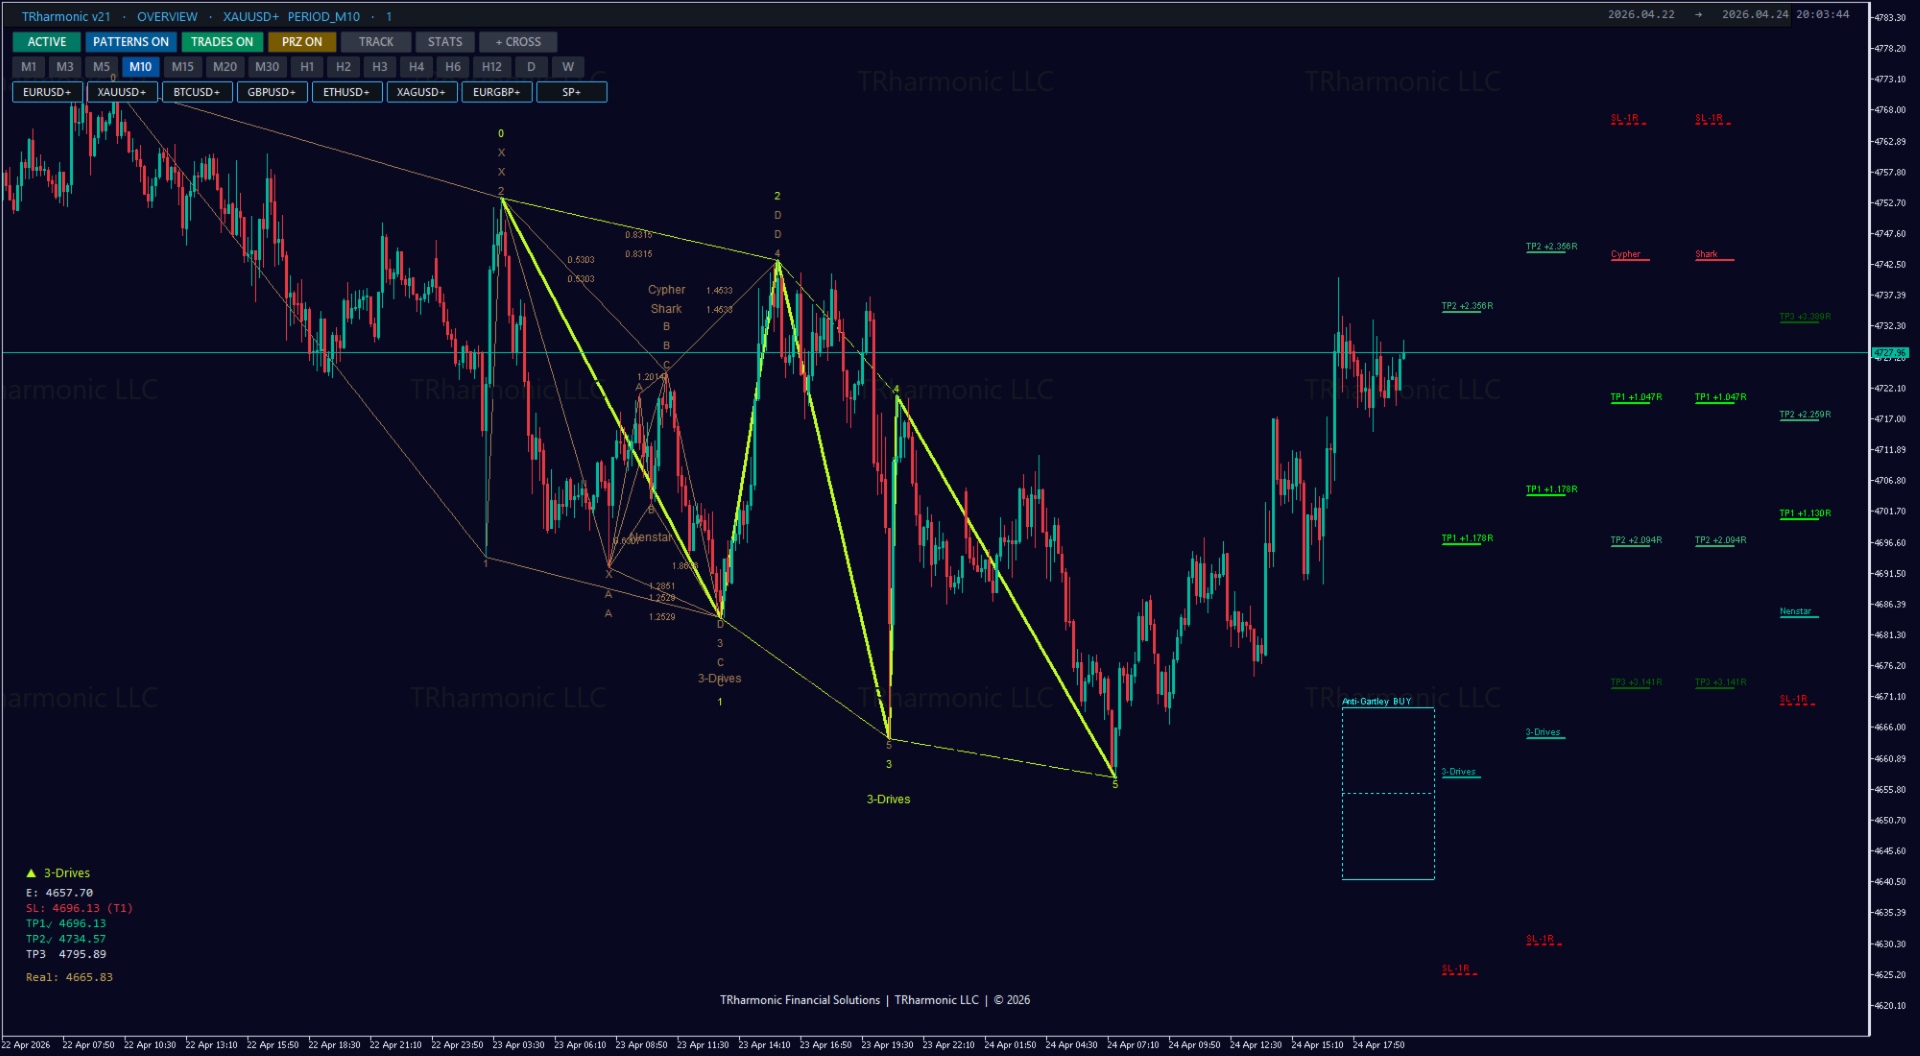
A professional MetaTrader 5 harmonic pattern indicator. Detects 29 classic and advanced pattern types in real time, automatically projects Entry, SL, TP1, TP2, and TP3 levels at every pattern commit, and locks active patterns at bar close (no repaint). Works with every broker and produces consistent signals across forex, metals, indices, crypto, and stocks.

What It Does

  • Detects 29 harmonic patterns in real time (Classic, Advanced, Anti, Swan, Exotic groups)
  • Calculates and draws SL / TP1 / TP2 / TP3 levels on every pattern commit
  • Locks the D point the moment its bar closes; no repaint as standard
  • 8 gate CurveCast + TRE confirmation engine filters for high quality signals
  • Optional Potential Reversal Zones (PRZ) and multi timeframe scanning

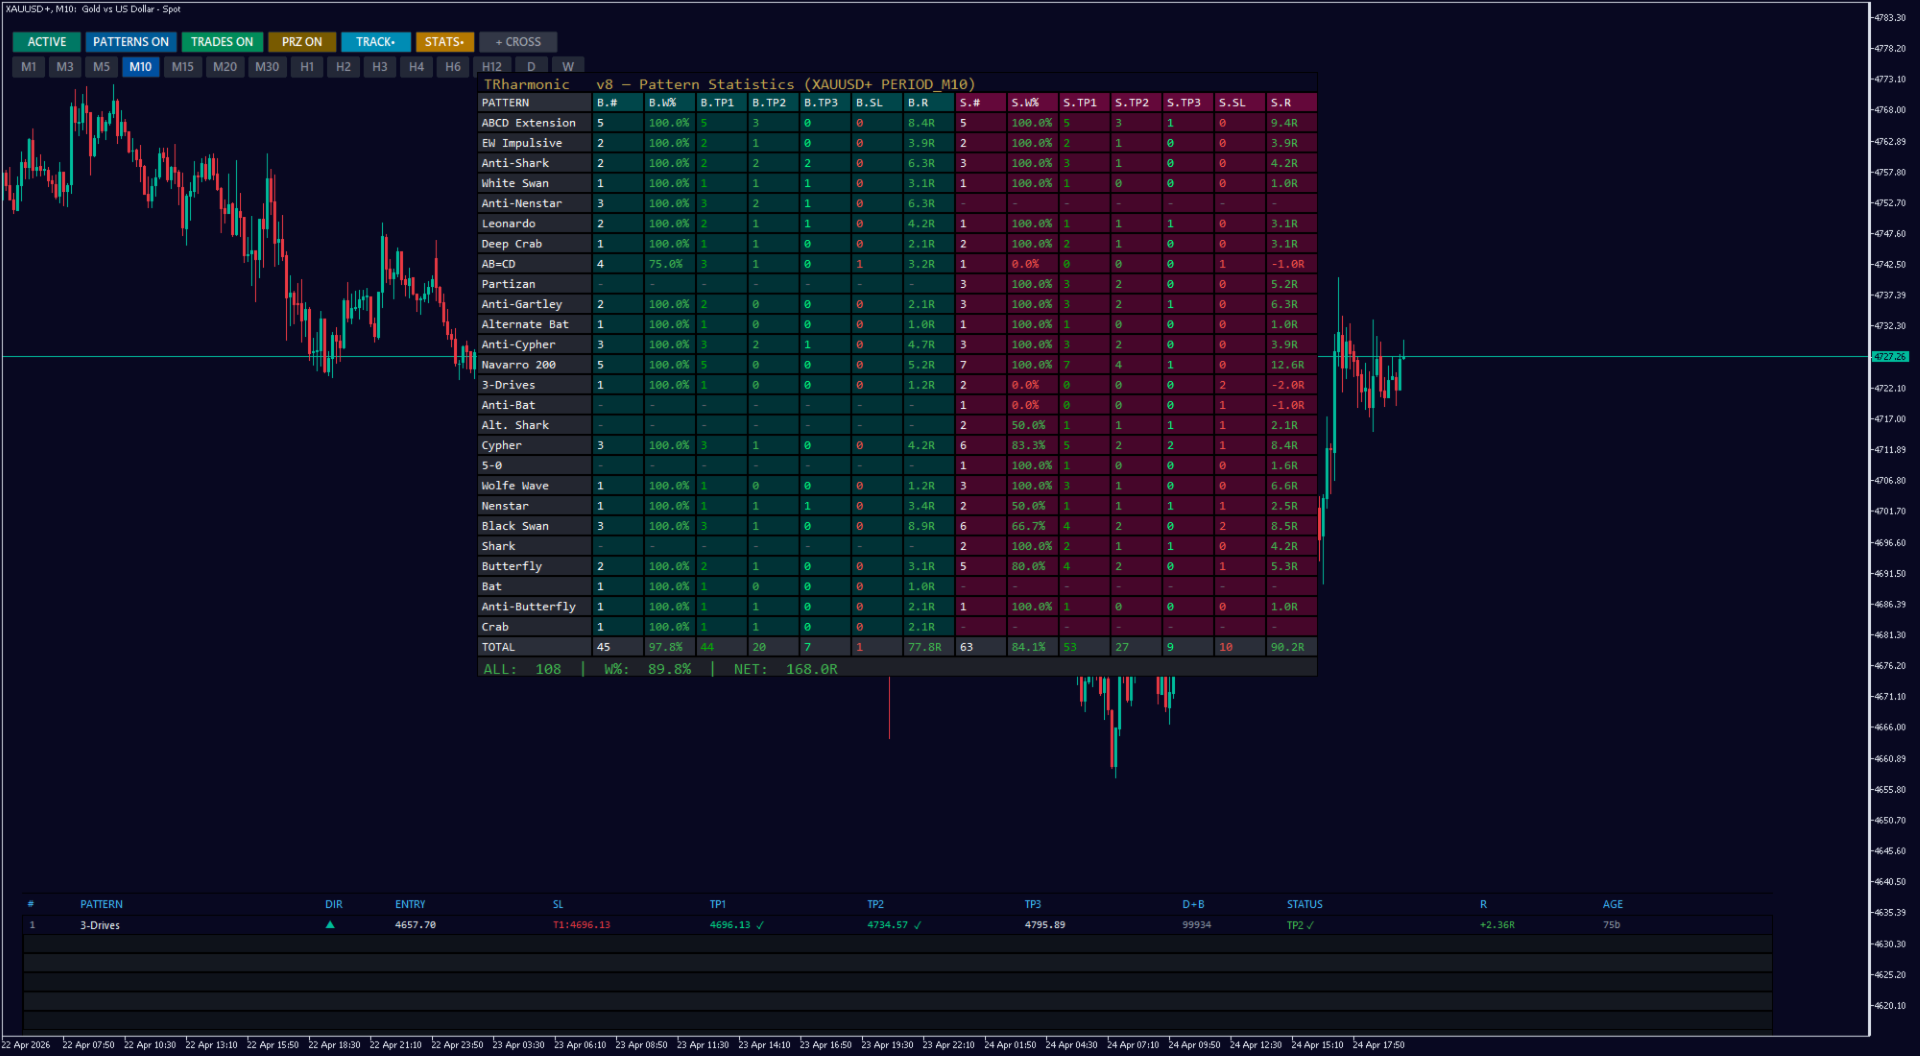
Pattern Library (29)

  • Classic (10): Gartley, Bat, Alternate Bat, Butterfly, Crab, Deep Crab, Shark, AB=CD, ABCD Extension, 5-0
  • Advanced (4): EW Impulsive, Dragon, Wolfe Wave, 3-Drives
  • Anti (5): Anti-Gartley, Anti-Bat, Anti-Butterfly, Anti-Crab, Anti-Shark — trend continuation signals
  • Swan (2): Black Swan, White Swan — extreme reversals
  • Exotic (8): Nenstar, Leonardo, Cypher, Anti-Cypher, Alternate Shark, Partizan, Navarro, Anti-Nenstar

Alert Routing

Every pattern commit, TP hit, SL, BE exit, TP1 trail exit, expiration, and invalidation event fans out to the following routes, each independently togglable:

  • MT5 Terminal popup (Alerts tab, timestamped)
  • Per event sound cues (separate .wav for pattern commit / TP / SL / invalidation)
  • On chart toast cards (top right, auto-expiring)
  • MetaQuotes ID mobile push notifications
  • Email via MT5 SMTP configuration

Cooldown on a (patternId, kind) basis prevents the same event from firing twice in rapid succession.

Themes

  • CORPORATE — deep navy background, cyan/teal accent; standard office use
  • OBSIDIAN — near black violet background, mint/coral accent; low light environments
  • LIGHT — light background, Flat UI palette; daylight
  • CUSTOM — all colors user defined (background, accents, panel, gold)

Preset Profiles

  • BEGINNER: Conservative: strict confirmation threshold (7 of 8), Classic + Advanced groups only, maximum 3 active patterns
  • BALANCED: Balanced default: mid confirmation threshold (5 of 8), all groups on, maximum 10 active patterns
  • PRO: Broader coverage: mid confirmation threshold (5 of 8), all groups on, maximum 10 active patterns
  • CUSTOM: All parameters honored from individual user inputs; full manual control

Who It Is For

  • Manual harmonic traders — eliminates the burden of pattern detection and level calculation
  • Algorithmic traders — use alert / email integration to trigger external EAs
  • Analysts — PRZ projections provide pre commit zone visualization

Compatibility

  • MetaTrader 5 (build 3000 and above)
  • All brokers; no broker specific dependencies
  • Forex (majors + crosses), metals (XAU / XAG), indices (S&P 500, DAX, etc.), crypto (BTC / ETH / alt), stocks
  • All timeframes (M1 through W1); per timeframe optimized presets (AUTO, FAST, MEDIUM, TREND modes)

Pattern Colors — Lifecycle States

The indicator uses color to convey the current state of every pattern at a glance:

Color State Meaning
Vibrant (bull green / bear red) ACTIVE The pattern is being tracked. SL / TP / BE events can still occur. The pattern has not closed or been invalidated within the tracking window (200 bars by default).
Sepia brown CLOSED The trade has ended, whether by TP3 hit, SL hit, break-even stop, TP1 trail exit, or tracking expiration. The pattern is not removed from the chart; it remains in brown as a historical reference. No further events fire.
Gray dashed INVALIDATED The pattern is structurally broken: price crossed through the D level in the opposite direction (D+3 rule) or a structural invalidation occurred. The pattern is marked with a gray dashed outline. Any open position tied to this pattern should be reviewed manually.

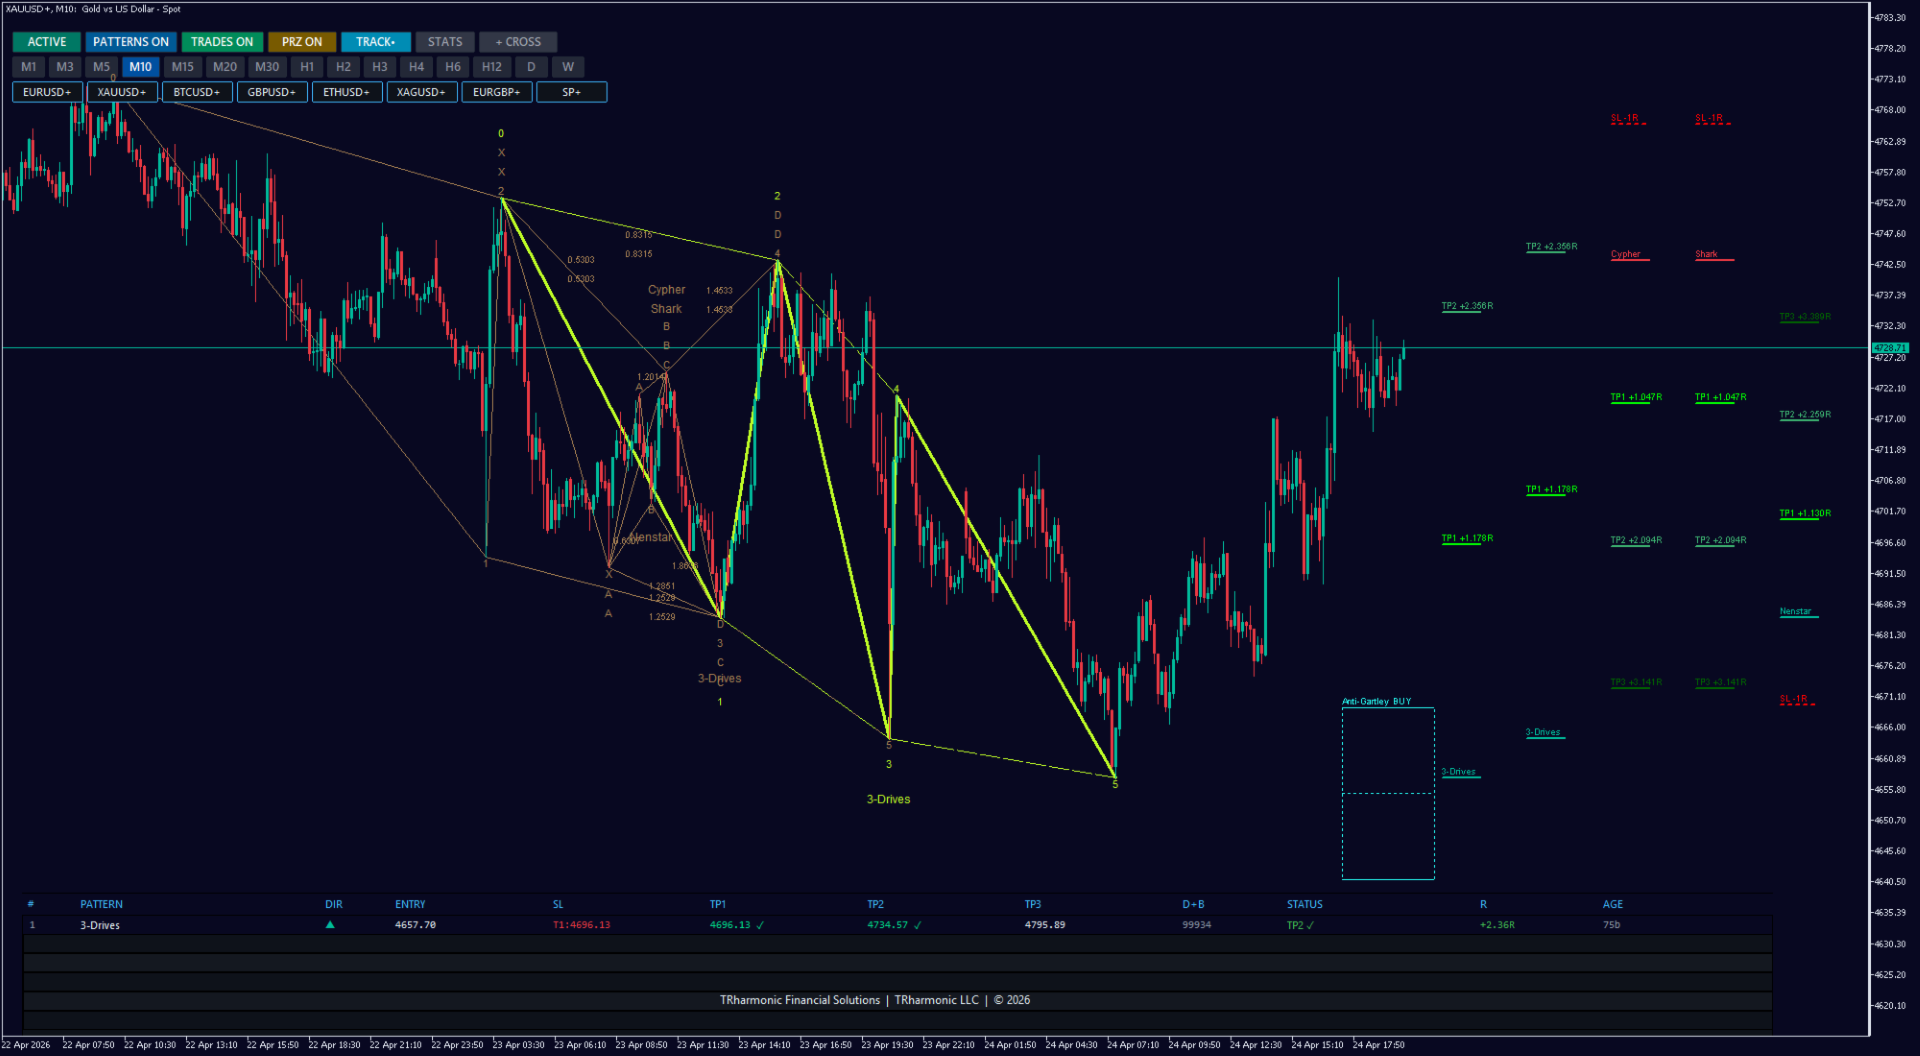
Trade Closing — Three Stage Ladder

When a pattern commits, the indicator calculates four levels: Entry, SL, TP1, TP2, TP3. Trade management follows a strict three stage ladder exit system. Hitting each level closes part of the position AND moves the stop up. Net effect: no full risk loss (full minus 1R) happens after TP1; no full opportunity loss happens before TP3.

Ladder Flow

  • Entry and SL: When a pattern commits, the Entry price is locked at the D point. The SL is assigned based on the pattern type to either the X level or a Fibonacci depth. The original SL represents a full 1R risk.
  • TP1 Hit (Stage 1): When price reaches TP1: 50 percent of the position is closed. The SL moves from Entry to the Entry price itself, known as Break Even (BE). From this moment: (a) if price reverses, the SL equals Entry closes the residual half at zero and the composite result is about plus 0.5R; (b) if price continues, we progress to TP2.
  • TP2 Hit (Stage 2): When price reaches TP2: another 25 percent of the original position (half of the remaining 50 percent) is closed. The SL moves to TP1, which is called a TP1 trail and locks in at least plus 1R on the remaining 25 percent. From this moment: (a) if price reverses to TP1, the residual closes at the locked plus 1R; (b) if price continues, we progress to TP3.
  • TP3 Hit (Stage 3 — Final): When price reaches TP3: the remaining 25 percent of the position closes. The trade is fully complete. The pattern turns sepia brown. Composite result on a full ladder TP1 + TP2 + TP3 is roughly plus 2.0R.

Lifecycle Events

The following events are monitored throughout the tracking window (default 200 bars) and routed to the configured alert channels:

  • SL Hit (No TP reached): Price touched the original SL level without any TP being hit. The full position closes. Result: minus 1R. The pattern turns sepia brown.
  • BE Exit (After TP1): After TP1 triggered, price returned to the Entry level; the remaining 50 percent of the position closed at Entry. The TP1 leg had already booked plus 1R on its half, so the BE exit contributes 0R. Composite result: about plus 0.5R. The pattern turns sepia brown.
  • TP1 Trail Exit (After TP2): After TP2 triggered, price returned to the TP1 level; the remaining 25 percent of the position closed at TP1. The TP1 and TP2 legs had already booked profit; the TP1 trail exit locked plus 1R on the residual. Composite result: about plus 1.5R. The pattern turns sepia brown.
  • TP3 Hit (Final Target): The remaining position closed at TP3. The trade completed successfully. Composite result: about plus 2.0R. The pattern turns sepia brown.
  • Expired: The tracking window (InpTrackingMaxBars, default 200) closed without any SL, TP, or invalidation event. The pattern is marked expired, which is a passive end. The user must manage any remaining residual position manually. The pattern turns sepia brown.
  • Invalidated: Price crossed the structural D reference level of the pattern (D+3 rule or structural break). The pattern is considered geometrically broken. It is marked with a gray dashed outline. The user must manually manage any open position.

This color and lifecycle scheme applies uniformly across all 29 pattern types. Reading the three states at a glance (active, closed, invalidated) lets you quickly assess the current state of your portfolio.

추천 제품
Overview Harmonic Patterns MT5 is a technical analysis indicator designed for the MetaTrader 5 platform. It identifies and displays harmonic price patterns, such as Butterfly, Cypher, Crab, Bat, Shark, and Gartley, in both bullish and bearish directions. The indicator calculates key price levels, including entry, stop loss, and three take-profit levels, to assist traders in analyzing market movements. Visual elements and customizable alerts enhance usability on the chart. Features Detects six ha
"Blow It Up!" – The Trading Indicator That Questions Your Life Choices Tired of boring indicators? Meet your new market companion that delivers:   "YOLO BUY!" arrows   when you should probably panic   Explosive rectangle confetti   (because why not?)   200+ soul-crushing quotes   like   "Your stop loss is imaginary"   and   "This isn’t trading, it’s donating to whales"   Random alerts that roast your strategy This Indicator is like Therapy   – Because daytrading shouldn’t feel
Trade smarter, not harder: Empower your trading with Harmonacci Patterns This is arguably the most complete harmonic price formation auto-recognition indicator you can find for the MetaTrader Platform. It detects 19 different patterns, takes fibonacci projections as seriously as you do, displays the Potential Reversal Zone (PRZ) and finds suitable stop-loss and take-profit levels. [ Installation Guide | Update Guide | Troubleshooting | FAQ | All Products   |  Get Help ] It detects 19 differen
Triangle Pattern Gann v3.1 - Complete Feature Documentation Core Functionality OverviewTriangle Pattern Gann v3.1 is a sophisticated MetaTrader 5 indicator that combines W.D. Gann's geometric trading principles with advanced triangle pattern recognition to deliver actionable trading signals. Primary Features1. Triangle Pattern Detection SystemAscending Triangle Recognition Function: Automatically identifies bullish continuation patterns Detection Criteria: Flat horizontal resistance line
SMC Venom Model BPR 지표는 Smart Money(SMC) 개념 내에서 일하는 트레이더를 위한 전문 도구입니다. 가격 차트에서 두 가지 주요 패턴을 자동으로 식별합니다. FVG (공정 가치 갭)는 3개의 캔들의 조합으로, 첫 번째와 세 번째 캔들 사이에 갭이 있습니다. 이는 볼륨 지원이 없는 레벨 사이에 구역을 형성하여 종종 가격 수정으로 이어집니다. BPR (균형 가격 범위)은 두 개의 FVG 패턴의 조합으로, "브리지"를 형성합니다. 이는 가격이 낮은 볼륨 활동으로 움직일 때 브레이크아웃과 레벨로의 복귀 구역으로, 캔들 사이에 갭을 생성합니다. 이러한 패턴은 거래자가 차트에서 거래량과 가격 역학을 분석하여 주요 지지/저항 수준, 돌파 구역 및 진입 지점을 식별하는 데 도움이 되며, 여기서 대형 시장 참여자와 일반 참여자 간의 상호 작용이 발생합니다. 이 지표는 사각형과 화살표 형태로 패턴을 시각화하며 유연한 경고 설정도 지원합니다. 주요 특징: 패턴 표시 모드
Zone Structure Scanner Panel for MT5 Find better setups faster — without scanning charts for hours. The Zone Structure Scanner Panel for MT5 helps you automatically scan multiple symbols, detect key weekly and daily support/resistance zones, read market structure, highlight confluence, and flag H4 rejection-confirmed setups from one powerful panel. Instead of jumping from chart to chart, you get ranked opportunities in one place so you can focus on the setups that matter most. Why it stands
Gartley Projections D
Oleksandr Medviediev
3 (2)
The indicator identifies the harmonic patterns (XABCD) according to developments of H.M.Gartley ( "Profits in the Stock Market" , 1935г). It projects D-point as a point in the perspective projection (specify ProjectionD_Mode = true in the settings). Does not redraw. When a bar of the working timeframe closes, if the identified pattern point has not moved during Patterns_Fractal_Bars bars, an arrow appears on the chart (in the direction of the expected price movement). From this moment on, the ar
Equinox Gold
Dmitriq Evgenoeviz Ko
Equinox Gold is a high-tech trading expert advisor (EA) specifically designed for the gold market ( XAUUSD ). The system is based on a unique Market Equilibrium algorithm that identifies areas of imbalance between supply and demand during extreme volatility. Unlike most robots that use dangerous sit-and-wait methods, Equinox Gold relies on mathematical momentum confirmation and strict risk control for every trade. MAIN ADVANTAGES VRP Filter (Volatility Range Filter): The robot automatically ada
Surf Board
Mohammadal Alizadehmadani
Benefits of the Surfboard indicator : Entry signals without repainting If a signal appears and is confirmed, it does NOT disappear anymore, unlike indicators with repainting, which lead to major financial losses because they can show a signal and then remove it. perfect opening of trades The indicator algorithms allow you to find the Peak and floor position to enter a deal (buy or sell an asset), which increases the success rate for each and every trader using it. Surfboard works with any asset
우선적으로, 이 거래 도구는 전문적인 거래에 이상적인 비-다시 그리기 및 지연되지 않는 지표입니다.  온라인 강좌, 사용자 매뉴얼 및 데모. 스마트 가격 액션 컨셉트 인디케이터는 신규 및 경험 많은 트레이더 모두에게 매우 강력한 도구입니다. Inner Circle Trader Analysis 및 Smart Money Concepts Trading Strategies와 같은 고급 거래 아이디어를 결합하여 20가지 이상의 유용한 지표를 하나로 결합합니다. 이 인디케이터는 스마트 머니 컨셉트에 중점을 두어 대형 기관의 거래 방식을 제공하고 이동을 예측하는 데 도움을 줍니다.  특히 유동성 분석에 뛰어나 기관이 어떻게 거래하는지 이해하는 데 도움을 줍니다. 시장 트렌드를 예측하고 가격 변동을 신중하게 분석하는 데 탁월합니다. 귀하의 거래를 기관 전략에 맞추어 시장의 동향에 대해 더 정확한 예측을 할 수 있습니다. 이 인디케이터는 시장 구조를 분석하고 중요한 주문 블록을 식별하고 다양
SPECIAL LAUNCH OFFER: $30 (1-Month Rent) Limited time offer to build our community and gather feedback! AmbM GOLD Institutional Scalper A high-precision M5 algorithm for XAUUSD (Gold) , engineered to trade exclusively at Institutional Liquidity Levels ($5/$10 psychological marks). PERFORMANCE DATA (BUY ONLY) • Win Rate: 87.09%. • Safe Growth: +$4,113 profit on $10k (13.75% Max Drawdown). • Extreme Stress Test: Successfully generated +$22,997 in a 5-year stress test (2020-2026), proving
WAPV Weis Wave Chart Forex
Eduardo Da Costa Custodio Santos
The Weis Wave Chart Forex for MT5 is a Price and Volume indicator. The Price and Volume reading was widely disseminated through Richard Demille Wyckoff based on the three laws created by him: Supply and Demand, Cause and Effect and Effort vs. Result. In 1900 R.Wyckoff already used the wave chart in his analyses. Many years later, around 1990, David Weis Automated R. Wyckoff's wave chart and today we bring you the evolution of David Weis' wave chart. It shows the amount of Volume and the amount o
Elliott Wave Trend MT5
Young Ho Seo
4 (4)
Elliott Wave Trend was designed for the scientific wave counting. This tool focuses to get rid of the vagueness of the classic Elliott Wave Counting using the guideline from the template and pattern approach. In doing so, firstly Elliott Wave Trend offers the template for your wave counting. Secondly, it offers Wave Structural Score to assist to identify accurate wave formation. It offers both impulse wave Structural Score and corrective wave Structure Score. Structural Score is the rating to sh
Astrology Indicator MT5
Thomas Bradley Butler
This indicator is a   technical tool based on harmonic approximations   of solar and lunar cycles. It   does not use exact astronomical positions. This indicator uses   mathematical waves to approximate daily solar and monthly lunar cycles   for trading purposes. It captures general market rhythms influenced by day/night and moon phases, but it   does not track exact astronomical positions . Do your analysis and study on back test before purchase.  The   Advanced Astrological Indicator   is a m
Harmonic Pattern Structure Harmonic Pattern Structure is a professional MetaTrader 5 indicator that automatically detects classic harmonic patterns using strict Fibonacci ratio validation and XABCD price structure. Designed for traders who value precision, clean visuals, and structured analysis, the indicator highlights potential reversal zones based on price geometry, supporting consistent and objective decision-making. SUPPORTED HARMONIC PATTERNS Gartley (222) Butterfly Bat Crab Shark Cy
KT Renko Patterns MT5
KEENBASE SOFTWARE SOLUTIONS
KT Renko Patterns는 렌코 차트를 벽돌 하나하나 분석하여, 전 세계 다양한 금융 시장에서 트레이더들이 자주 사용하는 유명한 차트 패턴들을 찾아냅니다. 시간 기반 차트와 비교하면, 렌코 차트는 시각적으로 단순하고 깔끔하여 패턴 중심의 트레이딩이 훨씬 쉽게 가능합니다. KT Renko Patterns에는 다양한 렌코 패턴이 포함되어 있으며, 이 중 상당수는 Prashant Shah의 저서 『Profitable Trading with Renko Charts』에서 자세히 설명되어 있습니다. KT Renko Patterns 인디케이터를 기반으로 한 100% 자동화된 EA는 여기에서 이용할 수 있습니다 - KT Renko Patterns EA . 기능 소개 최대 8개의 명확한 렌코 패턴을 거래할 수 있어, 혼동 없이 신뢰도 높은 트레이딩이 가능합니다. 객관성을 제공하기 위해 각 패턴에는 손절선과 피보나치 목표가 함께 제공됩니다. KT Renko Patterns는 각 패턴의 정
MercariaPattern1-2-3 відстежує рух ціни, знаходить трьоххвильові структури 1-2-3 та підсвічує момент, коли сценарій підтверджується пробоєм ключового рівня. MercariaPattern1-2-3 tracks price movement, detects three-leg 1-2-3 structures and highlights the moment when the scenario is confirmed by a key level breakout. Індикатор збирає локальні свінги в компактну фігуру 0–1–2–3 , чекає підтвердженого пробою та будує стрілку входу з готовими рівнями SL/TP. The indicator combines local swings into a
AUTO FIBONACCI MULTI-TIMEFRAME TOOLKIT Technical analysis tool that automatically draws Fibonacci levels for 4H, Daily, Weekly, and Monthly sessions. AUTOMATIC FIBONACCI RETRACEMENTS (7 CLASSIC LEVELS): - 0.0% (Previous session Low - support level) - 23.6% (Fibonacci Golden Ratio - early entry level) - 38.2% (Strong retracement level) - 50.0% (Key pivot level highlighted in YELLOW - market equilibrium) - 61.8% (Main Golden Ratio - critical decision level) - 78.6% (Deep retracement level) - 100.0
Индикатор "Benefit Predictor" Это высокоточный инструмент для прогнозирования разворота цены на любом финансовом инструменте и любом таймфрейме. Этот продукт появился благодаря годам опыта и исследований в области анализа цен и других временных рядов, используя продвинутые методы машинного обучения и математического анализа. Особенности продукта : Готовая торговая система, подходит как для ручной торговли, так и для использования в торговых роботах. Не перерисовывается после появления сигнала
This indicator is, without a doubt, the best variation of the Gann Angles among others. It allows traders using Gann methods to automatically calculate the Gann angles for the traded instrument. The scale is automatically calculated when the indicator is attached to the chart. When switching timeframes, the indicator recalculates the scale for the current timeframe. Additionally, you can enter your own scales for the Gann angles. You can enter your own scales either for both vectors or for each
Monster Harmonics Indicator is a harmonic pattern indicator. It recognizes Gartley, Bat, Crab, Butterfly, Cypher, White Swan, Black Swan, Shark and AB=CD patterns. Projected patterns that are not yet completed are recognized, too. Monster even shows the PRZ (Potential Reversal Zone). Users can add their own user defined patterns to Monster. Besides the current pattern, Monster also shows all patterns in the symbols history. Monster will provide alerts for developing patterns. Introduced by H.M.
Welcome to the Ultimate Harmonic Patterns recognition indicator that is focused to detect advanced patterns. The Gartley pattern, Bat pattern, and Cypher pattern  are popular technical analysis tools used by traders to identify potential reversal points in the market. Our Ultimate Harmonic Patterns recognition Indicator is a powerful tool that uses advanced algorithms to scan the markets and identify these patterns in real-time. With our Ultimate Harmonic Patterns recognition Indicator, you ca
Noize Absorption Index
Ekaterina Saltykova
Noize Absorption Index - is the manual trading system that measures the difference of pressure between bears forces and bulls forces. Green line - is a noize free index that showing curent situation. Zero value of index shows totally choppy/flat market.Values above zero level shows how powerfull bullish wave is and values below zero measures bearish forces.Up arrow appears on bearish market when it's ready to reverse, dn arrow appears on weak bullish market, as a result of reverse expectation.
Harmonic Pattern Hunter
Shingidzano Lesetedi
Harmonic Pattern Hunter Harmonic Pattern Hunter is a technical indicator for MetaTrader 5 that automatically identifies and draws high-probability harmonic patterns directly on the chart. It is designed to assist traders who use harmonic analysis as part of their trading methodology. How It Works The indicator scans historical and live price data for completed XABCD harmonic structures using Fibonacci ratio validation. When a valid pattern is detected, it draws the full pattern geometry, marks t
RBreaker
Zhong Long Wu
RBreaker Gold Indicators는 금 선물을 위한 단기 데이 트레이딩 전략으로, 추세 추종과 데이 내 반전의 두 가지 거래 방식을 결합합니다. 추세 장에서 수익을 포착할 수 있을 뿐만 아니라, 시장이 반전될 때 적시에 이익을 확정하고 추세에 맞춰 반대 포지션을 잡을 수 있습니다. 이 전략은 미국 잡지 Futures Truth에서 15년 연속으로 가장 수익성 높은 트레이딩 전략 상위 10위 안에 선정되었습니다. 긴 라이프사이클을 자랑하며, 현재까지 국내외에서 널리 사용되고 연구되고 있습니다. 본 지표는 2026년 금 선물의 움직임을 반영하여 14일 ATR 지표를 기반으로 돌파 계수 A, 관찰 계수 B, 반전 계수 R을 보다 합리적인 값으로 정의했습니다. 매우 훌륭한 지표이며, 안정적인 연간 수익성을 달성했습니다. 강력히 추천합니다~ 위 지표는 변동성이 높은 상품에 적합하며, 매개변수는 금 선물, 주가 지수 선물 등에 적합합니다. 다른 상품이 필요한 경우 돌파 계수 A
Supertrend Pro MTF Dashboard: Trade with Confidence Stop missing high-probability trades. The Supertrend Pro MTF Dashboard is the professional-grade tool designed to cut through market noise and instantly identify powerful, aligned trends across 8 timeframes (M1 to W1). Built for serious traders, this indicator delivers no-repaint signals and a clean, actionable dashboard, making multi-timeframe confirmation effortless. KEY FEATURES FOR PROFESSIONAL TRADERS 1. Multi-Timeframe Trend Alignment
Usdjpy Trend Follower
Marcos Ramon Aparicio Pelaez
강력하고 백테스트된 MetaTrader 5 로봇으로 USDJPY를 자동으로 거래하세요. Momentum Master H1은 동적 Bulls Power 및 ATR 기반 항목을 기반으로 하는 높은 확률의 장기 전용 전략을 사용합니다. 주요 기능은 다음과 같습니다 시간 테스트: 2019–2025년부터 H1 차트에서 백테스트를 거쳤습니다. 정밀 진입: 단기 하락 및 확인된 추세 신호로 인해 장기 거래가 촉발되었습니다. 스마트 위험 관리: 적응형 규모 조정을 위한 ATR 기반 손절매 및 이익 목표. 유연한 거래 시간: 일주일 내내 작동하며 세션 제한을 구성할 수 있습니다. 쉬운 통합: 브로커 제한 없음, MT4 에 최적화. 자동화된 규율로 추세 포착 극대화 – USDJPY에서 장기 전용 모멘텀 전략을 원하는 거래자에게 이상적입니다.
Market Structure CHoCH BOS
Mohammad Taher Halimi Tabrizi
5 (1)
Market Structure CHoCH/BOS Indicator for MT5 Overview The Market Structure CHoCH/BOS (Fractal) indicator identifies key shifts in market direction based on fractal-based structural analysis. It automatically detects Change of Character (CHoCH) and Break of Structure (BOS) signals, two essential concepts in modern price action and Smart Money trading. How It Works The indicator analyzes swing highs and lows using a fractal algorithm defined by the Length parameter. When price crosses a previous
ProEngulfing For MT5
Ashkan Hazegh Nikrou
ProEngulfing 무료 버전은 QualifiedEngulfing으로, 하루에 하나의 신호로 제한되며 기능이 적습니다. 모든 Koala 제품에 대한 최신 정보를 확인하려면 mql5 커뮤니티에서 Koala Trading Solution 채널에 가입하세요. 가입 링크는 아래와 같습니다: https ://www .mql5 .com /en /channels /koalatradingsolution 이 제품의 MT4 버전은 아래 링크에서 다운로드 가능합니다: https ://www .mql5 .com /en /market /product /52023 ProEngulfing 소개 – MT4용 전문가 수준의 Engulf 패턴 지표 정확성을 극대화한 ProEngulfing을 소개합니다. 이 최신 지표는 포렉스 시장에서 신뢰할 수 있는 Engulf 패턴을 식별하고 강조하는 데 중점을 둔 제품입니다. MetaTrader 4에 맞게 개발된 ProEngulfing은 신뢰도 높은 신호를 제공하기 위해
Trend Reversal Scanner MT5
Reza Aghajanpour
5 (8)
**   All Symbols   x   All Timeframes   scan just by pressing scanner button ** Discount: The price is $50$, But now it is just $39, Limited time offer is active. *** Contact me  to send you instruction and add you in "Trend Reversal group" for sharing or seeing experiences with other users. Introduction: Trendlines are the most famous technical analysis in trading . Trendlines continually form on the charts of markets across all the different timeframes providing huge opportunities for traders
이 제품의 구매자들이 또한 구매함
ARIPoint
Temirlan Kdyrkhan
ARIPoint is a powerful trading companion designed to generate high-probability entry signals with dynamic TP/SL/DP levels based on volatility. Built-in performance tracking shows win/loss stats, PP1/PP2 hits, and success rates all updated live. Key Features: Buy/Sell signals with adaptive volatility bands Real-time TP/SL/DP levels based on ATR Built-in MA Filter with optional ATR/StdDev volatility Performance stats panel (Success, Profit/Loss, PP1/PP2) Alerts via popup, sound, push, or email Cu
OmniSync Projection
Antonio-alin Teculescu
5 (1)
Chronos Fractal Engine is an innovative price projection indicator for MetaTrader 5, designed to transform your technical analysis by intelligently identifying and projecting historical price patterns. Built upon an advanced correlation algorithm and the fractal principles of the market, this powerful tool visualizes potential future price movements, giving you a unique edge in your trading decisions. What is Chronos Fractal Engine? At its core, the Chronos Fractal Engine employs a sophisticat
ARICoins
Temirlan Kdyrkhan
ARICoin is a powerful trading companion designed to generate high-probability entry signals with dynamic TP/SL/DP levels based on volatility. Built-in performance tracking shows win/loss stats, PP1/PP2 hits, and success rates all updated live. Key Features: Buy/Sell signals with adaptive volatility bands Real-time TP/SL/DP levels based on ATR Built-in MA Filter with optional ATR/StdDev volatility Performance stats panel (Success, Profit/Loss, PP1/PP2) Alerts via popup, sound, push, or email Cust
CGE Trading Suite
Carl Gustav Johan Ekstrom
5 (2)
Institutional-Grade Analytics for MT5 C GE Trading Suite delivers the analytical edge typically reserved for professional trading desks. The platform integrates a full suite of analytical tools into one seamless workflow: dynamic grid mapping, liquidity behavior analysis, ECM, trend lines, MIDAS, trade cycles, and directional channel projections. Together, these provide a unified view of market structure and momentum. Directional clarity is further enhanced by the capital flow index, which meas
AriX
Temirlan Kdyrkhan
1 (4)
AriX Indicator for MT5 A powerful trend-following and signal-evaluation tool AriX is a custom MT5 indicator that combines Moving Averages and ATR-based risk/reward logic to generate clear buy/sell signals. It visualizes dynamic SL/TP levels, evaluates past trade outcomes, and displays win/loss statistics in a clean on-chart panel. Key features include: Buy/Sell signals based on MA crossovers ATR-based SL/TP1/TP2/TP3 levels with visual lines and labels Signal outcome tracking with real-time stat
IVISTscalp5
Vadym Zhukovskyi
5 (6)
iVISTscalp5 — 시간 기반 시장 예측 시스템 iVISTscalp5는 일반적인 지표가 아닙니다. MetaTrader 5용 시간 기반 예측 시스템으로, 시장이 언제 움직일 가능성이 높은지를 보여줍니다. ⸻ 기능  • 정확한 타이밍  • BUY / SELL 신호  • 평균 수익 잠재력  • 주간 예측  • 120개 이상의 자산 ⸻ 핵심 개념 시장은 가격뿐만 아니라 시간에 의해 움직인다 ⸻ iVISTscalp5 — 시간에서의 우위 당신에게 소개하는 iVISTscalp5 지표는 독특하면서도 거래 작업에서 효과적입니다. 이 지표는 시간 데이터를 기반으로 하며 금융 시장의 많은 경험과 깊은 분석의 결과입니다. iVISTscalp5 지표는 수동 거래에 뛰어난 도구입니다. 편리성, 간단함 및 시각화 - 모든 복잡성은 숨겨져 있습니다. 우리는 iVISTscalp5 지표의 설정과 사용을 최대한 단순화했습니다. 이 지표는 MT5 터미널에서 가지고 있는 모든 금융 상품에 적합
ZIVA Signal Intelligence
Hassan Abdullah Hassan Al Balushi
ZIVA Signal Intelligence An Adaptive, Modular Market Intelligence System ZIVA Signal Intelligence is not positioned as a conventional trading indicator. It is a fully integrated, proprietary market intelligence system engineered to deliver structured, high-precision interpretation of price behavior within a controlled analytical environment. Developed through an independent architectural approach, ZIVA does not rely on, derive from, or replicate existing indicators. It represents a standalone
TrendMaestro5
Stefano Frisetti
note: this indicator is for METATRADER4, if you want the version for METATRADER5 this is the link:  https://www.mql5.com/it/market/product/108106 TRENDMAESTRO ver 2.5 TRENDMAESTRO recognizes a new TREND from the start, he never makes mistakes. The certainty of identifying a new TREND is priceless. DESCRIPTION TRENDMAESTRO identifies a new TREND in the bud, this indicator examines the volatility, volumes and momentum to identify the moment in which there is an explosion of one or more of these da
Premium level Pro
Dmitriy Kashevich
Premium level is a unique indicator with more than 80% accuracy of correct predictions! This indicator has been tested for more than two months by the best Trading Specialists! The author's indicator you will not find anywhere else! From the screenshots you can see for yourself the accuracy of this tool! 1 is great for trading binary options with an expiration time of 1 candle. 2 works on all currency pairs, stocks, commodities, cryptocurrencies Instructions: As soon as the red arrow app
ARIScalping
Temirlan Kdyrkhan
ARIScalp is a powerful trading companion designed to generate high-probability entry signals with dynamic TP/SL/DP levels based on volatility. Built-in performance tracking shows win/loss stats, PP1/PP2 hits, and success rates all updated live. Key Features: Buy/Sell signals with adaptive volatility bands Real-time TP/SL/DP levels based on ATR Built-in MA Filter with optional ATR/StdDev volatility Performance stats panel (Success, Profit/Loss, PP1/PP2) Alerts via popup, sound, push, or email Cus
Rtc ML Ai Predictor
Muhammad Faisal Sagala
Rtc ML Ai | Predictor CORE MACHINE LEARNING ENGINE Adaptive ML Market Predictor – Multi-Bar Trend & Candle Forecast What This Indicator Does This indicator is a  real-time market prediction engine  designed to analyze price behavior and estimate  future market tendencies . Unlike conventional indicators, this system  does not rely on static parameters or historical curve-fitting , but adapts its internal state dynamically during live market operation. Instead of using static rules, the indic
SunSignal ML — AI Gold Signals with Multi-Timeframe Confluence SunSignal ML is an advanced AI-powered signal indicator purpose-built for XAUUSD gold trading. It combines a proprietary adaptive trend algorithm with six machine learning models trained on confirmed price pivots to produce high-confidence entry signals with multi-timeframe validation. The indicator runs efficiently on M1, M5 and M15 timeframes and is designed for traders who want precision entries guided by data rather than guesswor
Gold Xausd Hunter
Metin Erkamoglu
MATADOR GOLD — XAUUSD M5 ( TimeFrame M5 ) Scalp Signals for MT5 Strategy Tester Visualization Video https://youtu.be/_cWbbyg2RSs Not every move deserves a signal. MATADOR GOLD was built for traders who prefer selective, structured, high-quality decision support over noisy, hyperactive signal tools. Designed specifically for Gold (XAUUSD / GOLD) on M5 , MATADOR helps you read short-term momentum with more discipline by combining trend logic, market-condition filters, momentum timing, spread pro
VTrende Pro
Andrii Diachenko
5 (1)
VTrende Pro - MTF indicator for trend trading with a display panel for MT5 *** Videos can be translated into any language using subtitles (video language - Russian) Although the signals of the VTrende Pro indicator can be used as signals of a full-fledged trading system, it is recommended to use them in conjunction with the Bill Williams TS. VTrende Pro is an extended version of the VTrende indicator. Difference between Pro version and VTrende: - Time zones - Signal V - signal 1-2 waves -    S
Max Ribbon Mt5
Stefano Frisetti
WARNING: This indicator is distributed EXCLUSIVELY on MQL5.com MT4 version:   https://www.mql5.com/it/market/product/160363 MT5 version:   https://www.mql5.com/it/market/product/160410 MAX RIBBON ver 1.00 The indicator that shows you the TREND clearly and unambiguously! DESCRIPTION MAX RIBBON is an advanced trend indicator that combines two ribbon systems to accurately identify market direction: • MaxRib2 (Fast Ribbon): Responsive to short-term movements, ideal for capturing rapid reversals and
이 위치가 매수에 적합한지 판단하는 데 도움을 줍니다. 이 위치가 매도에 적합한지 판단하는 데 도움을 줍니다. 네 개의 지표가 동시에 바닥에 도달하면 반등 기회를 중점적으로 살펴보시기 바랍니다. 네 개의 지표가 동시에 상단에 위치하면 하락 기회를 중점적으로 살펴보시기 바랍니다. 이 시스템은 중국의 첨단 알고리즘 기술과 고급 수학 모델링 체계를 기반으로 구축되었습니다. 저는 주로 XAUUSD M5 주기에서 이 지표를 사용하며, 이 주기가 가장 좋은 결과를 보여줍니다. 이 지표의 알고리즘과 수학 공식은 매우 복잡하기 때문에 테스트 시 진행 속도가 느릴 수 있습니다. 테스트할 때는 지표가 리페인트되는지, 지연되는지만 확인하시면 됩니다. 정식 버전은 실제 사용 시 더 안정적입니다. 이 지표 시스템은 절대 리페인트하지 않으며 미래 데이터를 사용하지 않습니다. 구매 전에 직접 테스트하고 확인하실 수 있습니다. 이 지표에는 완전히 개인화된 알림 시스템이 포함되어 있으며, 아래 링크를 통해 확인하
Triple Crox Strategy
issam rahhal sabour
*** ### **Triple Crox Strategy - Professional Trading System** **Overview** The Triple Crox Strategy is an advanced technical indicator for MetaTrader 5, designed for serious traders. It synthesizes multiple analysis methodologies—including moving averages, Average True Range (ATR), Relative Strength Index (RSI), and cloud configurations—to generate highly reliable and precise trading signals. **Core Configuration** **Setup Types** *   **Setup Open/Close:** Utilizes Heikin Ashi can
Red and Green Light – Intelligent Trading Signal Indicator Product Overview Red and Green Light is a professional trading signal indicator based on the multi-stage T3 smoothing algorithm. It integrates a visual traffic light system, intelligent signal recognition, risk alerts, and multiple notification features. Whether you're a manual trader or an Expert Advisor (EA) developer, this indicator helps you capture market opportunities with greater precision and effectively avoid the risks of
Big Player Range
Thalles Nascimento De Carvalho
5 (3)
BigPlayerRange – MT5 최고의 지표 BigPlayerRange 는 MetaTrader 5에서 미니 인덱스와 미니 달러를 위한 최고의 지표 로 평가받고 있습니다. 이 도구는 주요 기관 투자자들의 전략적 영역을 강조하여 높은 정확도의 기관 기술 분석을 제공합니다. BigPlayerRange 사용법: 이 지표는 매수 구간(녹색선)과 매도 구간(빨간선)을 표시합니다. 가격이 이 구간 밖에서 마감되면 추세 움직임이 예상됩니다. 녹색선 위에서 마감: 강한 매수세와 상승 추세 가능성. 빨간선 아래에서 마감: 매도 압력과 하락 가능성. 범위 내에서 마감: 횡보 시장, 돌파 신호 대기. 주요 혜택: 기관 투자자 영역 매핑: 주요 투자자들의 활동 구간을 식별합니다. 자동 목표 지점 산출: 거래 종료에 적합한 목표 지점을 제공합니다. 풀백 분석: 리스크 관리를 위한 가격 반등 가능성 평가. 활용 방법: BigPlayerRange와 함께 Imba
Jita Indicator Pro
Jimmy Mwaba
1 (1)
Jita Indicator Pro MT5 | All Timeframes Professional Trend Agreement System – Premium Edition ($500) What Is Jita Indicator Pro? Jita Indicator Pro is a structured trend-confirmation system designed for serious traders who value precision, alignment, and controlled signal behavior. It combines: Advanced band-based trend direction logic ATR-driven structural trigger engine Dual-confirmation agreement system Locked history update design This indicator prints signals only when multiple conditions
CDV Candle Engine Pro is a MetaTrader 5 indicator designed to visualize Cumulative Delta Volume (CDV) directly on the price chart. It helps traders read market pressure more clearly by showing the balance between buying and selling activity in a clean, customizable layout. If you trade on MetaTrader 4, the MT4 edition is available here:  CDV Candle Engine Pro MT4 Public channel:   CLICK HERE Main Features CDV candle visualization on the main chart for easy reading in real time. Optional subwind
Recommended TimeFrame >= H1. 100% Non Repainted at any moment.  Use it carefully, only with Trend Direction. Trading Usage: 2 Variants: as Range System or as BreakOut System (Both Only With Trend Direction)::: (Always use StopLoss for minimise Risk); [1] as Range System: (Recommended) in UP TREND:  - BUY in Blue Line , then if price goes down by 50 points (on H1) open Second BUY.   Close in any Profit you wish: TrailingStop(45 points) or Close when Price touches upper Gold Line. in DOWN TREND
FXLAND Smart Reversal Indicator (MT5) FXLAND Smart Reversal Indicator is a professional technical analysis tool designed to help traders identify potential price reversal zones and key market turning points with clarity and precision. The best reversal indicator and price return by choosing only one ceiling or floor in each time frame A masterpiece of combining mathematics and Gann, fractal matrix, Fibonacci, movement angle and time. Completely intelligent Key Features Detects potenti
Piranha version 2
Maria Strudov
5 (1)
"Piranha" - an autonomous trading system that determines overbought and oversold levels on the chart. Red and blue zones represent overbought and oversold levels respectively. Entry points are marked with arrows: a downward arrow in the red zone for "sell" and an upward arrow in the blue zone for "buy". The Take profit level is indicated by the green moving average. Key features: Adjusting the Take profit level as the green moving average changes position. Averaging ability when a new market e
Pantera Indicator
Temirlan Kdyrkhan
5 (1)
A tool for on-chart strategy backtesting and performance analysis. A utility for developing, debugging, and testing custom trading ideas and indicator functions. An indicator designed to quickly test trading concepts and visualize the effectiveness of different input parameters. An all-in-one sandbox for testing everything from simple crossovers to complex, multi-condition trading systems.
WanaScalper
Isaac Wanasolo
1 (1)
A scalping indicator based on mathematical patterns, which on average gives signals with relatively small SL, and also occasionally helps to catch big moves in the markets (more information in the video) This indicator has three main types of notifications: The first type warns of a possible/upcoming signal on the next bar The second type indicates the presence of a ready signal to enter the market/open a position The third type is for SL and TP levels - you will be notified every time price re
Pan PrizMA CD Phase
Aleksey Panfilov
The Expert Advisor and the video are attached in the Discussion tab . The robot applies only one order and strictly follows the signals to evaluate the indicator efficiency. Pan PrizMA CD Phase is an option based on the Pan PrizMA indicator. Details (in Russian). Averaging by a quadric-quartic polynomial increases the smoothness of lines, adds momentum and rhythm. Extrapolation by the sinusoid function near a constant allows adjusting the delay or lead of signals. The value of the phase - wave s
Классификатор силы тренда. Показания на истории не меняет. Изменяется классификация только незакрытого бара. По идее подобен полной системе ASCTrend, сигнальный модуль которой, точнее его аппроксимация в несколько "урезанном" виде, есть в свободном доступе, а также в терминале как сигнальный индикатор SilverTrend . Точной копией системы ASCTrend не является. Работает на всех инструментах и всех временных диапазонах. Индикатор использует несколько некоррелируемых между собой алгоритмов для класси
FFx Universal Strength Meter PRO is more than a basic strength meter. Instead of limiting the calculation to price, it can be based on any of the 19 integrated strength modes + 9 timeframes. With the FFx USM, you are able to define any period for any combination of timeframes. For example, you can set the dashboard for the last 10 candles for M15-H1-H4… Full flexibility! Very easy to interpret... It gives a great idea about which currency is weak and which is strong, so you can find the best pai
The FFx Universal MTF alerter shows on a single chart all the timeframes (M1 to Monthly) with their own status for the chosen indicator. 9 indicators mode (MACD-RSI-Stochastic-MA-ADX-Ichimoku-Candles-CCI-PSAR). Each can be applied multiple times on the same chart with different settings. Very easy to interpret. Confirm your BUY entries when most of the timeframes are showing green color. And confirm your SELL entries when most of the timeframes are showing red color. 2 Alert Options : input to s
필터:
리뷰 없음
리뷰 답변