KT Support and Resistance Levels MT5
- 지표
-
KEENBASE SOFTWARE SOLUTIONS
 Keenbase Trading은 트레이더가 더욱 정확하고 신뢰할 수 있는 거래 결정을 내릴 수 있도록 MetaTrader 4 및 MetaTrader 5용 전문 지표와 Expert Advisor(EA)를 개발합니다.
당사의 제품은 실전에서 활용할 수 있는 거래 로직과 직관적인 사용자 경험을 결합하여 안정성, 사용 편의성, 그리고 체계적인 리스크 관리에 중점을 두고 설계되었습니다. 모든 도구는 철저한 테스트를 거쳐 실제 시장 환경에서도 일관되고 안정적인 성능을 제공할 수 있도록 개발됩니다. - 버전: 3.0
- 업데이트됨: 31 5월 2026
- 활성화: 10
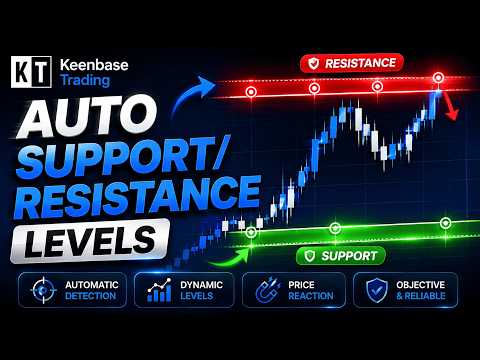
KT Auto Support Resistance Levels: MetaTrader 4/5용 멀티 타임프레임 S&R, Smart Zones 및 레벨 대시보드
스윙 고점. 피벗. 오더블록. 이전 고점과 저점. 트레이더마다 시장을 표시하는 방식은 조금씩 다르고, 그 대가는 결국 차트가 치르게 됩니다. 한 화면에 너무 많은 방법을 쌓아 올리면 차트는 더 이상 지도가 아닙니다. 그냥 소음이 됩니다.
KT Auto Support Resistance Levels는 이 문제를 해결합니다. 월간, 주간, 일간, 그리고 현재 타임프레임을 동시에 스캔한 뒤, 실제로 중요한 레벨을 MetaTrader 차트 위에 자동으로 그려 줍니다. 차트가 복잡해지면 한 번의 클릭으로 모든 레벨을 깔끔한 Smart Zones로 병합할 수 있습니다. 또한 실시간 패널이 항상 현재 가격 위와 아래의 가장 가까운 레벨을 보여 주기 때문에, 차트에서 계속 찾아다닐 필요가 없습니다.
지치지 않고 계속해서 중요 레벨을 표시해 주는 차트 분석가라고 생각하시면 됩니다.
이 도구가 해 주는 일
- 스윙, 피벗, 이전 기간 가격, 오더블록 중간값 등 검증된 여러 소스에서 다양한 타임프레임의 레벨을 찾아 자동으로 표시합니다.
- 더 단순한 차트를 원할 때 서로 가까운 레벨을 깔끔한 Smart Zones로 병합합니다.
- 현재 가격 위의 가장 가까운 3개 레벨과 아래의 가장 가까운 3개 레벨을 실시간 패널에 표시합니다.
- 각 레벨이 얼마나 오래되었는지, 그리고 과거에 가격이 실제로 얼마나 자주 그 레벨을 존중했는지 보여 줍니다.
- 가격이 사용자가 중요하게 보는 레벨이나 존에 도달하는 순간 알림을 보냅니다.
의도적으로 하지 않는 일
이 도구는 거래를 열거나, 닫거나, 관리하지 않습니다. 매수 또는 매도 신호를 발생시키지 않습니다. 시장을 예측한다고 주장하지 않으며, 반전을 약속하지도 않습니다.
이것은 한계가 아닙니다. 레벨은 의사결정을 위한 구역이지, 미래를 보여 주는 수정구슬이 아닙니다. 이 도구는 그 점을 솔직하게 다룹니다. 트레이딩 계획과 리스크 관리는 여전히 사용자의 몫이며, 이런 도구는 원래 그렇게 작동해야 합니다.
다섯 가지 레벨, 하나의 깔끔한 시장 지도
각 소스는 시장에 대해 조금씩 다른 질문에 답합니다. 이 인디케이터는 그 모든 레벨을 자동으로 그려 줍니다. 외부 ZigZag, 프랙탈 또는 피벗 인디케이터가 필요하지 않습니다.
스윙 고점과 저점: 대부분의 트레이더가 직접 손으로 표시하는 실제 가격 전환 지점을 자동으로 표시합니다.
피벗: Daily P, Daily R1, Weekly R2 같은 라벨로 표시되는 클래식 일간, 주간, 월간 피벗 레벨입니다. Classic 방식은 기본으로 켜져 있으며, Camarilla, Woodie, Fibonacci, DeMark 방식도 한 번의 클릭으로 선택할 수 있습니다.
이전 기간 가격: 전일, 전주, 전월의 고가, 저가, 시가, 종가(PDH, PWL, PMC 등)를 표시합니다. 가격은 많은 트레이더가 예상하는 것보다 훨씬 자주 이런 레벨로 되돌아옵니다.
오더블록 레벨: 의미 있는 오더블록 캔들의 중간값에 Daily Bull OB 또는 Weekly Bear OB 같은 라벨이 붙은 깔끔한 선을 표시합니다. 음영 박스가 아니라 기준 가격으로 표시되기 때문에 차트가 읽기 쉽게 유지됩니다.
프랙탈 레벨: 현재 타임프레임에서 의미 있는 프랙탈 전환 지점을 찾아냅니다. 모든 작은 피벗을 차트에 채워 넣는 대신, 실제로 무게가 있는 지점만 골라 표시합니다.
레벨의 무게를 한눈에 확인
타임프레임이 클수록 레벨의 중요도도 커집니다. 대부분의 경우 이것만 기억해도 충분합니다.
월간 레벨은 Super Strong으로, 시장 전체가 주목하는 무게감 있는 가격대입니다. 주간 레벨은 Strong으로, 한 주와 그 이후의 시장 구조를 잡아 줍니다. 일간 레벨은 Moderate로, 인트라데이와 스윙 트레이딩에서 신뢰할 수 있는 기준이 됩니다. 현재 타임프레임 레벨은 Short-Term으로, 가장 반응이 빠르고 실시간 가격에 가장 가까운 경우가 많습니다.
낮은 타임프레임의 레벨은 높은 타임프레임 차트에서 자동으로 숨겨지기 때문에, 월간 차트가 세부 정보에 묻히지 않고 차분하게 유지됩니다. 월간 레벨은 충분히 중요하기 때문에 모든 차트에 표시됩니다.
Smart Zones: 복잡한 차트에서 명확한 화면으로
이 부분은 꼭 이해할 가치가 있습니다. 차트 전체의 느낌을 바꿔 주기 때문입니다. 사용자는 항상 같은 시장 구조를 보고 있지만, 두 가지 보기 방식 중 하나를 선택해 보는 것입니다.
Levels 보기에서는 각 레벨이 개별 선으로 표시됩니다. 차트를 자세히 분석하고 각 가격이 정확히 어디에 있는지 보고 싶을 때 적합합니다.
Smart Zones 보기에서는 인디케이터가 모든 개별 레벨을 읽고, 여러 레벨이 서로 가까이 모여 있는 위치를 찾아 하나의 깔끔한 밴드로 표시합니다. 각 존은 타임프레임, 방식, 그리고 과거 가격 반응을 기준으로 가중치를 부여받고, 가장 강하고 관련성이 높은 존만 남습니다. 차트가 복잡하게 느껴질 때 이 전환 버튼이 다시 차트를 차분하게 만들어 줍니다.
각 Smart Zone은 짧은 한 줄 안에 전체 정보를 담습니다. 예:
Weekly R1 (4 levels) | 11 months | Chance of reversal 80%
왼쪽에서 오른쪽으로 읽으면, 이것은 Weekly R1 가격을 기준으로 한 저항 존이며, 가까이 모인 4개의 레벨로 구성되어 있고, 약 11개월 된 존이며, 과거 테스트에서 가격이 약 80%의 경우 이곳에서 되돌아섰다는 뜻입니다. 한눈에 많은 배경 정보를 얻을 수 있습니다.
그리고 이 존들은 안정적으로 유지됩니다. 차트가 다시 계산될 때마다 흔들리거나 튀지 않지만, 시장 구조가 실제로 바뀌면 다시 그려집니다. 그래서 어떤 존이 움직인다면, 실제로 중요한 변화가 생겼다는 의미로 볼 수 있습니다.
전환은 즉시 이루어집니다. 대시보드의 Levels와 Smart Zones 두 버튼으로 선택할 수 있으며, 선택한 모드는 열려 있는 모든 차트에 동기화됩니다.
대시보드: 필요한 모든 레벨을 한눈에
구석의 어두운 패널은 이 도구의 빠른 보기 화면이며, 많은 트레이더에게 가장 자주 사용하는 부분이 됩니다. 이 패널은 언제든 한 가지 질문에 답해 줍니다. 지금 가격 주변에서 가장 가까운 레벨은 어디인가?
위에서 아래로 읽으면 됩니다. 위쪽에는 가격 위의 가장 가까운 3개 레벨이 표시되며, R1이 가격에 가장 가깝습니다. 가운데에는 실시간 가격이 있습니다. 아래쪽에는 가격 아래의 가장 가까운 3개 레벨이 표시되며, S1이 가격에 가장 가깝습니다. 선을 그릴 필요도, 차트를 스크롤할 필요도, 다시 확인할 필요도 없습니다.
각 행에는 네 가지 빠른 정보가 표시됩니다:
- Level: 해당 가격 레벨과 그 출처입니다.
- Distance: 가격이 그 레벨에 도달하려면 얼마나 더 움직여야 하는지입니다.
- Source: 해당 레벨이 어떤 방식에서 나왔는지 보여 주므로, 사용자가 무엇을 보고 있는지 항상 알 수 있습니다.
- Reversal chance: 과거에 가격이 그곳에서 얼마나 자주 유지되었는지, 또는 아직 테스트되지 않았다면 Fresh로 표시됩니다.
패널은 항상 차트와 동일하게 움직입니다. Levels 보기에서는 개별 선을 나열하고, Smart Zones 보기에서는 존을 나열합니다. 또한 Levels와 Smart Zones 버튼이 바로 이곳에 있기 때문에, 이 구석이 두 보기 방식을 전환하는 가장 빠른 위치입니다.
각 레벨이 실제로 어떻게 반응했는지 확인
대부분의 인디케이터는 레벨만 그려 놓고, 그 중요도는 사용자가 추측하게 만듭니다. 이 인디케이터는 다릅니다. 내부적으로 가격이 레벨을 만날 때마다 세 가지를 관찰합니다. 터치(가격이 되돌아와 레벨에 도달), 홀드(가격이 레벨에 도달한 뒤 되돌림), 브레이크(가격이 레벨을 그대로 통과)입니다.
이를 바탕으로 레벨과 존에 두 가지 간단한 정보가 표시됩니다.
Reversal chance는 레벨이 터치된 전체 횟수 중에서 얼마나 자주 유지되었는지를 퍼센트로 보여 줍니다. 숫자가 높을수록 과거에 가격이 그 레벨을 더 자주 존중했다는 의미입니다.
Fresh는 스캔된 히스토리 안에서 해당 레벨이 아직 테스트되지 않았다는 뜻입니다. Fresh를 약한 레벨로 해석하지 마십시오. 아직 테스트되지 않은 레벨은 시장이 그 가격을 충분히 거래해 보지 않았기 때문에 오히려 강하게 반응할 수 있습니다.
그와 함께 age는 레벨이 얼마나 오래 유지되었는지를 보여 줍니다. 예를 들어 11개월처럼 표시됩니다. 몇 달 동안 유지된 레벨은 어제 형성된 레벨보다 더 주목할 가치가 있는 경우가 많습니다.
분명히 알아둘 점: reversal chance는 과거를 설명하는 값이지 미래를 보장하는 값이 아닙니다. 80%로 표시된 레벨도 다음 터치에서 바로 돌파될 수 있습니다. 약속이 아니라 판단에 도움을 주는 참고 정보로 사용하십시오.
어디에 있든 도달하는 알림
차트를 계속 바라보고 있을 필요는 없습니다. 가격이 사용자가 중요하게 보는 레벨에 도달하는 순간, Smart Zone의 기준선까지 포함해 인디케이터가 알려 줄 수 있습니다. 새 봉마다 한 번씩 확인하므로, 계속 울리는 소음이 아니라 깔끔한 신호를 받을 수 있습니다.
작업 방식에 맞게 선택하면 됩니다. 터미널 사운드, 화면 팝업, 이메일 알림, 또는 MetaTrader 모바일 앱의 푸시 알림을 사용할 수 있습니다. 이메일과 푸시는 한 번만 설정하면 그 이후에는 그대로 작동합니다.
바로 사용할 수 있고, 필요하면 자유롭게 조정 가능
설정을 하나도 건드리지 않아도 이 인디케이터를 충분히 사용할 수 있습니다. 기본값은 일상적인 트레이딩에 맞게 선택되어 있습니다. 본인 스타일에 맞게 조정하고 싶을 때는 모든 옵션이 Inputs 탭에 번호가 매겨진 그룹으로 정리되어 있어 찾기 쉽습니다.
차트를 자세히 분석할 때는 Label Detail을 Full로, 일반적인 사용에는 Compact로, 선만 보고 싶을 때는 Minimal로 설정할 수 있습니다. 피벗 방식을 바꾸고, 원하는 레벨 소스를 켜거나 끄고, 밝은 차트와 어두운 차트에 맞는 색상을 조정하고, 시작 보기를 Levels 또는 Smart Zones 중에서 선택할 수 있습니다. 차트가 너무 복잡해 보이나요? 빠른 해결 방법은 세 가지입니다. 라벨을 Minimal로 설정하고, Smart Zones를 켜거나, 사용하지 않는 소스를 끄면 됩니다.
일상적으로 사용하는 간단한 방법
이 도구를 사용하는 유일한 정답은 없습니다. 하지만 처음 시작한다면 아래의 간단한 루틴이 좋으며, 몇 초밖에 걸리지 않습니다.
자신의 거래 타임프레임을 열고 대시보드를 확인합니다. 이제 아무것도 직접 그리지 않아도 가장 가까운 지지와 저항을 알 수 있습니다. 그다음 age와 reversal chance를 확인합니다. 더 오래되고 가격이 더 자주 존중했던 레벨일수록 계획을 세우는 기준으로 삼기 좋기 때문입니다. 차트가 복잡해 보이면 Smart Zones로 전환해 시각적 소음을 줄입니다. 그 레벨을 기준으로 진입, 손절, 목표를 계획한 뒤, 최종 결정은 자신의 규칙과 리스크 관리에 맡기십시오.
이것이 이 도구의 핵심입니다. 차트를 정리하고 중요한 레벨을 대신 지켜보게 하여, 사용자의 집중력을 정말 필요한 부분인 트레이딩 결정에 남겨 둡니다.


Yes we know that prices react at important levels.And this tool help me to mark them in the right way