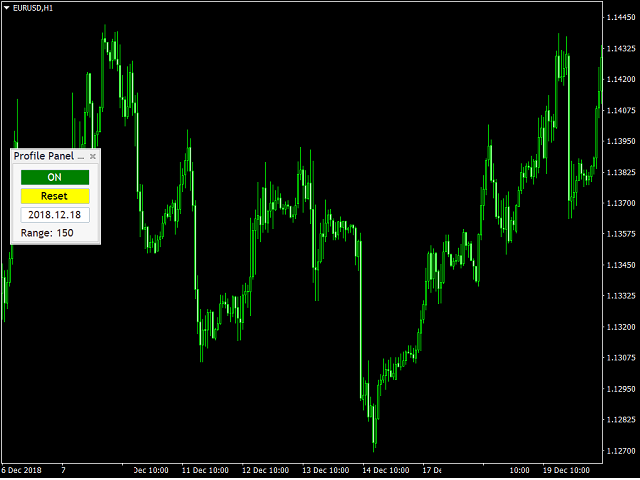
Profile Map MT5
- 지표
- 버전: 1.35
- 업데이트됨: 29 1월 2019
- 활성화: 5

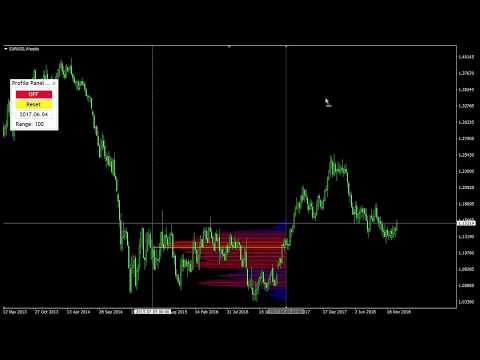
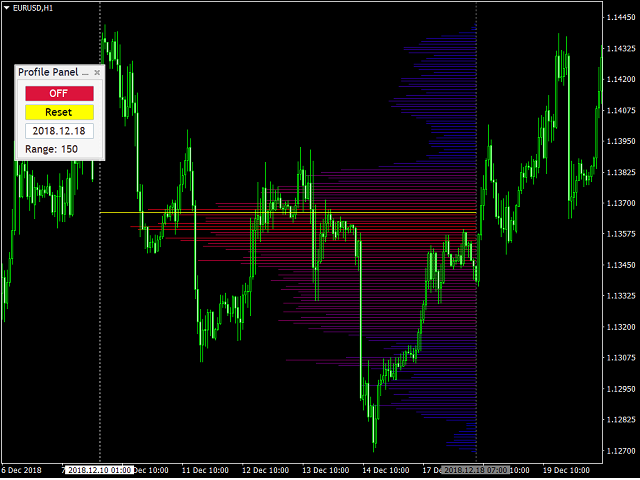
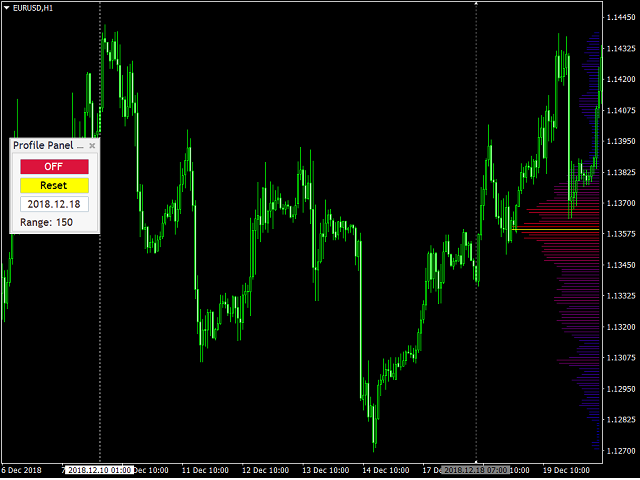
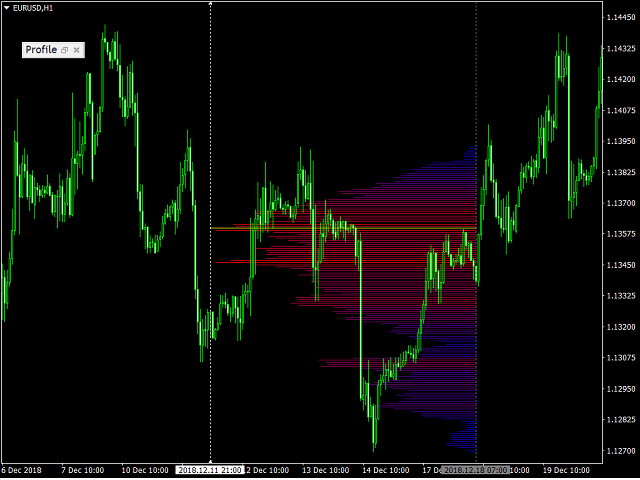
Market Profile helps the trader to identify the behavior if major market players and define zones of their interest. The key feature is the clear graphical display of the range of price action, in which 70% of the trades were performed. Understanding of the location of volume accumulation areas can help traders increase the probability of success. The tool can be used as an independent system as well as in combination with other indicators and trading systems.
this indicator is designed to suit the needs of all profile traders. It provides functionality and features to display the market profile on the required number of bars in history.
Feature Highlights
- Possibility to display the market profile on the required number of bars in history.
- Display of the profile for the required time period and control from the chart.
- Display of the required number of horizontal lines.
- Display of the profile at a convenient side.
- Graphical display of the profile in the form of a gradient, reflecting the strength of the levels.
- Color change of the profile and accumulation center.
- Point of control
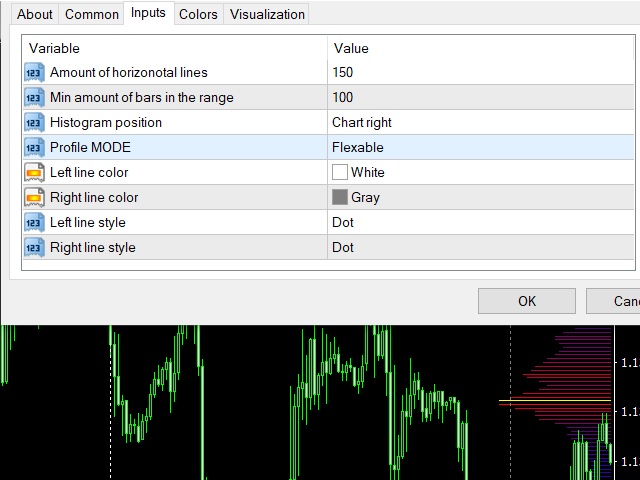
Inputs
- Volume type - tick or real
- Amount of lines - he number of horizontal lines in the profile
- Shift the right edge to the newest bar - shifting the right edge/line of the profile
- Shift the left edge if the right was shifted - shifting the left edge if the right one is shifted.
- Left edge style - the style for the left edge/line
- Right edge style - the style for the right edge/line
- Right edge color - the color for the right edge/line


Здравствуйте! В индикаторе не разбираюсь. Но на графике выглядит очень стильно профессионально и красиво, радует глаз. Купил и всем рекомендую...