Heiken Ashi Smoothed Alert MT5
- 지표
-
Jan Flodin
 Hello, my name is Jan and I have been developing automated trading tools for the last 9 years. I am originally from Sweden but have lived in the Czech Republic since 2003.
PRODUCTS - 버전: 1.0
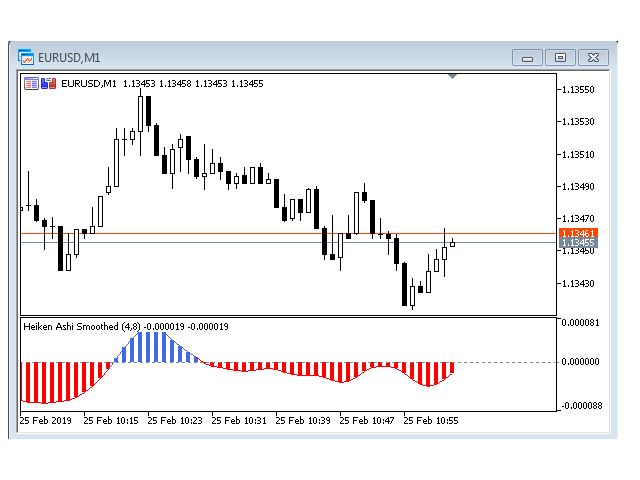
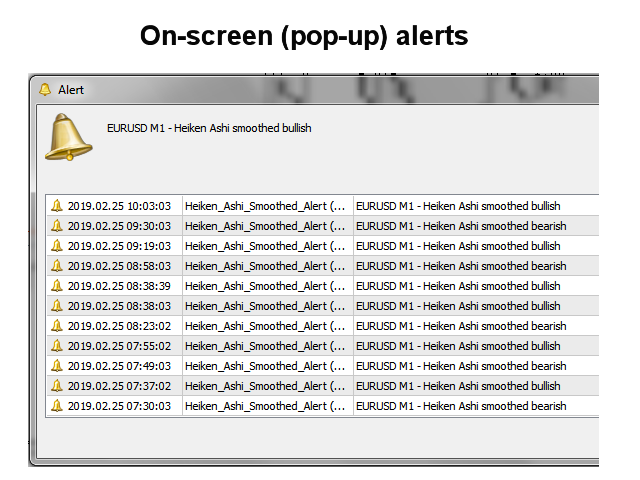
This indicator can send alerts when a Heiken Ashi Smoothed color change occurs. Combined with your own rules and techniques, this indicator will allow you to create (or enhance) your own powerful system.
Features
- Can send all types of alerts.
- Option to delay the alert one or more bars in order to confirm the color (trend) change.
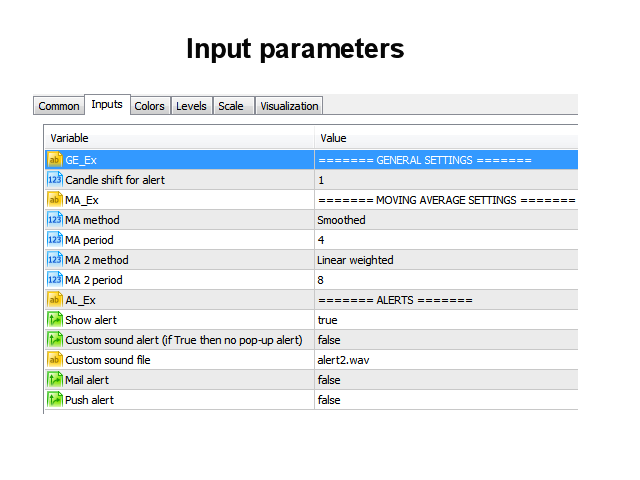
Input parameters
- Candle shift for alert: Default is 1. Setting it to 0 will alert you on color change on the current candle. This should be regarded as a pending (unconfirmed) signal.
- MA method: Default is Smoothed (SMMA).
- MA period: Default is 4.
- MA 2 method: Default is Linear Weighted (LWMA).
- MA 2 period: Default is 8.
- Alerts: Set to 'true' for each alert type you would like to receive.


thanks, that’s good! but i actually made the heikinashi_alert_mt5 myself using claude ai.