RSI Zone Memory Reactive

  • 지표
  • Joas Da Silva Veiga
    Joas Da Silva Veiga
    안녕하세요, 저는 브라질 출신입니다. 저의 필요와 데이 트레이딩 연구를 바탕으로 MT5용 도구와 지표를 혼자서 직접 개발하고 있습니다. MQL5에서는 아직 신규 사용자이며, 제가 직접 사용하고 개발한 도구와 지표를 공유하고 있습니다. 무료인 것도 있고 유료인 것도 있습니다. 제 유료 도구나 지표 중 하나를 구매해 주셔서 제 작업을 계속할 수 있도록 도와주신다면 매우 감사하겠으며, 더 많은 무료 도구를 이곳에 공개할 수 있을 것입니다. 감사합니다.
  • 버전: 1.0
  • 활성화: 5

RSI Indicator, RSI Signals, Buy Sell Signals, Trend Indicator, Momentum Indicator, Overbought Oversold, Reversal Indicator, Trading Signals, Forex Indicator, MT5 Indicator, Double Top, Double Bottom, Trend Filter, Technical Analysis, Trading Alerts


RSI Zone Memory Reactive – RSI Signals and Market Structure

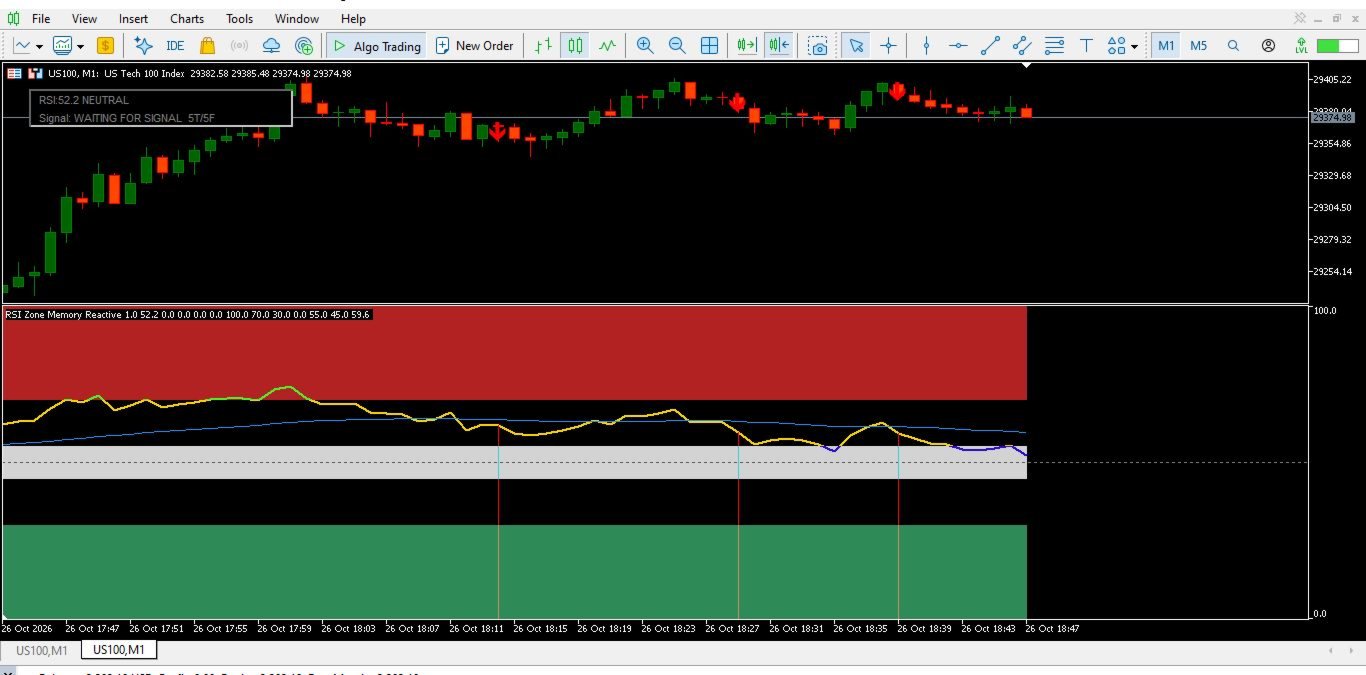
An RSI indicator for identifying momentum shifts, repeated RSI extremes, and potential reversal areas in MetaTrader 5.

Overview

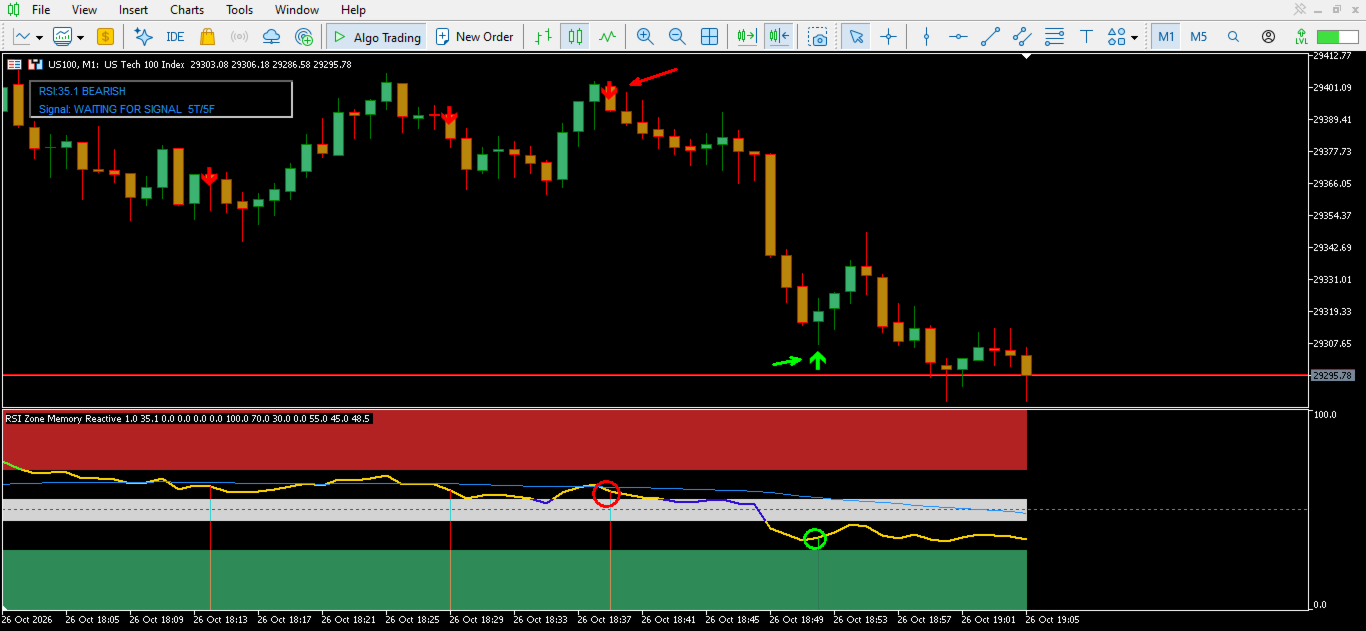
RSI Zone Memory Reactive is a technical analysis indicator for MetaTrader 5 that combines the Relative Strength Index (RSI), historical RSI extreme levels, momentum analysis, and a trend filter to help traders evaluate potential trading opportunities.

Instead of relying only on fixed overbought and oversold levels, the indicator stores selected RSI highs and lows and monitors when the RSI returns to previously recorded levels.

It displays RSI-based buy and sell signals, double-top and double-bottom patterns, momentum information, and a chart information panel.

Key Features

RSI Analysis

Uses a 21-period RSI with configurable overbought, oversold, and neutral-zone logic defined by the indicator.

RSI Memory System

Records selected RSI highs above 60 and lows below 40. The memory system compares new extremes with previously stored levels and maintains a configurable number of historical reference values.

Buy and Sell Signals

Identifies potential buy and sell setups when the RSI changes direction near a memorized extreme level. Signals are evaluated using the indicator's momentum and trend conditions.

Double-Top and Double-Bottom Detection

Identifies potential repeated RSI extremes, with additional conditions for stronger signals when the RSI reaches the overbought or oversold areas.

Momentum Analysis

Measures the RSI change over three bars to identify stronger upward or downward momentum.

Trend Filter

Uses a 50-period exponential moving average of the RSI to evaluate the direction of the oscillator and filter certain counter-trend signals.

Overbought, Oversold, and Neutral Zones

Displays the main RSI reference areas and identifies relatively compressed RSI movement within the neutral region.

Chart Signals and Alerts

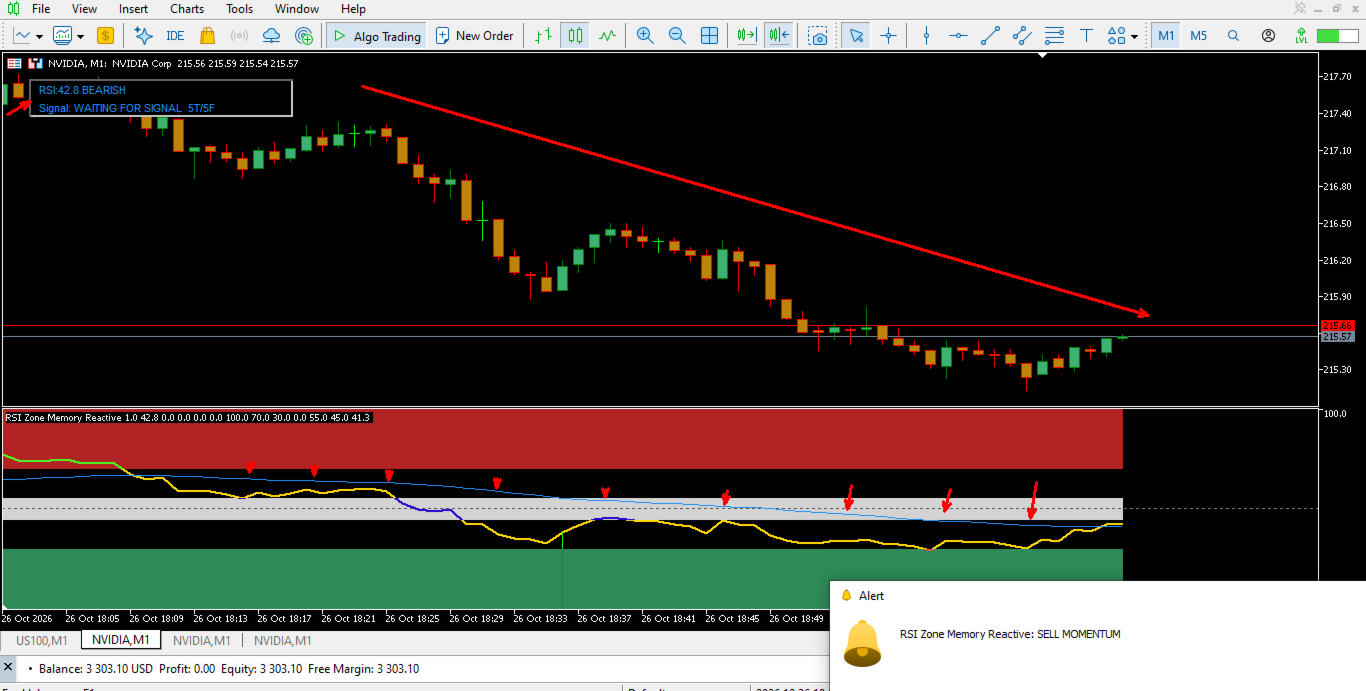
Displays buy and sell arrows on the main price chart and provides configurable alerts when qualifying signals are detected.

Information Panel

Shows the current RSI value, market status, signal information, and the number of stored tops and bottoms.

Customization

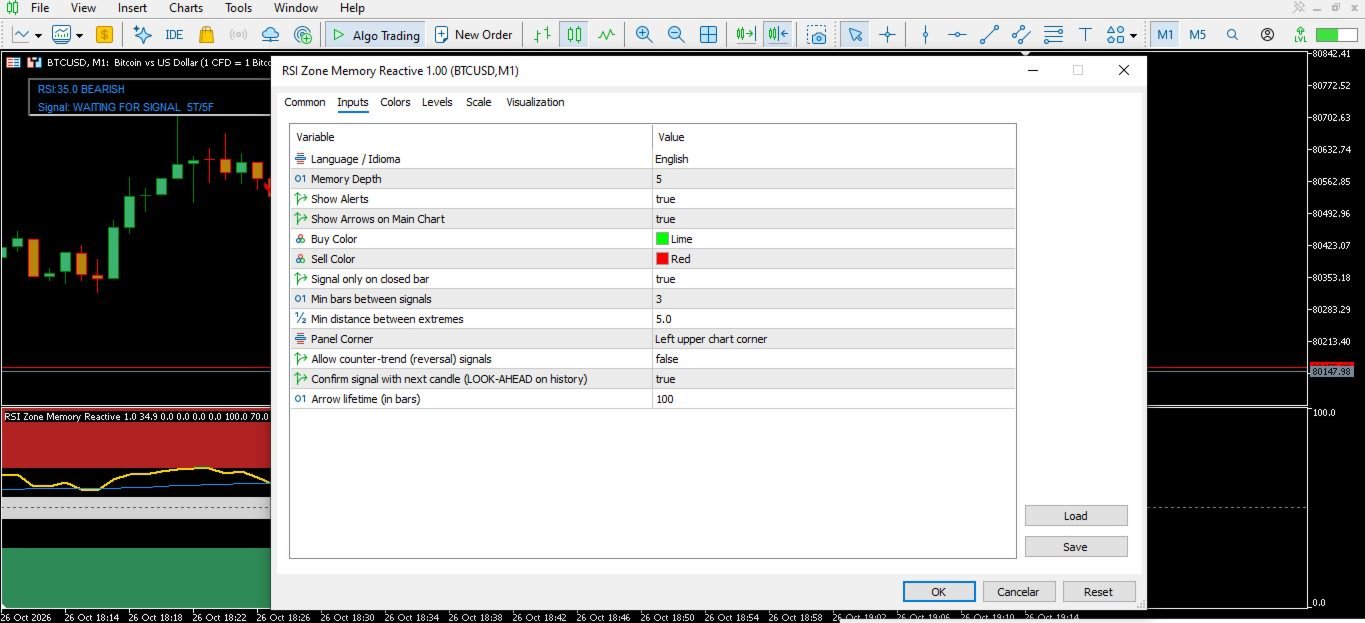
The indicator includes configurable settings for:

  • RSI memory depth.

  • Buy and sell signal colors.

  • Chart arrows.

  • Signal alerts.

  • Minimum bars between signals.

  • Minimum distance between recorded RSI extremes.

  • Counter-trend signal filtering.

  • Optional next-candle confirmation.

  • Arrow lifetime on the chart.

  • Information panel position.

  • English and Portuguese interface messages.

How It Works

The indicator evaluates RSI behavior in several stages.

First, it identifies local RSI highs and lows that meet its recording conditions. These values are stored as reference levels.

Next, it monitors the RSI for a return to a previously recorded level. Potential signals are evaluated using RSI direction, momentum, the trend filter, and the configured signal conditions.

When the required conditions are satisfied, the indicator can display a signal in its separate window, draw an arrow on the main chart, and issue an alert.

The memory system, momentum filter, and trend filter are designed to complement conventional RSI analysis rather than replace independent market analysis.

Who Is It For?

RSI Zone Memory Reactive is intended for traders who use technical analysis and want to study RSI extremes, momentum changes, repeated oscillator highs and lows, and potential reversal setups.

It can be used as an additional analytical tool alongside price action, support and resistance, and other technical indicators.

Important Information

RSI Zone Memory Reactive is an analytical indicator, not an automated trading robot. It does not execute trades or guarantee trading results.

Signals are technical conditions, not predictions of certain market movements. Market conditions can change, and signals may fail.

The optional next-candle confirmation uses subsequent candle data when evaluating historical signals. Historical signal placement should therefore be interpreted with this behavior in mind.

Always evaluate the indicator under your own trading conditions and apply appropriate risk management.

추천 제품
Session Indicator — Forex Trading Sessions Visualizer Overview Session Indicator   is a professional MT5 indicator that displays the four major forex trading sessions (Sydney, Tokyo, London, New York) as colored horizontal bands on your chart. Never miss a trading session again! Free Product   |   Works on Any Broker   |   Auto-Detects Timezone Features Auto-Detects Broker GMT Offset Works automatically on any MT5 broker (XM, IC Markets, FXCM, etc.) No manual timezone configuration needed Label
FREE
Market Sentry
Joas Da Silva Veiga
Market Analysis, Market Structure, Price Action, Trend Analysis, Bullish, Bearish, Range Market, Directional Bias, Market Dashboard, Trading Dashboard, Trend Detection, Market Scanner, Market Context, Breakout Analysis, Consolidation Analysis, Trend Filter, Technical Analysis, Real Time Analysis This indicator analyzes price behavior in real time and classifies market conditions into Bullish , Bearish , Range , and Neutral scenarios. Price is continuously evaluated relative to a dynamic referen
FREE
Fibrillar
Vitalii Zakharuk
It is very easy to use the Fibrillar indicator, since the simplest is to look at the chart and act according to the indications of the colored arrows. The algorithm takes into account the measurement of prices, and this method also focuses on measuring each of the price drops (H / C, H / O, LC, LO) - which gives more detailed information, but also more averaged. When calculating this indicator, logarithmic gains are first calculated at the closing price, which allows you to filter out the tren
This indicator was creating a perfect structure to not re-paint or recalculate, all signals are accurate. I can create a robotic version of this indicator but I need more precision in the signals. So appreciate this work. Tips to use when trading, do not buy at the top or sell at the bottom, always buy at the bottom  and sell at the top. Risk 1 to 3. In the settings you can adjust the size of the shadow or trail of the candle, you can change the colors and sizes of the arrows.
FREE
Otrx SMC
Fabio Rocha
Unlock the power of Smart Money Concepts (SMC) with precision and financial clarity. OTRX SMC is not just a technical indicator; it is a complete professional trading system designed for traders who follow institutional footprints. Unlike standard indicators that clutter your chart with noise, OTRX SMC focuses on the three pillars of Price Action: Structure (BOS) , Flow (FVG) , and Origin (OB) . The unique advantage of OTRX SMC is its Real-Time Risk Calculator . For every mapped structure or zon
Binary Signal Pro V2 Binary Signal Pro V2 is a MetaTrader 5 indicator designed to provide short-term Buy and Sell trading signals using multiple technical analysis filters. The indicator combines trend analysis, momentum confirmation, and volatility filtering to display visual entry signals directly on the chart. Main Features Buy and Sell signal arrows Multi-indicator confirmation system Trend and momentum analysis Volatility filtering Alert notifications Short timeframe compatibility Configur
Trend Plator
Francisco Gomes Da Silva
트렌드플레이터: 최적화된 거래 전략을 위한 강력한 추세 예측 지표 우리의 새로운 지표의 힘을 발견하세요! 더 큰 시간 프레임의 추세선을 계산하고 현재 시간 프레임에 직접 예측하여 모든 트레이더의 주목을 끄는 전략적인 지원을 제공합니다. 이러한 포인트는 거래에 강력한 지지나 저항 수준이 되어 거래 전략을 촉진합니다. Price action 지표 컬렉션에 완벽하게 부가되는 지표에 대한 액세스를 상상해보세요. 우리의 새로운 지표가 바로 그것입니다! 테스트해 보고 그 정확성에 놀라워하십시오. 이는 당신의 전략에 부족한 조각이 될 수 있으며 결과를 향상시킬 수 있습니다. 시간을 낭비하지 마세요! 이 멋진 도구를 거래 아카이브에 추가하는 기회를 활용하십시오. 그 가치와 잠재력을 인정한다면 지금 구매하는 것을 망설이지 마십시오. 강력한 지표와 함께 성공의 새로운 수준에 도달하여 정확도를 높이세요! 새로운 소식을 놓치지 마세요 독점적인 출시 소식을 받으려면 지금 가입하세요. 프란시스코 고메스 다
Xtrade Trend Detector
Dago Elkana Samuel Dadie
Xtrade Trend Detector is an indicator capable of finding the best opportunities to take a position in any stock market. Indeed, it is a great tool for scalpers but also for Daytraders. You could therefore use it to identify areas to trade, it fits easily on a chart. I use it to detect trends on Big timeframes and take positions on Small timeframes. Don't hesitate to give me a feedback if you test it.
DYJ 슈퍼 트렌드파는 매우 정확한 봉우리와 파도 밸리 거래 시스템이다. 이 지표는 시장에 진출할 때 촛불선의 최고점과 최저점을 찾는다. 신호의 알림 유형이 dyj supertrend 에 추가되었습니다. 다중 공간 신호를 생성할 때, Alert mailSend, MobilePush 등의 유형의 알림 신호를 사용할 수 있습니다. Input InpSignalPeriod = 10 BarDistance = 24 InpIsAlert = true ============================= DYJ Super Trend Wave ist ein hochpräzises Handelssystem. Dieser Indikator sucht nach den höchsten und niedrigsten Punkten der Kerzenlinien, wenn sie in den Markt gehen. Der Benachrichtigungstyp für das Signal wurde zu
Go Binary
Fabio Oliveira Magalhaes
The main idea of this product is to generate statistics based on signals from 5 different strategies for the Binary Options traders, showing how the results would be and the final balance based on broker's payout. Strategy 1: The calculation is secret. Strategy 2: The signal is based on a sequence of same side candles (same color). Strategy 3: The signal is based on a sequence of interspersed candles (opposite colors). Strategy 4: The signal consists of the indicators bollinger (we have 3 type
다중 시간대 이동 평균선 지표 다중 시간대 이동 평균선 지표를 사용하여 시장 추세를 더 깊이 이해하십시오. 이 강력한 MQL5 도구를 사용하면 하나의 차트에서 5가지 다른 시간대의 이동 평균선을 동시에 시각화할 수 있습니다. 여러 지표 인스턴스로 작업 공간을 복잡하게 만들지 않고도 다양한 관점에서 가격 역학에 대한 포괄적인 통찰력을 얻을 수 있습니다. 주요 기능: 다중 시간대 분석: 하나의 차트에 다른 시간대(예: M15, H1, H4, D1, W1)의 최대 5개의 이동 평균선을 표시합니다. 사용자 정의 기간: 표시되는 모든 선에 대해 원하는 이동 평균 기간을 쉽게 설정할 수 있습니다. 다양한 MA 유형: 단순(SMA), 지수(EMA), 평활(SMMA), 선형 가중(LWMA)을 포함한 광범위한 이동 평균 유형 중에서 선택하십시오. 조정 가능한 시간대: 모니터링하려는 5가지 시간대를 선택하여 비교할 수 없는 유연성을 제공합니다. 깔끔한 시각화: 여러 추세 관점을 한눈에 확인하여 시간대
MultiTF OrderBlocks Pro   is a powerful, unrepainting Smart Money Concepts (SMC) indicator designed for precision day traders and scalpers. It automatically identifies and draws institutional Order Blocks from multiple higher timeframes directly onto your current chart, allowing you to easily spot high-probability reversal zones and areas of deep liquidity without constantly switching timeframes. Built strictly on price-action logic, the indicator detects valid Order Blocks that are confirmed by
Riko Trend mt5
Nadiya Mirosh
The Riko Trend indicator is a revolutionary trend trading and filtering solution with all the important features of a trend tool built into one tool! The Riko Trend indicator is good for any trader, suitable for any trader for both forex and binary options. You don’t need to configure anything, everything is perfected by time and experience, it works great during a flat and in a trend. The Riko Trend indicator is a technical analysis tool for financial markets that reflects the current price f
TRI Visualizer
Yoshimi Mon 三 Ura
TRI Visualizer MT5 – Thermodynamic Market Analysis Overview The TRI (Thermal Range Indicator) Visualizer Enhanced is a rare market analysis indicator that goes beyond conventional technical analysis, applying principles of thermodynamics from physics. It interprets market price fluctuations as “thermodynamic energy,” enabling the highly accurate detection of subtle market changes that are often overlooked. Innovative Mechanisms 1. Dual Calculation Engines Classic TRI Mode Formula: |Close
DYJ BoS
Daying Cao
DYJ BoS 지표는 다음을 포함하여 시장 구조 변화의 필수 요소를 자동으로 식별하고 표시합니다. 구조 돌파(BoS): 가격이 크게 움직여 이전 구조 지점을 돌파할 때 감지됩니다. 상승 추세선과 하락 추세선(UP & DN, 즉 연속적인 신고가와 신저가)을 표시하고, 가격이 이러한 선을 돌파하면 빨간색(BEAR)과 초록색(BULL) 화살표를 표시합니다. BoS는 일반적으로 가격이 이전 가격 움직임에 의해 확립된 스윙 저점이나 스윙 고점을 확실히 통과할 때 발생합니다. 가격이 스윙 하이보다 높거나 스윙 로우보다 낮게 움직일 경우, 이는 단순히 이전에 형성된 시장 구조를 깨는 것이므로 "브레이크아웃" 구조라고 합니다. 이는 종종 시장 심리와 추세 방향의 변화를 나타내며, 기존 추세가 지속되거나 새로운 추세가 시작됨을 알립니다. 일반적으로 마감 정확도를 높이기 위해 손절매와 이익실현을 설정하지 않는 것이 좋습니다. 최종 포지션은 일반적으로 같은 방향의 다음 돌파점에서 마감되거나 반
Liquidity Oscillator
Paolo Scopazzo
3 (2)
A powerful oscillator that provide Buy and Sell signals by calculating the investor liquidity. The more liquidity the more buy possibilities. The less liquidity the more sell possibilities. Please download the demo and run a backtest! HOW IT WORKS: The oscillator will put buy and sell arrow on the chart in runtime only . Top value is 95 to 100 -> Investors are ready to buy and you should follow. Bottom value is 5 to 0 -> Investors are ready to sell and you should follow. Alert + sound will appe
Three Bar Supertrend combines precise reversal pattern detection with the power of the Supertrend trend filter. Built for intraday and swing traders, it spots high-probability bullish and bearish reversals based on a strict three-bar formation—optionally filtered by an SMA trend condition. Features: Detects 3-bar bullish and bearish reversals Uses Supertrend for directional confirmation Optional SMA Fast vs Slow filter for added precision Plots green/red arrows only on valid reversal patterns Ze
Qdotraxy
Fernando Souza Mendes
Discover the Power of the QDOTRAXY Indicator: Your Key to Precise Trading Decisions! Have you ever imagined having a powerful ally that combines advanced technical analysis with real-time alerts to maximize your market operations? We introduce ULTRA ADVANCED, the indicator that revolutionizes how you make buy and sell decisions. Why Choose QDOTRAXY? Unmatched Accuracy: QDOTRAXY combines multiple technical indicators (MACD, Bollinger Bands, SAR, and Moving Average) to generate highly reliable si
Antique Trend
Nadiya Mirosh
The Antique Trend Indicator is a revolutionary trend trading and filtering solution with all the important features of a trend tool built into one tool! The Antique Trend indicator is good for any trader, suitable for any trader both for Forex and binary options. There is no need to configure anything, everything has been perfected by time and experience, it works great during flats and trends. The Antique Trend indicator is a tool for technical analysis of financial markets, reflecting curren
Dynamic Trend Visualizer: Momentum and Direction Indicator The Dynamic Trend Visualizer is an advanced flow analysis tool designed to translate the complexity of price movements into a clear and objective visual map. Through an internal trend-tracking algorithm, the indicator continuously scans price action and identifies who is in control of the market — bulls, bears, or indecision. Instead of cluttering your chart with lines and oscillators, it directly colors the candles in real-time, allowin
Advanced MT5 Indicator: Precision-Powered with Pivot Points, MAs & Multi-Timeframe Logic Unlock the full potential of your trading strategy with this precision-engineered MetaTrader 5 indicator —an advanced tool that intelligently blends Pivot Points , Adaptive Moving Averages , and Multi-Timeframe Analysis to generate real-time Buy and Sell signals with high accuracy.    If you want to test on Real Market, Let me know. I will give the Demo file to run on Real Account.    Whether you're a scal
Quantum Scalp Momentum is a four-in-one confluence indicator for MetaTrader 5 scalping. It overlays EMA9 and VWAP on the chart, monitors volume spikes and Stochastic momentum internally, and prints a BUY or SELL arrow only when all four components agree. Features Four-factor confluence: EMA9 for micro-trend direction, VWAP for fair value, a volume-spike check for participation, and Stochastic for momentum timing. Single clear signal: arrows fire only on full agreement of the four components, whi
RBreaker
Zhong Long Wu
RBreaker Gold Indicators는 금 선물을 위한 단기 데이 트레이딩 전략으로, 추세 추종과 데이 내 반전의 두 가지 거래 방식을 결합합니다. 추세 장에서 수익을 포착할 수 있을 뿐만 아니라, 시장이 반전될 때 적시에 이익을 확정하고 추세에 맞춰 반대 포지션을 잡을 수 있습니다. 이 전략은 미국 잡지 Futures Truth에서 15년 연속으로 가장 수익성 높은 트레이딩 전략 상위 10위 안에 선정되었습니다. 긴 라이프사이클을 자랑하며, 현재까지 국내외에서 널리 사용되고 연구되고 있습니다. 본 지표는 2026년 금 선물의 움직임을 반영하여 14일 ATR 지표를 기반으로 돌파 계수 A, 관찰 계수 B, 반전 계수 R을 보다 합리적인 값으로 정의했습니다. 매우 훌륭한 지표이며, 안정적인 연간 수익성을 달성했습니다. 강력히 추천합니다~ 위 지표는 변동성이 높은 상품에 적합하며, 매개변수는 금 선물, 주가 지수 선물 등에 적합합니다. 다른 상품이 필요한 경우 돌파 계수 A
Better RSI With Tester
Mohammad Taher Halimi Tabrizi
Category: Trend Indicator Platform: MetaTrader 5 Type: Entry Indicator Timeframes: All Trader Styles: Scalping, Day Trading, Swing Trading, Binary Options Markets: All Description This indicator is an enhanced version of the Relative Strength Index (RSI) with additional features for visual clarity and cycle detection. It is designed to provide traders with a clearer view of momentum conditions and potential turning points. Main features: Improved RSI Visualization – The indicator displays RSI va
Fibaction
Abdelkhalek Orabi
Indicator Name: Fibaction – price action candle Detector Description: Fibo Signal Boxes is a powerful Smart Money Concept (SMC)-inspired indicator that auto-detects price action candles. bullish hammers and shooting stars, then draws precise Fibonacci entry zones and multiple take-profit levels directly on the chart. as for the SL personally i use 40 pips rules  Key Features: Detects bullish hammer and shooting star reversal candles. Automatically draws Fibonacci entry and TP boxes. as
Product Overview TD Sequential Pro is a TD Sequential main chart indicator designed specifically for both   MT4 and MT5   platforms, deeply developed based on the classic Tom DeMark Sequential theory. By statistically analyzing the comparison relationship between 9 consecutive bars' closing prices and their 4 preceding bars, this indicator precisely identifies market momentum exhaustion points. It helps traders capture high-probability reversal opportunities at trend ends, while providing compr
FREE
SuperTrend Pro MT5
Gayakvad Hansaben Sumanbhai
SuperTrend Pro MT5 Advanced SuperTrend MT5 Indicator with Buy & Sell Signals, Dashboard & Alerts Overview SuperTrend Pro MT5 is a professional SuperTrend Indicator for MetaTrader 5 designed to identify market trends , trend reversals , and high-probability buy and sell signals . This ATR-based SuperTrend MT5 indicator works on all symbols including Forex, Gold, Indices, Crypto, and Commodities , and supports all timeframes . It is a non-repainting MT5 trend indicator , making it reliable f
SuperTrend Indicator for MT5
Vijaykumar Jayantilal Panchal
Supertrend는 Olivier Sebam이 트레이더가 추세를 식별하고 금융 자산을 매매할 시기를 알 수 있도록 돕기 위해 위에서 언급한 바와 같이 개발한 비교적 인기 없는 기술 지표입니다. 표시기는 TradingView 및 MetaTrader에서 기본값으로 찾을 수 없습니다. 그러나 시장에서 맞춤형 Supertrend 지표를 찾을 수 있습니다. 차트에 적용하면 슈퍼트렌드 표시기가 두 가지 색상으로 표시됩니다. 변경할 수 있지만 기본 색상은 일반적으로 빨간색과 녹색입니다. 녹색이면 자산을 매수하라는 신호이고 빨간색이면 자산을 매도하라는 신호입니다. 슈퍼트렌드 표시기는 모든 타임라인에서 잘 작동합니다. 일간 및 주간 차트와 같이 5분 또는 더 긴 차트와 같이 더 짧은 기간에 작동할 수 있습니다. 매수 및 매도 신호 식별 위에 표시된 것처럼 매수 및 매도 신호는 슈퍼트렌드 지표에 잘 표시됩니다. 가격이 지표의 녹색 부분 위로 움직일 때 매수 신호가 나타납니다. 반면에 표
UT Bot Simple
Bartlomiej Tadeusz Tomaja
**Features:** 1. **Innovative Trend Tracking:** The UT BOT Simple Indicator leverages the power of the Average True Range (ATR), a renowned volatility measure, to calculate precise trailing stop values, providing unparalleled insights into market trends. 2. **Customizable Settings:** Flexibility is paramount in any trading strategy. With this in mind, our indicator allows you to adjust the ATR periods and other key parameters to tailor the tool to your trading style and strategy. 3. **Real-t
ProSync Indicator
Owen Ukah Agboje
Overview The ProSync Indicator is a comprehensive multi-signal dashboard for MetaTrader 5 that combines multiple technical analysis tools into a single, easy-to-read interface. It provides traders with clear buy and sell recommendations based on a proprietary scoring system that analyzes market conditions in real-time. Key Features Multi-Signal Dashboard: Displays combined signals from RSI, MACD, ADX, EMA, and ATR indicators in one unified view. Trading Recommendations: Provides clear Buy (B) a
이 제품의 구매자들이 또한 구매함
Trend Sniper X
Sarvarbek Abduvoxobov
4.86 (43)
Trend Sniper X 는 트레이더가 추세 방향과 잠재적 반전 지점을 명확하고 정확하게 포착할 수 있도록 도와주는 MetaTrader 5용 멀티 타임프레임 추세 추종 지표입니다. MT4용: https://www.mql5.com/en/market/product/193245 가격 정보: 현재 가격은 프로모션 할인가이며, 향후 업데이트 및 새로운 기능이 출시됨에 따라 변동될 수 있습니다. 보너스 혜택: 본 지표 전용 무료 자동매매 Assistant EA를 받으시려면 구매 후 작성자에게 메시지를 보내주시기 바랍니다. Code2Profit 채널 멀티 타임프레임 분석으로 시장을 마스터하세요! Trend Sniper X로 승률을 극대화하는 방법: 핵심 규칙 및 세션 팁 기술 사양 플랫폼 MetaTrader 5 지표 유형 멀티 타임프레임 추세 지표 운용 타임프레임 모든 차트 타임프레임 지원, 독립적으로 선택 가능한 상위 타임프레임(M1–MN1) 주요 상품 외환, 금(XAUUSD) 및 기타 C
새로운 왕의 등장 - 인디케이터 + 주문 관리 표시(TP1 + TP2 + TP3) + 선택형 텔레그램 시그널 전송 기능 포함 (무료) (완전한 트레이딩 및 시그널 시스템) 골드를 위한 최고의 EA: Gold Slayer 이 인디케이터는 고급 전략, 사용자 지정 가능한 주문 관리 시스템, 그리고 엔벨로프 확장을 결합한 평균 회귀(mean reversion) 시스템을 포함하고 있습니다. 또한 RSI와 같은 여러 지능형 확인 필터를 통해 높은 확률의 반전 진입 구간을 포착하여 BUY 및 SELL 시그널을 제공합니다. 단순히 거래 방법만 배우는 것이 아니라, 여러 포지션을 효과적으로 관리하고 이전에 수익 중인 오픈 포지션으로 손실 거래를 커버하는 방법까지 익힐 수 있습니다. M5 전용으로 설계 및 최적화되었으며, 유동성이 풍부해 시그널이 더 깔끔하고 신뢰도 높은 BTCUSD와 XAUUSD에서 뛰어난 성능을 발휘합니다. 이 인디케이터는 ATR 기반으로 자동 계산된 진입가, 손절가, 익절가와
Smart Trend Trading System — MetaTrader 5 구매 후 MQL5에서 저에게 메시지를 보내시면 Smart Universal Expert Advisor를 무료로 받으실 수 있으며, 온라인 강좌, PDF 매뉴얼 및 비공개 그룹 이용 권한도 함께 제공됩니다. STTS는 추세 방향, 진입·청산 신호, 반전 구간, 주요 가격 수준을 차트에 모아 보여줍니다. 시스템을 참고해 수동으로 거래하거나, 별도의 호환 EA를 연결하여 선택한 설정에 따라 자동으로 거래를 실행할 수 있습니다. 하나의 시스템, 네 가지 트레이딩 접근법 STTS의 트레이딩 접근법은 크게 네 가지로 나뉩니다. • 스캘핑 — 단기 신호와 시장 움직임을 살펴봅니다. • 추세 매매 — 방향을 평가하고 추세 안에서 기회를 찾습니다. • 반전 매매 — 잠재적인 전환 구간과 방향 변화를 파악합니다. • 거래량 매매 — 거래량 기반 정보로 시장 활동을 평가합니다. 진입·청산 화살표, 추세 정보, 지지·저항 수
Zoryk Gold
Reda El Koutbane
4.76 (17)
ZORYK — MetaTrader 5용 XAUUSD 전문 신호 및 트레이드 플래닝 시스템 이런 경험이 있을 것입니다. 골드를 분석하고 진입을 기다린 뒤 마침내 포지션을 열었지만 가격이 곧바로 반대 방향으로 움직입니다. 너무 일찍 청산하거나 Stop Loss를 옮기거나 몇 초 동안 망설입니다. 그 후 시장은 내가 없이도 처음 예상했던 목표까지 정확히 움직입니다. 문제는 항상 방향이 아니었습니다. 진짜 문제는 불확실성이었습니다. 정확한 진입 위치를 몰랐습니다. 어느 지점에서 원래의 트레이드 아이디어가 무효가 되는지 몰랐습니다. 가까운 수익을 확보해야 할지 더 큰 움직임을 기다려야 할지 판단하기 어려웠습니다. 현재 setup이 정말 강한지 아니면 단지 새로운 거래를 억지로 찾고 있는지도 확신하기 어려웠습니다. 골드는 매우 빠르게 움직입니다. 명확한 계획이 없다면 좋은 분석도 몇 초 만에 나쁜 결정으로 바뀔 수 있습니다. ZORYK는 이 문제를 해결하기 위해 개발되었습니다.
M5 Sniper
MeanFX
5 (3)
당신의 트레이딩 우위를 한눈에 확인하세요! M5 Sniper 는 MeanFX의 새로운 지표입니다. 정확한 트레이딩 신호 와 적응형 TP/SL 레벨 을 결합하여, 결과적으로 가능한 최고의 통계적 트레이딩을 만들어냅니다! 5회 구매마다 가격이 인상되며, 다음 가격은 69$입니다. 구매 후 저에게 메시지를 보내주시면 팁/가이드와 보너스 EA를 제공해 드립니다. 무엇이 이 지표를 특별하게 만들까요? Gold XAUUSD에서 검증된 통계적 성과 ( 거의 모든 자산에서 작동 하며, 일관된 결과 없이 모든 것을 다루려고 하기보다는 하나의 타임프레임을 완전히 익히는 데 집중합니다) 각 심볼당 하루 1~8회의 트레이드 와 높은 승률을 제공하며, 모든 통계적 우위를 우리의 편으로 가져갑니다. 차트에는 확인된 BUY 및 SELL 신호만 표시됩니다. 각 트레이드에 대해 지표가 생성하는 적응형 TP 및 SL 레벨 평균 승률 75%+ 평균 Signal Ratio 최소 1.1+ 알람 및 알림이 휴대폰 으로도
SuperScalp Pro
Van Minh Nguyen
4.54 (37)
SuperScalp Pro - Professional Multi-Layer Confluence Scalping System SuperScalp Pro는 기존 Supertrend에 여러 지능형 확인 필터를 추가하여 기능을 강화한 고급 스캘핑 지표입니다. 잘못된 신호를 크게 줄이면서 성공 가능성이 더 높은 Buy/Sell 거래 기회를 식별하는 데 도움을 줍니다. 명확한 Buy 및 Sell 화살표가 차트에 직접 표시되며, ATR 기반 Stop Loss 및 Take Profit 레벨도 실시간으로 자동 계산됩니다. 구매 후 MQL5 메시지로 저에게 연락하시면 SuperScalp Pro Auto Trader EA를 무료로 받으실 수 있으며, 사용자 가이드와 비공개 그룹 이용 권한도 제공됩니다. 권장 설정 파일 다운로드: [Set File] 전체 문서는 제품 블로그에서 확인할 수 있습니다: [User Guide] 업데이트를 받으려면 공식 채널에 참여하세요: [Official Channel]
SMC Intraday Formula
VividMind Digital Solutions
5 (26)
먼저 솔직하게 말하겠습니다. 어떤 인디케이터도 단독으로 당신을 수익성 있게 만들어주지 않습니다. 누군가 그렇게 말한다면, 그는 당신에게 꿈을 파는 것입니다. 완벽한 매수/매도 화살표를 보여주는 모든 인디케이터는 완벽하게 보이도록 만들 수 있습니다 — 단지 올바른 과거 구간을 확대하고 승리한 거래만 캡처하면 됩니다. 우리는 그렇게 하지 않습니다.  SMC Intraday Formula는 도구입니다. 시장 구조를 읽고, 가장 높은 확률의 가격 구간을 표시하며, 현재 스마트 머니의 흐름이 어떻게 보이는지 아주 단순한 언어로 보여줍니다. 최종 결정은 여전히 당신이 합니다. 실행도 당신이 합니다. 하지만 이제는 희망이 아니라 정확성으로 거래하게 됩니다. 우리는 이 인디케이터를 지난 약 3년 동안 골드(XAUUSD) 및 주요 외환 통화쌍의 데이 트레이딩 스캘핑에 사용해 왔습니다. M1, M5, M15, M30에서 우리의 핵심 도구입니다. 이 도구는 미래를 예측하려 하지 않습니다 — 지금 형성
Entry Points Pro for MT5
Yury Orlov
4.52 (152)
전설이 돌아왔습니다: Entry Points Pro 10. MQL5 마켓 Top-3 자리를 3년간 지켜온 전설적인 지표의 재출시입니다. 두 버전 합산 600개 이상의 리뷰, 매일 이 지표로 거래하는 수천 명의 트레이더, 28,000회 이상의 데모 다운로드   MT4+MT5 . 지난 5년간 여러분이 남긴 리뷰를 하나도 빠짐없이 읽었고, 약속 대신 그 답을 버전 10에 담았습니다. 1999년부터 시장에서 활동하며 정직함과 자신의 평판, 그리고 고객을 소중히 여기는 개발자가 만들었습니다. Entry Points Pro의 진입 시그널은 절대 리페인팅되지 않습니다. 그리고 이번에는 개발자의 말뿐이 아니라 검증 가능한 사실입니다: 확정 시그널은 캔들 종가에서만 표시되며, 자동화 테스트에서 리페인팅 0건 이 확인되었습니다(EURUSD, XAUUSD, BTCUSD에서 2,486,568회의 불변조건 검사 — 위반 0건). 검증 방법은 공개되어 있으니 전략 테스터에서 직접 재현해 보실 수 있습니다.
GoldenX Entry MT5
VividMind Digital Solutions
5 (17)
GoldenX Entry는 MT5용 인디케이터로, 적응형 Smart Entry Trend 알고리즘, 신호 스코어링 시스템, 시장 레짐 감지 기능, 그리고 변동성 필터를 포함합니다. 각 신호에는 계산된 진입 레벨, 3개의 익절(TP1, TP2, TP3) 레벨, 그리고 손절(Stop-Loss) 레벨이 포함됩니다. 이 인디케이터는 다양한 시장 환경에 적응하도록 설계된 다중 분석 레이어 구조 위에 구축되어 있으며, 내장 최적화기와 통계 추적 시스템을 결합합니다. 또한 Risk-to-Reward(RR) 지표와 과거 거래 행동 기반의 정량 분석을 제공합니다. 시작은 간단합니다 — 선택한 타임프레임에서 최적화기를 실행한 뒤 차트에서 바로 인디케이터를 사용하면 됩니다. 핵심 기능 GoldenX Entry는 하나의 차트에서 신호 엔진, 트레이드 관리 기능, 그리고 과거 통계 추적을 통합합니다: - 내장 최적화기: 최적화기는 차트에서 원클릭으로 실행됩니다. 200개의 파라미터 조합을 두 단계 탐색
Auto Optimized SpeedAngle 은 지속적인 워크포워드 최적화(Walk-Forward Optimization, WFO)를 통해 곡선 적합(curve-fitting)을 제거한 기관 수준의 모멘텀 벡터화 시스템입니다. 시장 체제가 바뀔 때 성능이 떨어지는 정적 입력에 의존하는 대신, 이 지표는 표본 외(Out-of-Sample, OOS) 검증을 사용하여 매개변수를 동적으로 재보정하며, 표시되는 신호가 과거의 우연이 아닌 진정한 통계적 우위를 나타내도록 보장합니다. 핵심 기관용 프레임워크 워크포워드 최적화 엔진: 핵심 알고리즘은 수천 가지의 룩백(lookback) 및 임계값 조합을 지속적으로 스캔하며, 데이터를 인샘플(in-sample)과 표본 외(out-of-sample) 세트로 엄격하게 분리합니다. 미지의 데이터 환경에서 수학적 우수성이 증명된 경우에만 새로운 매개변수 구성을 채택합니다. 정량적 목적 함수: 순수한 총이익을 쫓는 대신, 최적화 엔진은 기관 수준의 안정성
ARIPoint
Temirlan Kdyrkhan
1 (4)
ARIPoint is a powerful trading companion designed to generate high-probability entry signals with dynamic TP/SL/DP levels based on volatility. Built-in performance tracking shows win/loss stats, PP1/PP2 hits, and success rates all updated live. Key Features: Buy/Sell signals with adaptive volatility bands Real-time TP/SL/DP levels based on ATR Built-in MA Filter with optional ATR/StdDev volatility Performance stats panel (Success, Profit/Loss, PP1/PP2) Alerts via popup, sound, push, or email Cu
Gann Made Easy MT5
Oleg Rodin
5 (12)
Gann Made Easy 는 mr.의 이론을 사용하여 최고의 거래 원칙을 기반으로 하는 전문적이고 사용하기 쉬운 Forex 거래 시스템입니다. W.D. 간. 이 표시기는 Stop Loss 및 Take Profit Levels를 포함하여 정확한 BUY 및 SELL 신호를 제공합니다. PUSH 알림을 사용하여 이동 중에도 거래할 수 있습니다. 구매 후 거래 방법 안내 및 유용한 추가 지표를 무료로 받으시려면 저에게 연락주세요! 아마도 Gann 거래 방법에 대해 이미 여러 번 들었을 것입니다. 일반적으로 Gann의 이론은 초보자 거래자뿐만 아니라 이미 거래 경험이 있는 사람들에게도 매우 복잡한 것입니다. Gann의 거래 방식은 이론적으로 적용하기 쉽지 않기 때문입니다. 나는 그 지식을 연마하고 Forex 지표에 최고의 원칙을 적용하기 위해 몇 년을 보냈습니다. 표시기는 적용하기가 매우 쉽습니다. 차트에 첨부하고 간단한 거래 권장 사항을 따르기만 하면 됩니다. 지표는 지속적으로 시장 분석
M1 Sniper MT5
Oleg Rodin
5 (7)
M1 SNIPER 는 사용하기 쉬운 거래 지표 시스템입니다. M1 시간대에 맞춰 설계된 화살표 지표입니다. 이 지표는 M1 시간대 스캘핑을 위한 단독 시스템으로 사용할 수 있으며, 기존 거래 시스템의 일부로도 사용할 수 있습니다. 이 거래 시스템은 M1 시간대 거래용으로 특별히 설계되었지만, 다른 시간대에도 사용할 수 있습니다. 원래는 XAUUSD와 BTCUSD 거래를 위해 이 방법을 설계했지만, 다른 시장 거래에도 유용하다는 것을 알게 되었습니다. 이 지표의 신호는 추세 방향과 반대로 거래될 수 있습니다. 저는 지표의 신호를 활용하여 양방향으로 거래할 수 있도록 돕는 특별한 거래 기법을 알려드립니다. 이 방법은 특별한 동적 지지선과 저항선 가격 영역을 활용하는 것을 기반으로 합니다. 구매하시면 M1 SNIPER 화살표 지표를 바로 다운로드하실 수 있습니다. 또한, 아래 스크린샷에 표시된 Apollo Dynamic SR 지표는 M1 SNIPER 도구를 사용하는 모든 사용자에게 무료로
Adaptive Price Action Engine 지표를 구매하면 EA(자동매매 프로그램)가 무료 멀티 타임프레임 기반 자기 최적화 추세 & 캔들 패턴 분석 시스템 시장은 끊임없이 변화하며, 모든 Price Action 패턴이 모든 시장 환경에서 동일한 가치를 가지는 것은 아닙니다. Adaptive Price Action Engine 은 변화하는 시장 환경에 적응할 수 있도록 설계되었으며, 추세 구조, 멀티 타임프레임 분석, 캔들 패턴 및 통계적 최적화 를 하나의 분석 프레임워크로 결합합니다. 두 가지 적응형 모드 Dual Alpha Trend Mode 낮은 타임프레임과 높은 타임프레임에서 적합한 Alpha Trend 파라미터를 자동으로 탐색하여, 최근 시장 움직임에 맞춰 추세 분석을 조정합니다. Candlestick + Alpha Mode Alpha Trend를 통한 시장 국면 분석과 22개의 상승 및 하락 캔들 패턴 을 결합합니다. 모든 패턴을 동일하게 취급하는 대신, 다양
Power Candles MT5
Daniel Stein
4.58 (12)
Power Candles V3 - 자체 최적화 강도 지표 파워 캔들 V3는 적용된 모든 차트에서 통화 및 상품의 강세를 실행 가능한 거래 계획으로 전환합니다. 단순히 캔들에 색상을 입히는 대신, 백그라운드에서 실시간 자동 최적화를 수행하여 현재 보고 있는 종목에 대한 최적의 손절매, 익절 및 신호 임계값을 제공합니다. 한 번의 클릭으로 실시간 거래에 적용할 수 있으며, 진입점, 손절매 및 익절 선이 정확한 가격에 맞춰 차트에 표시되고, 방향과 함께 알림이 발령됩니다. 이 도구는 Stein Investments 에코시스템의 일부입니다. 18개 이상의 도구와 함께 당신의 1대1 AI 트레이딩 멘토 Max.  항상 대기 중, 모든 인디케이터를 깊이 있게 이해, 무언가를 차근차근 생각해보고 싶은 순간에 도움을 줍니다.  https://stein.investments 에서 만나보세요 매 종가 바마다 3,000회 이상의 트레이딩 시뮬레이션. 9가지 강도 상태. 2가지 전략을 병렬로 테스트.
다음 업데이트 — 버전 2.52 곧 출시! [신규] 시장 분석 및 트레이딩 워크플로를 향상시키기 위해 설계된 4가지 주요 신규 기능을 기대해 주세요. 트레이딩 요구 사항을 충족하도록 설계된 4가지 새로운 기능으로 시장 분석을 한 단계 더 발전시킵니다. 다음 기능을 소개합니다: 1. TRADE OVERVIEW DASHBOARD 2. CONFLUENCE AT ZONE 3. STRONG & WEAK HIGH/LOW 4. OTE 1. TRADE OVERVIEW DASHBOARD 시장 전체 상황을 더 쉽게 파악할 수 있도록 도와주는 대시보드입니다. 트레이딩 의사결정을 지원하는 가이드를 제공하며, 하나의 화면에서 시장을 분석하고 체계적으로 트레이딩을 계획할 수 있도록 도와줍니다. 멀티 타임프레임 시장 개요 (Multi-Timeframe Market Overview) 시장 방향과 가격 구조를 더욱 명확하게 파악 시장 상황을 빠르게 확인 체계적인 시장 분석 및 진입 계획을 위한 가이드 2. CO
Boba Analysis Suite
Trade Ready Solutions LLC
5 (2)
Boba Analysis Suite Boba Analysis Suite는 MetaTrader 5용 분석 지표입니다. 시장 구조, 주요 가격 영역, 전반적인 시장 상황을 하나의 차트 화면에 통합하여 표시합니다. 트레이더이자 트레이딩 코치로서의 실무 경험을 바탕으로 개발되었으며, 시장 방향 평가, 주요 가격 수준 식별, 여러 시간대의 종합적인 분석 등 체계적인 분석 과정을 지원합니다. 시장 맥락을 고려한 분석 개별 신호의 의미는 시장 상황에 따라 달라집니다. Boba Analysis Suite는 현재 차트 상황을 더 넓은 시장 구조와 연결하고, 사전에 정한 규칙에 따라 매매 아이디어를 검토할 수 있도록 돕습니다. 주요 분석 기능은 다음과 같습니다. 추세 및 시장 구조: 시장 방향과 관련 구조적 맥락을 평가합니다. 주요 가격 영역 및 수준: 추가 분석이 필요한 중요한 영역을 차트에 시각적으로 표시합니다. 여러 시간대: 서로 다른 시간대의 정보를 통합하여 전반적인 시장 상황을 평가합니다.
FiboSniper Pro
Van Minh Nguyen
5 (4)
FiboSniper Pro – Multi-Filter Fibonacci System with Auto SL/TP and Control Panel FiboSniper Pro는 동적 Fibonacci Envelopes와 여러 확인 필터를 결합하여 선별된 Buy 및 Sell 신호를 생성하는 기술적 지표입니다. Fibonacci 레벨은 Moving Average와 ATR을 기반으로 계산된 후 ADX, EMA, RSI, ATR, Volume, Time 및 Candle 구조를 통해 필터링됩니다. 이 지표는 ATR 기반의 자동 Stop Loss 및 Take Profit 레벨을 차트에 직접 표시하며, 빠른 설정 조정을 위한 인터랙티브 Control Panel을 제공합니다. 구매 후 MQL5 메시지로 저에게 연락하시면 Auto Trader X를 무료로 받으실 수 있으며, 이 지표의 거래 신호를 자동화하는 방법에 대한 안내도 제공됩니다. User Guide 및 Set Files: [Click here
Tokyo mt5 Indicator
Vasiliy Strukov
5 (12)
Tokyo Indicator는 추세 방향, 잠재적 거래 신호 및 시장 상황을 명확하고 시각적으로 보여줍니다. 색상으로 구분된 계단식 추세선은 강세 구간(파란색)과 약세 구간(자홍색)을 명확히 구별해 줍니다. 추세가 전환될 때 나타나는 방향성 화살표는 잠재적인 매수 및 매도 기회를 강조하여 보여줍니다. 통합 대시보드는 현재 신호, 시장 성향(bias), 모멘텀, 변동성, 신호 품질 등의 정보를 한눈에 파악할 수 있도록 구성되어 있습니다. 이를 통해 트레이더는 별도의 패널을 오갈 필요 없이 가격 움직임(price action)과 지표의 데이터를 동시에 분석할 수 있습니다. 깔끔한 차트 화면과 간결한 시장 개요를 제공하는 Tokyo Indicator는 체계적인 추세 분석과 거래 결정을 지원합니다. 모든 시간대와 다양한 자산(특히 금)에서 활용할 수 있습니다. 추세 방향, 잠재적 거래 신호 및 시장 상황을 명확하고 시각적으로 보여줍니다. 색상으로 구분된 계단식 추세선은 강세 구간(파란색)
Trend Catcher ind mt5
Ramil Minniakhmetov
5 (18)
트렌드 캐처 인디케이터 트렌드 캐처 인디케이터는 개발자가 자체 개발한 맞춤형 적응형 트렌드 분석 지표들을 조합하여 시장 가격 움직임을 분석합니다. 단기적인 노이즈를 제거하고 근본적인 모멘텀 강도, 변동성 확대, 가격 구조 움직임에 집중하여 진정한 시장 방향을 파악합니다. 또한 이동 평균, RSI, 변동성 필터와 같은 맞춤형 지표들을 활용하여 가격을 평활화하고 트렌드를 필터링합니다. 실제 운영 모니터링 및 기타 제품은 다음 링크에서 확인하실 수 있습니다:   https://www.mql5.com/en/users/mechanic/seller 텔레그램에서는 EA나 설정 파일을 판매하지 않습니다. 사기이니 주의하세요. 모든 설정 파일은 블로그에서 무료로 제공됩니다. 중요! 구매 후 즉시 연락 주시면 사용 방법 및 보너스를 드립니다!
Gold Trend Coach MT5
Cristhian Alexander Gaibor Cuasquer
5 (2)
Gold Trend Coach는 MetaTrader 5용 골드(XAUUSD) 추세 지표로, 매수 및 매도 신호, 손절과 세 개의 익절 목표를 봉 마감 시 확정하며, 멀티 타임프레임 코치 대시보드와 휴대폰 및 Telegram 알림을 제공합니다. 런던과 뉴욕 세션의 M5 스캘핑과 M15 데이트레이딩을 위해 만들어졌습니다. Gold Trend Coach: 진입, 손절, 세 개의 목표가 있는 XAUUSD 골드 추세 신호. 출시 가격 $39, 처음 20개 한정, 이후 $59. 구매 후 메시지를 주시면 구매자 키트를 바로 보내 드립니다. 최악의 연속 손실을 차트 위에 그대로 보여 주는 골드 지표. 이 마켓의 모든 XAUUSD 지표는 자신의 승리 신호를 보여 줍니다. Gold Trend Coach는 손실 신호도 보여 줍니다. 빨간색으로 세고, 최악의 연속 손실과 순결과를 보기 좋은 것만이 아니라 모든 것을 세는 패널에 표시합니다. 신호가 손절에 닿으면 보입니다. 세 번 연속 손절에 닿아도 보입
Quantum TrendPulse
Bogdan Ion Puscasu
5 (26)
SuperTrend   ,   RSI   ,   Stochastic   의 힘을 하나의 포괄적인 지표로 결합하여 트레이딩 잠재력을 극대화하는 궁극의 트레이딩 도구   인 Quantum TrendPulse를   소개합니다. 정밀성과 효율성을 추구하는 트레이더를 위해 설계된 이 지표는 시장 추세, 모멘텀 변화, 최적의 진입 및 종료 지점을 자신 있게 식별하는 데 도움이 됩니다. 주요 특징: SuperTrend 통합:   주요 시장 추세를 쉽게 따라가고 수익성의 물결을 타세요. RSI 정밀도:   매수 과다 및 매도 과다 수준을 감지하여 시장 반전 시점을 파악하는 데 적합하며 SuperTrend 필터로 사용 가능 확률적 정확도:   변동성이 큰 시장에서 숨겨진 기회를 찾기 위해 확률적 진동   을 활용하고 SuperTrend의 필터로 사용 다중 시간대 분석:   M5부터 H1 또는 H4까지 다양한 시간대에 걸쳐 시장을 최신 상태로 유지하세요. 맞춤형 알림:   맞춤형 거래 조건이 충족되면
Neuro Poseidon MT5
Daria Rezueva
4.75 (52)
Neuro Poseidon is a new indicator by Daria Rezueva. It combines precise trading signals with adaptive TP/SL levels - creating best possible trades as a result! Message me and get  Neuro Poseidon Assistant  as a gift to automize your trading process! What makes it stand out? 1. Proven profitability on all assets and timeframes 2. Only confirmed BUY and SELL signals present on the chart 3. Adaptive TP & SL levels generated by the software for each trade 4. Easy to understand - suitable for al
Azimuth Pro
Ottaviano De Cicco
5 (7)
Azimuth Pro V2: Synthetic Fractal Structure and Confirmed Entries for MT5 Overview Azimuth Pro is a multi-level swing structure indicator by Merkava Labs . Four nested swing layers, swing-anchored VWAP, ABC pattern detection, three-timeframe structural filtering, and closed-bar confirmed entries — one chart, one workflow from micro-swings to macro-cycles. This is not a blind signal product. It is a structure-first workflow for traders who care about location, context, and timing. Halloween P
소개       Quantum Breakout PRO   , 브레이크아웃 존 거래 방식을 변화시키는 획기적인 MQL5 지표! 13년 이상의 거래 경험을 가진 숙련된 트레이더 팀이 개발한       퀀텀 브레이크아웃 PRO       혁신적이고 역동적인 브레이크아웃 존 전략으로 거래 여정을 새로운 차원으로 끌어올리도록 설계되었습니다. Quantum Breakout Indicator는 5개의 이익 목표 영역이 있는 브레이크아웃 영역의 신호 화살표와 브레이크아웃 상자를 기반으로 한 손절 제안을 제공합니다. 초보자 거래자와 전문 거래자 모두에게 적합합니다. Quantum EA 채널:       여기를 클릭하세요 중요한! 구매 후 설치 매뉴얼을 받으려면 개인 메시지를 보내주십시오. 추천: 기간: M15 통화쌍: GBPJPY, EURJPY, USDJPY,NZDUSD, XAUUSD 계정 유형: 스프레드가 매우 낮은 ECN, Raw 또는 Razor 브로커 시간: GMT +3 중개인 :
Dynamic Forex28 Navigator MT5
Bernhard Schweigert
5 (1)
다중 통화 강도 및 모멘텀 지표 MT5 Dynamic Forex28 Navigator는 오랫동안 사랑받아 온 저희 지표의 진화 버전으로, 세 가지 기능을 하나로 결합했습니다: Advanced Currency Strength28 Indicator (리뷰 700개) Advanced Currency IMPULSE with ALERT (리뷰 530개) CS28 Combo Signals (최근 보너스) 두 이전 지표는 MQL5 Market에서 합계 1,200개가 넘는 리뷰를 받았으며 2016년부터 MT4 커뮤니티의 필수품이었습니다. Dynamic Forex28 Navigator MT5는 검증된 동일한 로직을 그대로 이어갑니다. MetaTrader 5를 위해 완전히 다시 제작 – MT5의 네이티브 다중 심볼 아키텍처를 최대한 활용하도록 설계되었습니다. 사용 설명서: https://www.mql5.com/en/blogs/post/758844 MT4 버전을 찾고 계신가요? 여기를 클릭하세요: ht
Scalper Vault MT5
Oleg Rodin
5 (1)
Scalper Vault는 당일 매매(intraday trading)에서 일관된 성과를 내고자 하는 트레이더를 위해 설계된, 강력하고 모든 기능을 갖춘 트레이딩 시스템입니다. 이 고정밀 지표는 외환(Forex) 및 바이너리 옵션 트레이더 모두에게 기관급 분석을 제공하는 독립적인 종합 트레이딩 시스템 역할을 합니다. 구매 후 저에게 연락해 주시면, 트레이딩 팁과 함께 특별한 보너스를 제공해 드립니다! Scalper Vault는 추측에 의존하거나 복잡한 수동 분석을 할 필요를 없애주며, 사용하기 쉬운 트레이딩 기법을 통해 오직 매매 실행에만 집중할 수 있도록 돕습니다. 정확한 추세 추종 신호: 핵심 알고리즘이 시장 구조를 분석하여, 지배적인 시장 추세 방향과 일치하는 고확률 신호만을 제공함으로써 잘못된 진입을 획기적으로 줄여줍니다. 정밀한 고점 및 저점 탐지: 시장의 움직임이 소진되는 지점을 스캔하여 잠재적인 반전 구간을 식별합니다. 간(Gann) 이론 기반의 매수/매도 구간: 수학적
Volatility Master for MetaTrader is a real-time dashboard tool that scans up to  50 symbols  to identify high-volatility , trending markets instantly. With bullish/bearish signals, customizable alerts, and a user-friendly interface, it helps you avoid range-bound conditions and focus on high-probability trades. Clarity leads to confidence. Trade confidently and protect your capital effectively with this powerful dashboard. We don't offer free or bonus indicators in exchange of reviews from you.
SR Liquidity MT5
Oleg Rodin
5 (2)
SR Liquidity 는 시장 유동성이 집중되고 가격이 가장 강력하게 반응하는 숨겨진 구간을 포착하도록 설계된 트레이딩 지표입니다. 이러한 특수 유동성 구간은 강력한 지지 및 저항선 역할을 하며, 시장 반전 가능성이 가장 높은 지점을 명확하게 보여주는 지도가 되어 줍니다. SR Liquidity는 일반적인 지지 및 저항선을 단순히 그리는 대신, 실제 가격 움직임을 분석하여 매수 및 매도 압력이 집중되는 구간을 포착합니다. 이러한 구간은 실질적인 시장의 흐름을 주도하는 유동성 풀(liquidity pools)에 해당합니다. 이 지표는 해당 구간을 차트에 직접 시각화하여, 가격 반응이 실제로 나타나기 전에 이를 미리 예측할 수 있도록 돕습니다. 즉, 가격 추세가 전환될 가능성을 사전에 파악하게 해주는 것입니다. 결과적으로 이 지표는 가공되지 않은 가격 움직임(price action)을 시장의 핵심 가격대, 다시 말해 추세 전환점이 될 수 있는 지점들을 보여주는 명확하고 실용적인 로드맵
OrderFlux – MetaTrader 5용 Order Flow Footprint Chart, Volume Profile 및 Market Profile 지표 OrderFlux는 MetaTrader 5용 오더 플로우 Footprint 지표로, 각 캔들 내부에서 실제로 어떤 거래가 발생하는지 명확하게 보여줍니다. 개별 캔들을 펼쳐 각 가격 수준에서 체결된 거래량을 표시하고, 공격적인 매도와 공격적인 매수를 구분합니다. 틱 데이터를 기반으로 실시간 Footprint 차트를 구성하며, Delta, Imbalance, Absorption, Volume Profile, Market Profile(TPO), VWAP, Cumulative Delta(CVD), DOM 탭 및 경제 캘린더를 하나의 정돈되고 읽기 쉬운 인터페이스에 통합합니다. 일반적인 차트는 시가, 고가, 저가, 종가만 보여줍니다. 이는 가격 움직임의 결과이지 원인은 아닙니다. OrderFlux는 오더 플로우 트레이딩의 핵심 질문에
제작자의 제품 더 보기
QuantumTrade Panel
Joas Da Silva Veiga
5 (2)
추세,추세 분석,추세 추종,신호,알림,트레이딩 패널,대시보드,시장 컨텍스트,스캘핑,일중 거래,단타,스윙 트레이딩,리페인트 없음,지연 없음,위험 관리,리스크 보상,지지 저항,수요 공급 구역,매수 압력,매도 압력,외환,암호화폐 이 패널은 가격과 거래량 데이터를 명확한 추세 신호, 매수/매도 압력, 그리고 객관적인 트레이드 예측으로 변환하는 고급 시장 분석 도구로, 모든 정보를 차트 위의 하나의 패널에 통합하여 표시합니다. 이 지표는 시장 행동에 대한 동적 분석, 리스크 관리, 자동 트레이드 예측을 결합하여 Gamma Zero, 거래량, 추세, Delta Risk 및 누적 리스크와 같은 지표를 실시간으로 표시합니다. 또한 중요한 데이터(매수/매도 피크 및 누적 리스크)를 자동으로 저장하는 지능형 데이터 유지 기능을 제공하여, 타임프레임 변경이나 터미널 재시작 후에도 데이터 연속성을 보장합니다. 사운드, 푸시, 이메일 알림 설정과 다양한 자산 유형에 대한 자동 적응 기능을 통해 이 패널
FREE
거래 패널,수동 거래,주문 관리,위험 관리,트레이드 매니저,트레이딩 어시스턴트,원클릭 거래,스톱로스,테이크프로핏,스캘핑 중요 JoPanel Prime가 정상적으로 작동하려면 MetaTrader 5에서 "Algo Trading" 옵션을 반드시 활성화해야 합니다. 이 옵션이 활성화되어 있지 않으면 패널이 작동하지 않습니다. JoPanel Prime는 MetaTrader 5용으로 개발된 전문 수동 트레이딩 패널입니다. 주문을 빠르고 효율적으로 실행하고 포지션을 관리할 수 있도록 설계되었으며, MT5의 기본 인터페이스를 차트에서 직접 사용할 수 있는 현대적인 트레이딩 패널로 대체합니다. 주요 기능 • 원클릭 시장가 Buy 및 Sell 주문 실행 • 차트 미리보기 기능이 있는 Pending Orders (Shift: Buy, Alt: Sell) • Hotkeys (X: 전체 청산, I: 포지션 반전, M: 패널 최소화) • Take Profit 및 Stop Loss 개별 설정 •
FREE
Dual Clock Pro
Joas Da Silva Veiga
clock,  Server Time, Local Time, MT5 Clock, Clock Indicator, Digital Clock DualClockPro - Local and Server Clock for MetaTrader 5 DualClockPro is a visual clock indicator for MetaTrader 5 that displays local computer time and trading server time directly on the chart. It also supports displaying the corresponding dates, helping traders monitor time differences between their local environment and the broker's server. The panel has a compact design and customizable settings, allowing users to ada
FREE
주문표, 트레이딩 패널, 리스크 관리, 수동 거래, 트레일링 스탑, 주문 관리, 빠른 체결 — JoOrderTrade Pro — MetaTrader 5 실행 패널 JoOrderTrade Pro는 MetaTrader 5를 위한 완전한 그래픽 패널로, 수동 주문 실행과 고급 리스크 관리를 제공합니다. 이 패널은 플랫폼의 기본 거래 창을 깔끔하고 반응성이 뛰어나며 성능에 최적화된 인터페이스로 대체하여 거래 시 더 높은 정확성과 제어 기능을 제공합니다. 이 제품은 자동 매매 로봇이 아닙니다. 모든 진입 및 청산 결정은 전적으로 트레이더가 수행합니다. 패널은 주문 실행 및 포지션 보호 관리만 자동화합니다. 이 패널은 Netting 및 Hedge 계좌를 지원하며, 설정 가능한 인터페이스, 사용자 지정 가능한 핫키, 그리고 고급 거래 관리 도구를 제공합니다. 주요 기능 빠른 주문 실행 원클릭 Market Buy 및 Market Sell 주문. 차트에서 직접 Pending Order 배치. Sh
RSI Trend Color
Joas Da Silva Veiga
RSI 컬러 캔들 , 컬러 캔들 지표 기능 설명 RSI Trend Color는 RSI 값을 캔들 차트의 색상으로 변환하는 지능형 시각적 지표입니다. 자동으로 캔들을 색칠합니다: 파란색 : RSI 과매도 구간 주황색 : RSI 과매수 구간 흰색 : RSI 중립 구간 추가 기능: 주요 RSI 레벨 알림 풀백 알림 간단하고 사용자 지정 가능한 설정 대상 사용자 시각적 분석을 선호하는 트레이더 RSI를 배우는 초보자 분석 속도를 높이고 싶은 숙련 트레이더 MetaTrader 5 사용자 사용 방법 MetaTrader 5에 설치 자동으로 차트에 표시 설정 조정: RSI 기간 (기본값: 4) 알림 활성화 또는 비활성화 색상 확인: 파란색 캔들: 매수 가능성 주황색 캔들: 매도 가능성 전문가 팁:   RSI Zone Memory Reative   와 함께 사용하면 정확도가 향상됩니다. 하지 않는 기능 자동 거래 없음 수익 보장 없음 리스크 관리 대체 불가 MT5 전용 트레이딩 로봇 아님 위험
FREE
Smart Top Bottom Finder
Joas Da Silva Veiga
top finder, bottom finder, market structure, price action, trend reversal, trend continuation, support resistance, swing high, swing low, frequency analysis, price projection, breakout detection, pullback trading, swing trading, market turning points EXPERIMENTAL VERSION – UNDER ACTIVE DEVELOPMENT Smart Top Bottom Finder is a market structure and frequency analysis indicator designed to identify potential tops and bottoms based on recurring price movement patterns. The indicator does not rely
FREE
Trend Flow Oscillator
Joas Da Silva Veiga
추세,추세지표,모멘텀,오실레이터,히스토그램,추세강도,시장흐름,추세확인,강세,약세,기술적분석 Trend Flow Oscillator는 시장의 흐름과 모멘텀을 분석하기 위한 지표로, 가격 움직임의 강도와 방향을 명확하고 간단하게 빠르게 시각적으로 파악할 수 있도록 설계되었습니다. 특히 M5 타임프레임에서 효과적이며, 이 구간에서는 흐름 변화가 더 자주 발생합니다. 기능 매수 및 매도 압력의 변화와 지속을 식별 가격 움직임의 가속 및 감속 표시 추세 방향의 진입 확인을 지원 흐름을 별도의 히스토그램으로 표시 방향성 모멘텀 오실레이터로 작동 대상 사용자 재량 트레이더 스캘퍼 및 데이트레이더 (특히 M5) 자동 신호보다 흐름 확인을 원하는 트레이더 추세 및 되돌림 매매 트레이더 간결하고 명확한 지표를 선호하는 사용자 사용 방법 권장 타임프레임: M5 히스토그램 해석: 양수 막대는 매수 압력 증가를 의미 음수 막대는 매도 압력 증가를 의미 막대가 클수록 모멘텀이 강함 다음과 같은 용도로 사
FREE
Simple Panel MT5
Joas Da Silva Veiga
Order Ticket, Trading Panel, Risk Management, Manual Trading, Order Management, Fast Execution,  execution panel for MetaTrader 5 Simple Panel MT5 Simple Panel is a lightweight trading panel for MetaTrader 5 that lets you execute market orders and manage open positions directly from your chart. Designed for simplicity and convenience, the panel provides BUY, SELL, and CLOSE buttons in a compact interface, helping you access essential trading actions without navigating through multiple trading w
FREE
Trend Zone Force
Joas Da Silva Veiga
5 (1)
추세, 되돌림, 추세 지표, 변동성, atr, 이동평균, ema, 모멘텀, 오실레이터, 주문흐름, 델타, 추세 매매, 스캘핑, 데이트레이딩 이 지표는 추세 분석, 풀백 식별 및 시장 상황을 객관적으로 판단하기 위해 개발되었습니다. 이동평균과 변동성을 결합하여 동적인 구간을 생성하고, 가격 방향을 보다 명확하게 해석할 수 있도록 도와줍니다. 주요 목적은 트레이더가 시장의 지배적인 추세에 맞춰 거래할 수 있도록 돕고, 낮은 확률의 진입을 줄이며 스캘핑, 데이트레이딩, 스윙 트레이딩에서 의사결정을 개선하는 것입니다. 주요 기능 이동평균을 기반으로 한 추세 방향 식별 변동성을 기반으로 한 동적 풀백 구간 시장 압력(매수 또는 매도 우위) 분석 주요 추세 방향에 따른 거래 필터링 간결하고 직관적인 시각적 구조 사용 방법 가격이 매수 구간(녹색 선) 위에 있을 경우, 매수 우위 시장으로 판단됩니다. 이 경우 가격이 매수 구간 근처로 되돌아올 때 매수 진입 기회를 고려할 수 있습니다. 가격이
추세 지표, 모멘텀 지표, 흐름 지표, 동적 밴드, MT5 인디케이터, 스캘핑 지표, 데이 트레이딩, 스윙 트레이딩, 퍼센트 거리, 리페인트 없음, 실시간 알림, 멀티 타임프레임, 모멘텀 히스토그램, EMA 추세, 추세 강도 TrendBands Momentum Ultra는 트레이더가 시장의 방향성, 움직임의 강도, 그리고 가격이 추세로부터 얼마나 떨어져 있는지를 시각적으로 파악할 수 있도록 설계된 추세 및 흐름 지표입니다. 이 지표는 내부적으로 두 개의 지수 이동평균(EMA)을 사용합니다. 중심선인 Gamma Zero는 추세의 기준을 나타냅니다. 양의 볼륨 밴드와 음의 볼륨 밴드는 가격 모멘텀에 따라 동적으로 확장 및 수축합니다. Dist는 현재 움직임과 Gamma Zero 사이의 거리를 퍼센트로 표시하여 시장의 강도를 객관적으로 보여줍니다. 기능 주요 추세를 식별하고, 움직임의 강도를 측정하며, 되돌림 또는 추세 지속이 발생할 수 있는 구간을 시각적으로 확인할 수 있습니다. 또한
Quantum Pulse Force
Joas Da Silva Veiga
추세 지표, 시장 흐름, 모멘텀 지표, 가격 행동, 외환 지표, 매수 매도 신호, 추세 반전, 변동성 지표, 기술 분석, MT5 지표, 스캘핑, 시장 강도, 거래 신호, 알고리즘 거래, 가격 채널 Quantum Pulse Force는 가격 흐름의 가속도를 측정하고, 통계적 축적 구간을 식별하며, 높은 확률의 수렴 신호를 생성하도록 설계된 MetaTrader 5용 기술적 지표입니다. 이 지표는 여러 정량적 분석 기법을 결합하여 시장 움직임에 대한 통합적이고 객관적인 시각을 제공합니다. 시각적 구성 요소 지표는 차트에 다양한 그래픽 요소를 표시합니다: 색상 캔들 (흐름 및 강도 기반) 양수 및 음수 흐름 히스토그램 상단 및 하단 채널 라인 음영 처리된 구간 영역 신호 강도 라인 Z-Score 라인 매수 및 매도 화살표 차트 내 정보 패널 흐름 퍼센트 로직 핵심 계산은 두 이동평균 간 차이의 백분율 변화에 기반합니다. 해석: 양수 값은 상승 가속도를 의미 음수 값은 하락 가속도를 의미
mt5지표, 모멘텀지표, 추세지표, 스캘핑 전략, 매수 매도 신호, 기술적 분석, 오실레이터, 지지 저항, 가격 행동, 돌파 매매, 외환 전략, 스윙 트레이딩, 패턴 분석, 시장 모멘텀, 트레이딩 신호 MasterForce Pattern Panel이란 MasterForce Pattern Panel은 MetaTrader 5용 고급 도구로, 원시 시장 데이터를 실전 매매에 사용할 수 있는 매수·매도 패턴으로 변환합니다. 이 도구는 가격 움직임의 네 가지 핵심 요소를 분석합니다. PFRE (Power Flow Real Estate)는 틱 단위로 매수와 매도 세력의 차이를 측정합니다. 양수는 매수 우세, 음수는 매도 우세를 의미합니다. Flow는 시장 움직임의 가속도를 나타내며, 추세가 강화되는지 약화되는지를 보여줍니다. RSI는 최근 가격 변동에 민감하게 반응하여 과매수와 과매도 상태를 판단합니다. 통합 Score는 주요 데이터를 결합하여 -100에서 +100 사이의 값으로 현재 시장
Market Sentry
Joas Da Silva Veiga
Market Analysis, Market Structure, Price Action, Trend Analysis, Bullish, Bearish, Range Market, Directional Bias, Market Dashboard, Trading Dashboard, Trend Detection, Market Scanner, Market Context, Breakout Analysis, Consolidation Analysis, Trend Filter, Technical Analysis, Real Time Analysis This indicator analyzes price behavior in real time and classifies market conditions into Bullish , Bearish , Range , and Neutral scenarios. Price is continuously evaluated relative to a dynamic referen
FREE
Price Pressure Book
Joas Da Silva Veiga
Time and Sales, Time and Sales Indicator, Tape Reading, Pressure Book, Buy Sell Pressure, Tick Analysis, Market Pressure, Tick Data, Price Movement Analysis, Tick Strength, Momentum Analysis, Buy Sell Movement, Movement Sequences, Real-Time Tick Monitor, Trading Dashboard, Points Analysis, Customizable Alerts, MT5 Indicator Pressure Book - Tick Analysis and Buy/Sell Pressure Indicator for MT5 Pressure Book is a MetaTrader 5 indicator designed to monitor tick-based price movements and display es
Flow Pressure Histogram
Joas Da Silva Veiga
Flow Pressure Histogram, Market Flow Indicator, Probability Indicator, Trend Detection, Ranging Detection, Multi-Filter Indicator, Volatility Thermometer, Pattern Recognition, Breakout Alert, Momentum Indicator, Market Pressure, Buy Sell Pressure, Signal Indicator, MT5 Indicator, Forex Indicator Flow Pressure Histogram The Multi-Layer Market Flow Indicator for MT5 Flow Pressure Histogram is an advanced technical indicator that visualizes real-time buying and selling pressure as a color-coded h
Precision Histogram Trend MT5 is a customizable trend histogram indicator for MetaTrader 5, designed to display positive and negative histogram values and visualize changes in momentum direction. Precision Histogram Trend MT5 Precision Histogram Trend MT5 is a customizable histogram indicator for MetaTrader 5 that displays positive and negative values around a central zero line. Its color-coded bars provide a visual representation of changes in histogram direction and magnitude. The indicator
Apex Signal Pro MT5
Joas Da Silva Veiga
reversal, entry, signal, momentum, non-repaint, precision, alerts, filtered-signals Apex Signal Pro Overview Apex Signal Pro is a technical indicator designed to identify potential reversal points on any chart. It combines momentum analysis with multiple confirmation filters to reduce noise and highlight relevant price reversal conditions. The indicator supports different symbols and timeframes. Confirmed signals are displayed as fixed chart markers, while developing conditions can be indicated
Trend Pulse Signal Pro
Joas Da Silva Veiga
Trend and momentum signals with VWAP-based price analysis, clear entry, stop loss and take profit projections, and configurable alerts for scalping and day trading. Trend Pulse Signal Pro Trend Pulse Signal Pro is a technical indicator for MetaTrader 5 that generates buy and sell signals using a multi-factor model. It is designed for traders seeking a structured approach to signal analysis, with projected entry, stop, and target levels displayed directly on the chart. The indicator does not us
필터:
리뷰 없음
리뷰 답변