RSI Zone Memory Reactive

  • Indicateurs
  • Joas Da Silva Veiga
    Joas Da Silva Veiga
    Bonjour, je viens du Brésil. Je développe seul mes propres outils et indicateurs pour MT5, basés sur mes besoins et mes études en day trading. Je suis nouveau ici sur MQL5 et je mets à disposition des outils et indicateurs que j’utilise et développe moi-même, certains gratuits et d’autres payants
  • Version: 1.0
  • Activations: 5

RSI Indicator, RSI Signals, Buy Sell Signals, Trend Indicator, Momentum Indicator, Overbought Oversold, Reversal Indicator, Trading Signals, Forex Indicator, MT5 Indicator, Double Top, Double Bottom, Trend Filter, Technical Analysis, Trading Alerts


RSI Zone Memory Reactive – RSI Signals and Market Structure

An RSI indicator for identifying momentum shifts, repeated RSI extremes, and potential reversal areas in MetaTrader 5.

Overview

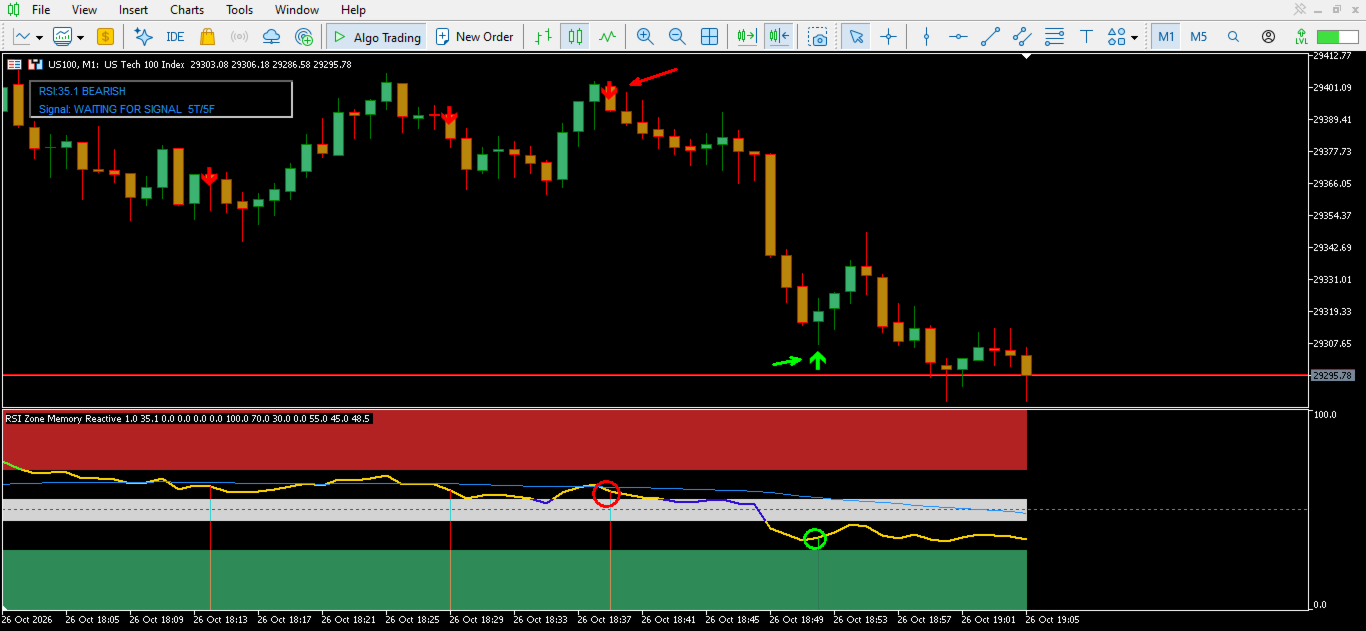
RSI Zone Memory Reactive is a technical analysis indicator for MetaTrader 5 that combines the Relative Strength Index (RSI), historical RSI extreme levels, momentum analysis, and a trend filter to help traders evaluate potential trading opportunities.

Instead of relying only on fixed overbought and oversold levels, the indicator stores selected RSI highs and lows and monitors when the RSI returns to previously recorded levels.

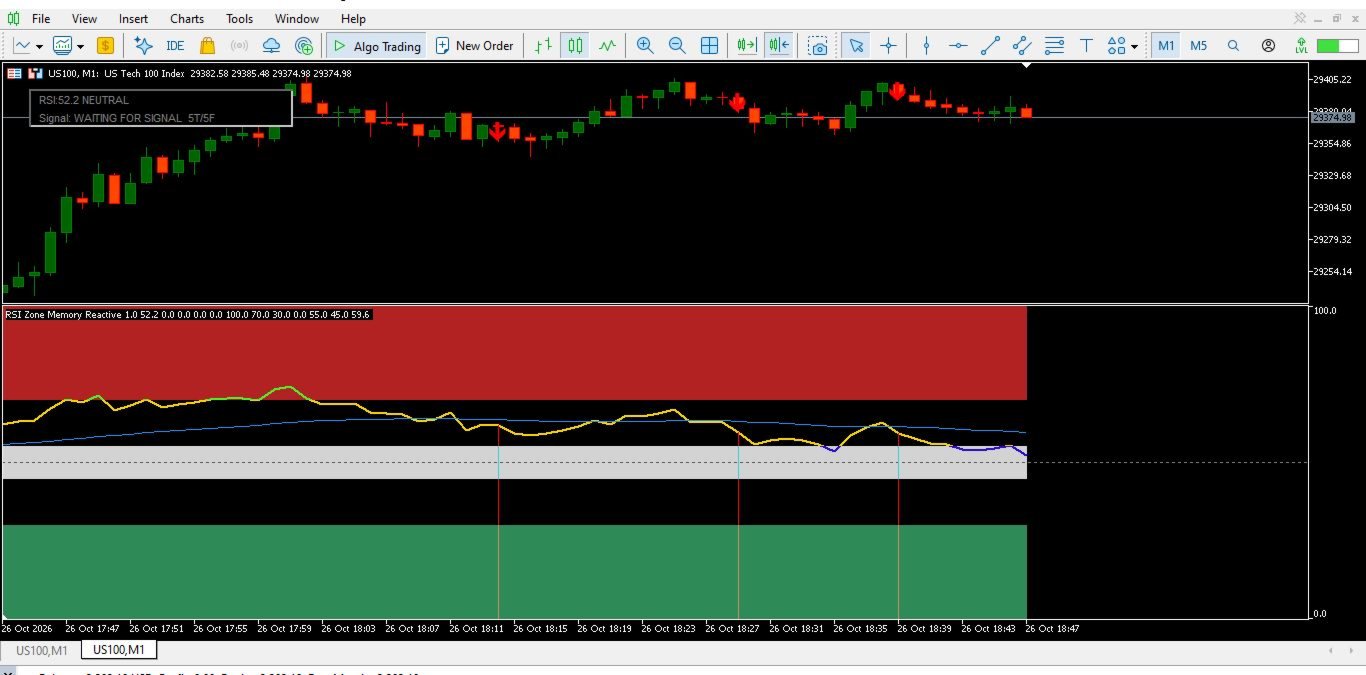
It displays RSI-based buy and sell signals, double-top and double-bottom patterns, momentum information, and a chart information panel.

Key Features

RSI Analysis

Uses a 21-period RSI with configurable overbought, oversold, and neutral-zone logic defined by the indicator.

RSI Memory System

Records selected RSI highs above 60 and lows below 40. The memory system compares new extremes with previously stored levels and maintains a configurable number of historical reference values.

Buy and Sell Signals

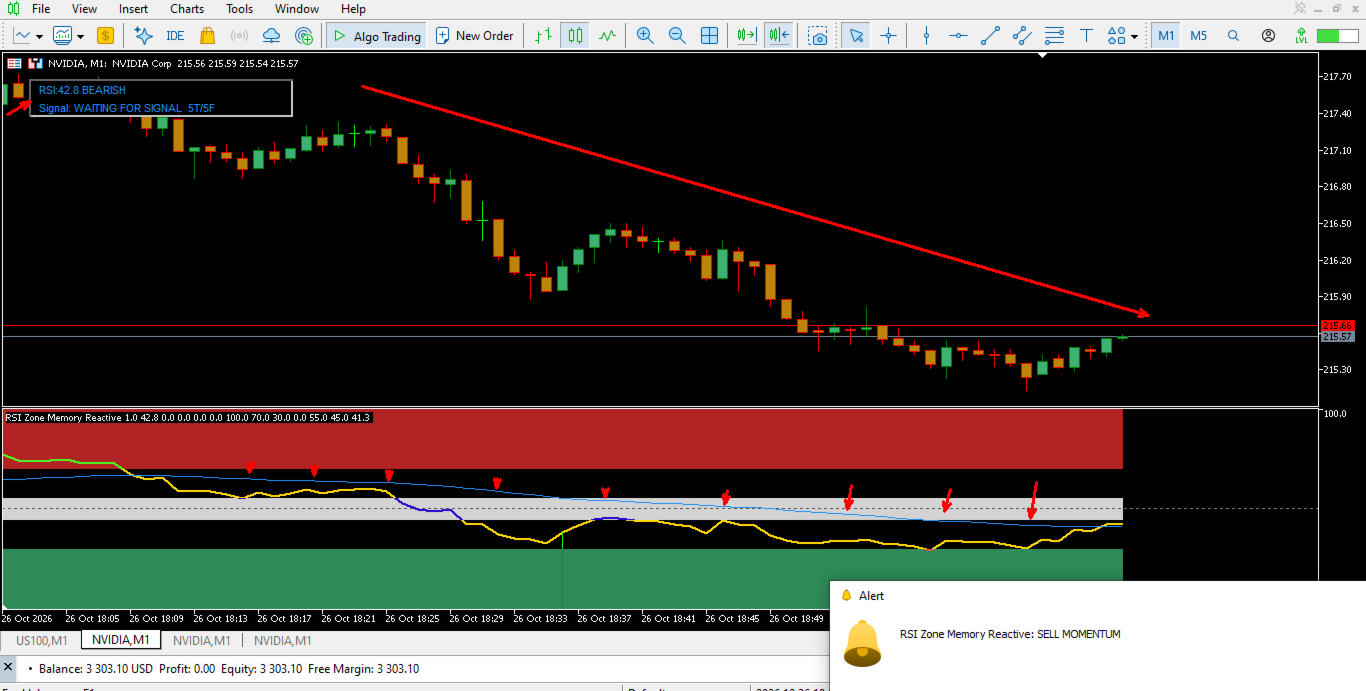
Identifies potential buy and sell setups when the RSI changes direction near a memorized extreme level. Signals are evaluated using the indicator's momentum and trend conditions.

Double-Top and Double-Bottom Detection

Identifies potential repeated RSI extremes, with additional conditions for stronger signals when the RSI reaches the overbought or oversold areas.

Momentum Analysis

Measures the RSI change over three bars to identify stronger upward or downward momentum.

Trend Filter

Uses a 50-period exponential moving average of the RSI to evaluate the direction of the oscillator and filter certain counter-trend signals.

Overbought, Oversold, and Neutral Zones

Displays the main RSI reference areas and identifies relatively compressed RSI movement within the neutral region.

Chart Signals and Alerts

Displays buy and sell arrows on the main price chart and provides configurable alerts when qualifying signals are detected.

Information Panel

Shows the current RSI value, market status, signal information, and the number of stored tops and bottoms.

Customization

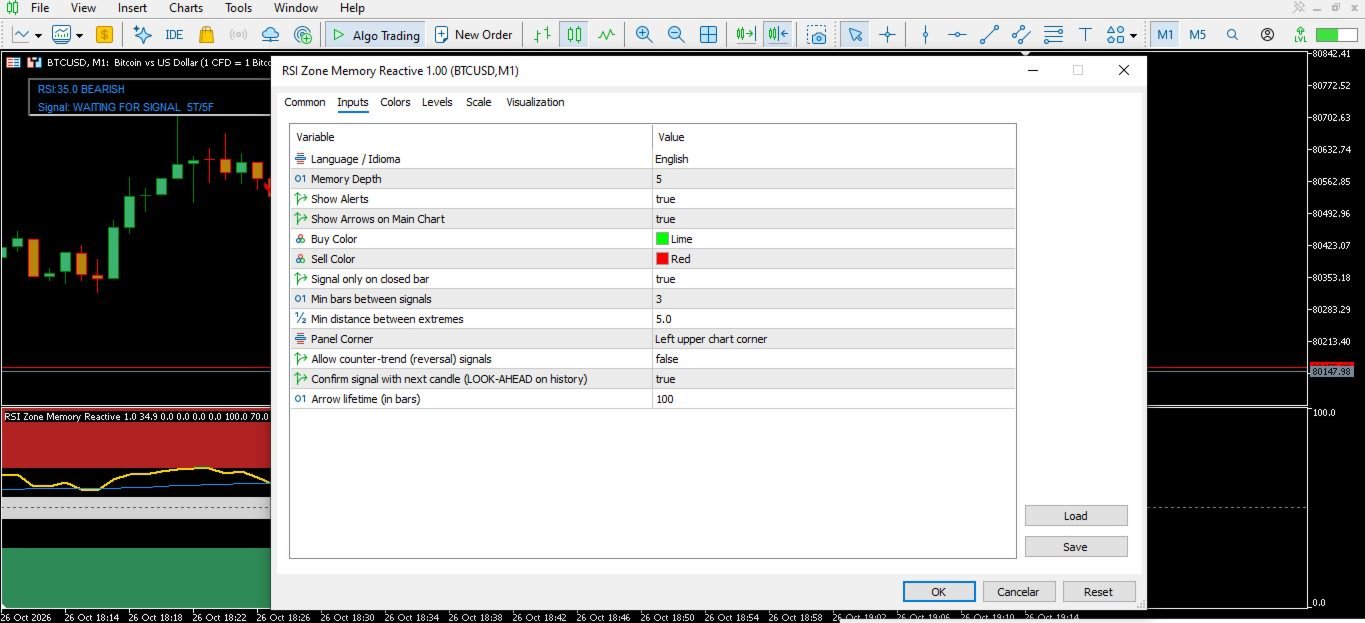
The indicator includes configurable settings for:

  • RSI memory depth.

  • Buy and sell signal colors.

  • Chart arrows.

  • Signal alerts.

  • Minimum bars between signals.

  • Minimum distance between recorded RSI extremes.

  • Counter-trend signal filtering.

  • Optional next-candle confirmation.

  • Arrow lifetime on the chart.

  • Information panel position.

  • English and Portuguese interface messages.

How It Works

The indicator evaluates RSI behavior in several stages.

First, it identifies local RSI highs and lows that meet its recording conditions. These values are stored as reference levels.

Next, it monitors the RSI for a return to a previously recorded level. Potential signals are evaluated using RSI direction, momentum, the trend filter, and the configured signal conditions.

When the required conditions are satisfied, the indicator can display a signal in its separate window, draw an arrow on the main chart, and issue an alert.

The memory system, momentum filter, and trend filter are designed to complement conventional RSI analysis rather than replace independent market analysis.

Who Is It For?

RSI Zone Memory Reactive is intended for traders who use technical analysis and want to study RSI extremes, momentum changes, repeated oscillator highs and lows, and potential reversal setups.

It can be used as an additional analytical tool alongside price action, support and resistance, and other technical indicators.

Important Information

RSI Zone Memory Reactive is an analytical indicator, not an automated trading robot. It does not execute trades or guarantee trading results.

Signals are technical conditions, not predictions of certain market movements. Market conditions can change, and signals may fail.

The optional next-candle confirmation uses subsequent candle data when evaluating historical signals. Historical signal placement should therefore be interpreted with this behavior in mind.

Always evaluate the indicator under your own trading conditions and apply appropriate risk management.

Plus de l'auteur
QuantumTrade Panel
Joas Da Silva Veiga
5 (2)
tendance,analyse de tendance,signaux,alertes,panneau de trading,tableau de bord,contexte de marché,scalping,day trading,intraday,swing trading,sans repaint,sans recalcul,gestion du risque,risque rendement,support résistance,zones offre demande,pression achat vente,forex,crypto,multi timeframe Le panneau est un outil avancé d’analyse de marché qui transforme les données de prix et de volume en signaux clairs de tendance, de pression acheteuse/vendeuse et en projections objectives de trading, le
FREE
Panneau de trading,Trading manuel,Gestion des ordres,Gestion du risque,Trade Manager,Assistant de trading,Stop Loss,Take Profit,Trail Stop,Scalpinging Important Pour que JoPanel Prime fonctionne correctement, il est obligatoire d'activer l'option « Algo Trading » dans MetaTrader 5. Si cette option n'est pas activée, le panneau ne fonctionnera pas. JoPanel Prime est un panneau de trading manuel professionnel pour MetaTrader 5. Il a été conçu pour exécuter les ordres rapidement et gérer effica
FREE
Dual Clock Pro
Joas Da Silva Veiga
clock,  Server Time, Local Time, MT5 Clock, Clock Indicator, Digital Clock DualClockPro - Local and Server Clock for MetaTrader 5 DualClockPro is a visual clock indicator for MetaTrader 5 that displays local computer time and trading server time directly on the chart. It also supports displaying the corresponding dates, helping traders monitor time differences between their local environment and the broker's server. The panel has a compact design and customizable settings, allowing users to ada
FREE
Ticket d’ordre, Panneau de trading, Gestion des risques, Trading manuel, Trailing Stop, Gestion des ordres, Exécution rapide — JoOrderTrade Pro — panneau d’exécution pour MetaTrader 5 JoOrderTrade Pro est un panneau graphique complet destiné à l’exécution manuelle des ordres et à la gestion avancée des risques sur MetaTrader 5. Il remplace les fenêtres de trading natives de la plateforme par une interface propre, réactive et optimisée pour les performances, offrant davantage de précision et de
RSI Trend Color
Joas Da Silva Veiga
Bougies Colorées RSI , RSI Couleur , Indicateur Visuel Fonctionnement RSI Trend Color est un indicateur visuel intelligent qui transforme les valeurs RSI en couleurs directement sur le graphique en chandeliers : Bleu   : RSI en zone de survente Orange   : RSI en zone de surachat Blanc   : RSI en zone neutre Fonctionnalités supplémentaires : Alertes sonores et visuelles Alertes de pullback Paramètres simples et personnalisables À qui s’adresse cet outil Traders visuels Débutants utilisant le RS
FREE
top finder, bottom finder, market structure, price action, trend reversal, trend continuation, support resistance, swing high, swing low, frequency analysis, price projection, breakout detection, pullback trading, swing trading, market turning points EXPERIMENTAL VERSION – UNDER ACTIVE DEVELOPMENT Smart Top Bottom Finder is a market structure and frequency analysis indicator designed to identify potential tops and bottoms based on recurring price movement patterns. The indicator does not rely
FREE
tendance,indicateur de tendance,momentum,oscillateur,histogramme,force de tendance,flux de marche,confirmation de tendance,haussier,baissier,analyse technique Le Trend Flow Oscillator est un indicateur de flux et de momentum du marché conçu pour aider les traders à identifier la force et la direction des mouvements de prix de manière claire, simple et avec une lecture visuelle rapide. Il est particulièrement efficace sur l’unité de temps M5, où les changements de flux se produisent plus fréque
FREE
Trend Zone Force
Joas Da Silva Veiga
5 (1)
tendance, pullback, indicateur de tendance, volatilité, atr, moyenne mobile, ema, momentum, oscillateur, flux d’ordres, delta, trading de tendance, scalping Cet indicateur a été développé pour l’analyse de tendance, l’identification des pullbacks et l’évaluation objective du contexte de marché. Il combine des moyennes mobiles et la volatilité afin de créer des zones dynamiques et de fournir une interprétation claire de la direction du prix. L’objectif est d’aider le trader à opérer en accord av
indicateur de tendance, indicateur momentum, indicateur de flux, bandes dynamiques, indicateur MT5, scalping indicateur, day trading indicateur, swing trading, distance pourcentage, sans repaint, alertes temps réel, multi timeframe, histogramme momentum, EMA tendance, force tendance TrendBands Momentum Ultra est un indicateur de tendance et de flux conçu pour aider les traders à visualiser la direction du marché, la force du mouvement et la distance du prix par rapport à la tendance. L’indicate
indicateur de tendance, flux de marché, indicateur de momentum, price action, indicateur forex, signaux achat vente, inversion de tendance, volatilité, analyse technique, indicateur MT5, scalping, force du marché, signaux trading, trading algorithmique, canaux de prix Quantum Pulse Force est un indicateur technique pour MetaTrader 5 conçu pour mesurer l’accélération du flux de prix, identifier des canaux d’accumulation statistique et générer des signaux de convergence à haute probabilité. L’ind
indicateur mt5, indicateur de momentum, indicateur de tendance, stratégie scalping, signaux d'achat et de vente, analyse technique, oscillateur, support résistance, price action, breakout trading, stratégie forex, swing trading, reconnaissance de motifs, momentum du marché, signaux de trading Qu’est-ce que le MasterForce Pattern Panel Le MasterForce Pattern Panel est un outil avancé pour MetaTrader 5 qui transforme les données brutes du marché en signaux exploitables de modèles d’achat et de v
Market Sentry
Joas Da Silva Veiga
Market Analysis, Market Structure, Price Action, Trend Analysis, Bullish, Bearish, Range Market, Directional Bias, Market Dashboard, Trading Dashboard, Trend Detection, Market Scanner, Market Context, Breakout Analysis, Consolidation Analysis, Trend Filter, Technical Analysis, Real Time Analysis This indicator analyzes price behavior in real time and classifies market conditions into Bullish , Bearish , Range , and Neutral scenarios. Price is continuously evaluated relative to a dynamic referen
Time and Sales, Time and Sales Indicator, Tape Reading, Pressure Book, Buy Sell Pressure, Tick Analysis, Market Pressure, Tick Data, Price Movement Analysis, Tick Strength, Momentum Analysis, Buy Sell Movement, Movement Sequences, Real-Time Tick Monitor, Trading Dashboard, Points Analysis, Customizable Alerts, MT5 Indicator Pressure Book - Tick Analysis and Buy/Sell Pressure Indicator for MT5 Pressure Book is a MetaTrader 5 indicator designed to monitor tick-based price movements and display es
Flow Pressure Histogram, Market Flow Indicator, Probability Indicator, Trend Detection, Ranging Detection, Multi-Filter Indicator, Volatility Thermometer, Pattern Recognition, Breakout Alert, Momentum Indicator, Market Pressure, Buy Sell Pressure, Signal Indicator, MT5 Indicator, Forex Indicator Flow Pressure Histogram The Multi-Layer Market Flow Indicator for MT5 Flow Pressure Histogram is an advanced technical indicator that visualizes real-time buying and selling pressure as a color-coded h
Filtrer:
Aucun avis
Répondre à l'avis