RSI Zone Memory Reactive

  • Indicadores
  • Joas Da Silva Veiga
    Joas Da Silva Veiga
    Olá, eu sou do Brasil. Desenvolvo sozinho minhas próprias ferramentas e indicadores para MT5, baseados nas minhas necessidades e nos meus estudos de day trade. Sou novo aqui no MQL5 e disponibilizo ferramentas e indicadores que eu mesmo uso e desenvolvi, alguns gratuitos e outros pagos. Se você
  • Versão: 1.0
  • Ativações: 5

RSI Indicator, RSI Signals, Buy Sell Signals, Trend Indicator, Momentum Indicator, Overbought Oversold, Reversal Indicator, Trading Signals, Forex Indicator, MT5 Indicator, Double Top, Double Bottom, Trend Filter, Technical Analysis, Trading Alerts


RSI Zone Memory Reactive – RSI Signals and Market Structure

An RSI indicator for identifying momentum shifts, repeated RSI extremes, and potential reversal areas in MetaTrader 5.

Overview

RSI Zone Memory Reactive is a technical analysis indicator for MetaTrader 5 that combines the Relative Strength Index (RSI), historical RSI extreme levels, momentum analysis, and a trend filter to help traders evaluate potential trading opportunities.

Instead of relying only on fixed overbought and oversold levels, the indicator stores selected RSI highs and lows and monitors when the RSI returns to previously recorded levels.

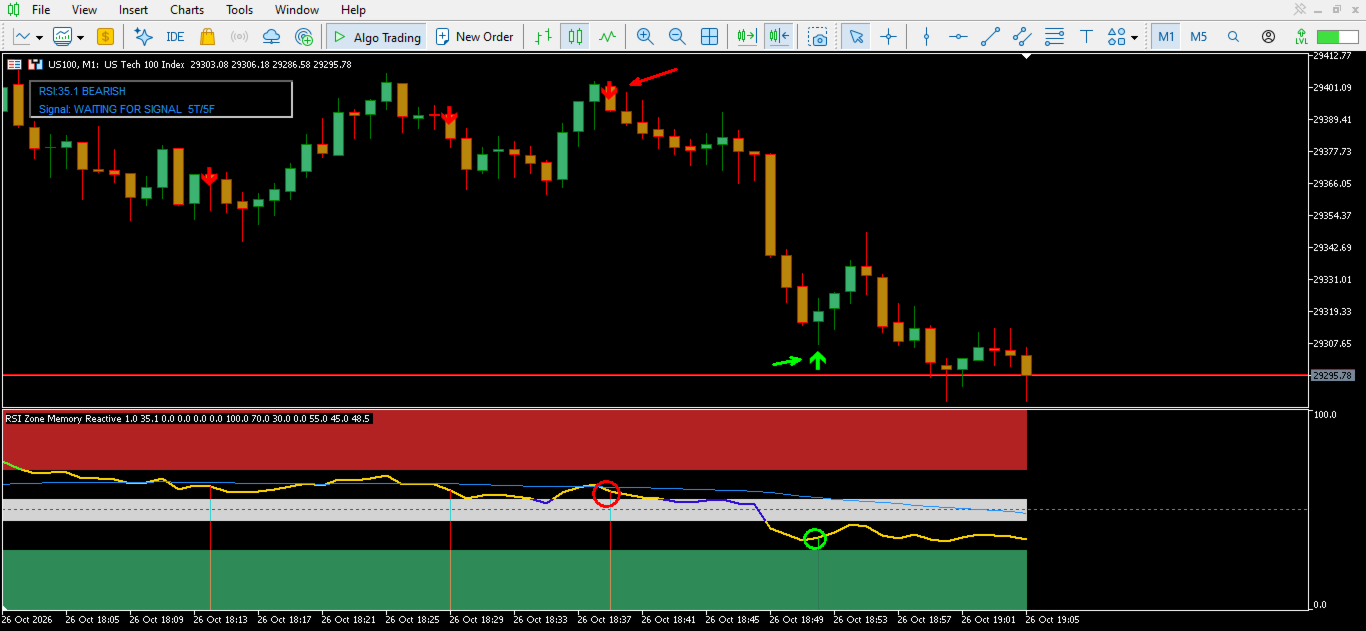
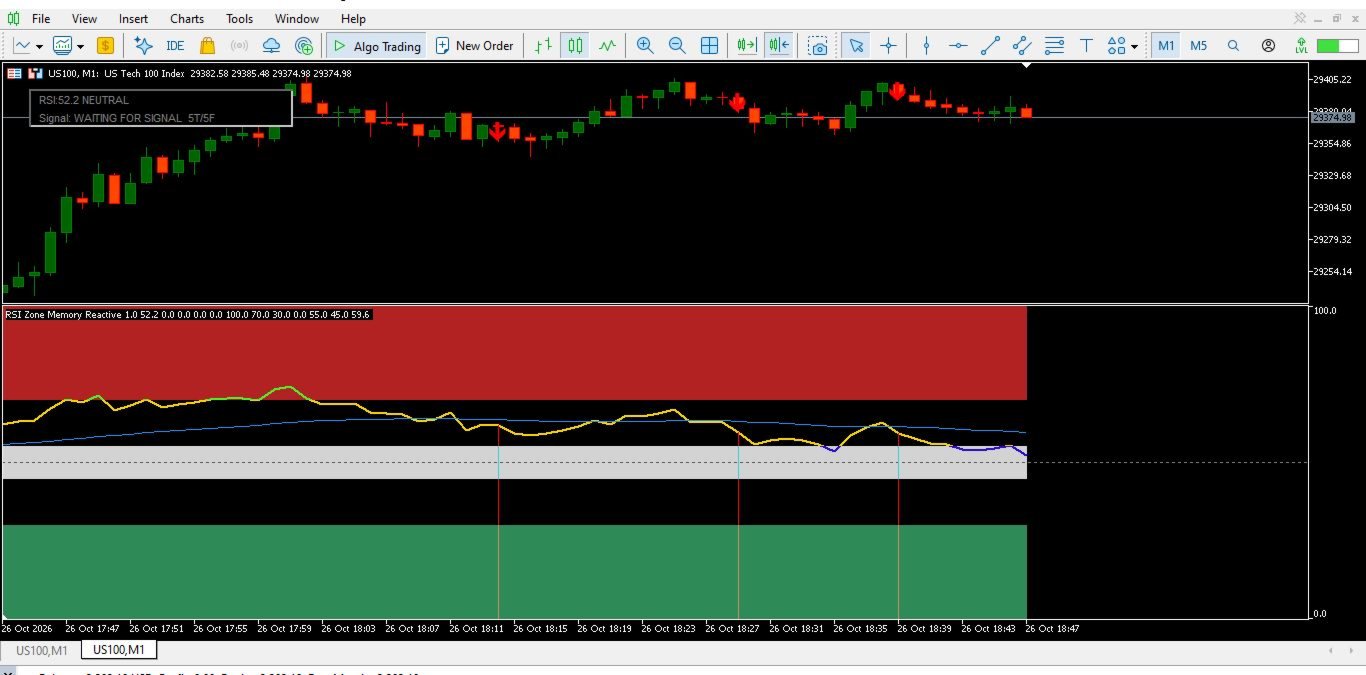
It displays RSI-based buy and sell signals, double-top and double-bottom patterns, momentum information, and a chart information panel.

Key Features

RSI Analysis

Uses a 21-period RSI with configurable overbought, oversold, and neutral-zone logic defined by the indicator.

RSI Memory System

Records selected RSI highs above 60 and lows below 40. The memory system compares new extremes with previously stored levels and maintains a configurable number of historical reference values.

Buy and Sell Signals

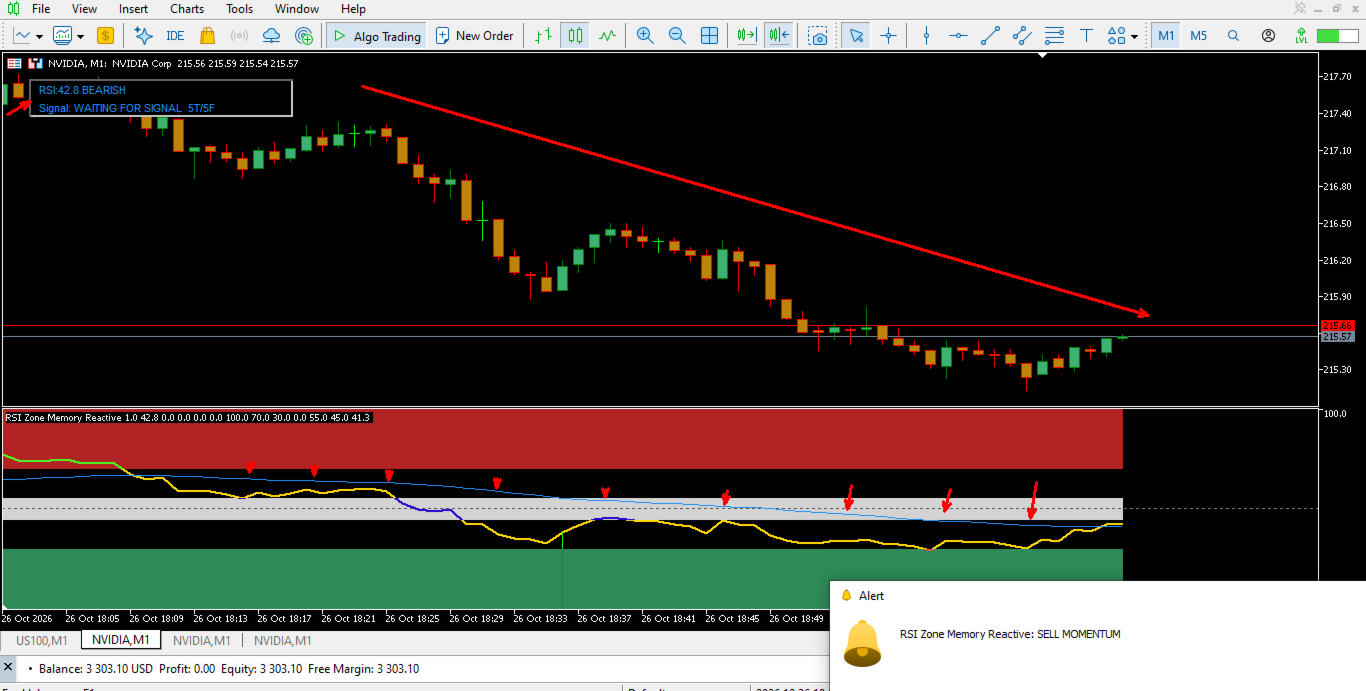
Identifies potential buy and sell setups when the RSI changes direction near a memorized extreme level. Signals are evaluated using the indicator's momentum and trend conditions.

Double-Top and Double-Bottom Detection

Identifies potential repeated RSI extremes, with additional conditions for stronger signals when the RSI reaches the overbought or oversold areas.

Momentum Analysis

Measures the RSI change over three bars to identify stronger upward or downward momentum.

Trend Filter

Uses a 50-period exponential moving average of the RSI to evaluate the direction of the oscillator and filter certain counter-trend signals.

Overbought, Oversold, and Neutral Zones

Displays the main RSI reference areas and identifies relatively compressed RSI movement within the neutral region.

Chart Signals and Alerts

Displays buy and sell arrows on the main price chart and provides configurable alerts when qualifying signals are detected.

Information Panel

Shows the current RSI value, market status, signal information, and the number of stored tops and bottoms.

Customization

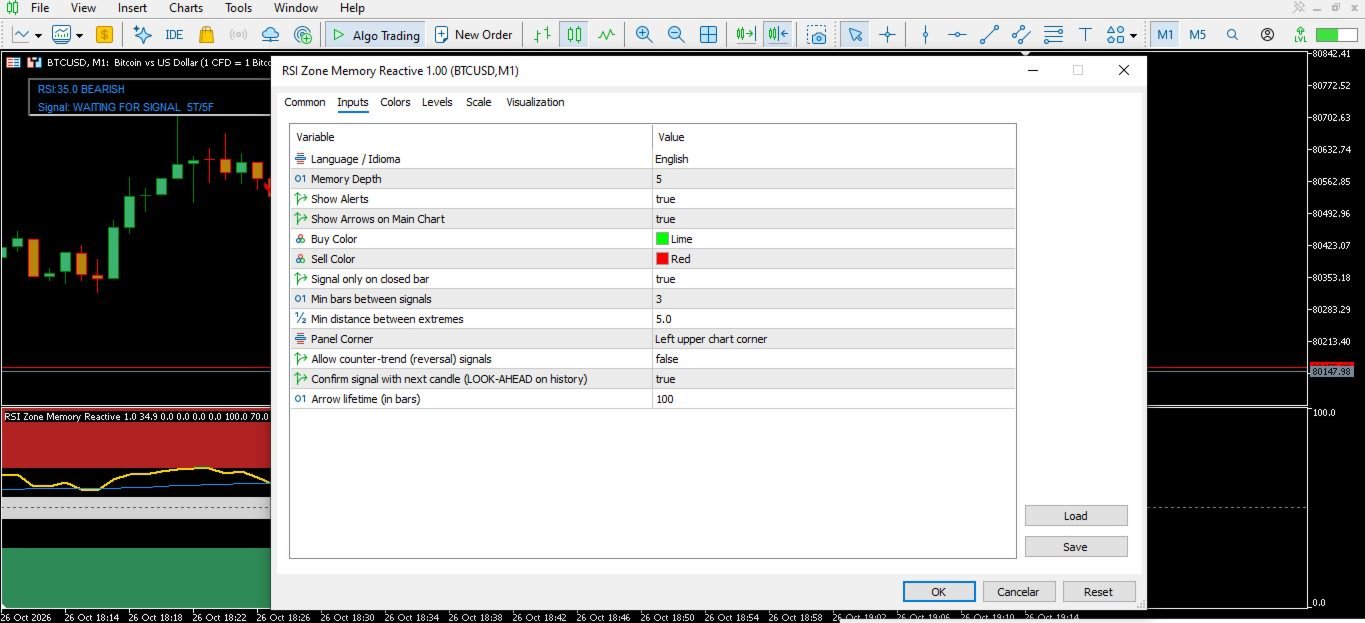
The indicator includes configurable settings for:

  • RSI memory depth.

  • Buy and sell signal colors.

  • Chart arrows.

  • Signal alerts.

  • Minimum bars between signals.

  • Minimum distance between recorded RSI extremes.

  • Counter-trend signal filtering.

  • Optional next-candle confirmation.

  • Arrow lifetime on the chart.

  • Information panel position.

  • English and Portuguese interface messages.

How It Works

The indicator evaluates RSI behavior in several stages.

First, it identifies local RSI highs and lows that meet its recording conditions. These values are stored as reference levels.

Next, it monitors the RSI for a return to a previously recorded level. Potential signals are evaluated using RSI direction, momentum, the trend filter, and the configured signal conditions.

When the required conditions are satisfied, the indicator can display a signal in its separate window, draw an arrow on the main chart, and issue an alert.

The memory system, momentum filter, and trend filter are designed to complement conventional RSI analysis rather than replace independent market analysis.

Who Is It For?

RSI Zone Memory Reactive is intended for traders who use technical analysis and want to study RSI extremes, momentum changes, repeated oscillator highs and lows, and potential reversal setups.

It can be used as an additional analytical tool alongside price action, support and resistance, and other technical indicators.

Important Information

RSI Zone Memory Reactive is an analytical indicator, not an automated trading robot. It does not execute trades or guarantee trading results.

Signals are technical conditions, not predictions of certain market movements. Market conditions can change, and signals may fail.

The optional next-candle confirmation uses subsequent candle data when evaluating historical signals. Historical signal placement should therefore be interpreted with this behavior in mind.

Always evaluate the indicator under your own trading conditions and apply appropriate risk management.

Mais do autor
QuantumTrade Panel
Joas Da Silva Veiga
5 (2)
tendência,análise de tendência,sinais,alertas,painel de trading,painel visual,contexto de mercado,scalping,intraday,day trade,swing trade,não repinta,sem repintura,gestão de risco,risco retorno,suporte resistência,zonas de oferta demanda,pressão de compra venda,forex,cripto,multi timeframe O painel é uma ferramenta avançada de leitura de mercado que transforma dados de preço e volume em sinais claros de tendência, pressão compradora/vendedora e projeções objetivas de trade — tudo centralizado
FREE
Painel de negociacao,Boleta operacional,Trading manual,Gestor de trades,Gestao de risco,Gestao de ordens,Stop Loss virtual,Take Profit virtual,Fechamento parcial,Scalping Importante Para que a ferramenta funcione corretamente, é obrigatório ativar a opção "Algo Trading" nas configurações do MetaTrader 5. Sem esta ativação, o painel não funcionará. O JoPanel Prime é um painel de trading manual para MetaTrader 5. Ele foi desenvolvido para executar ordens e gerenciar posições com agilidade, sub
FREE
Dual Clock Pro
Joas Da Silva Veiga
clock,  Server Time, Local Time, MT5 Clock, Clock Indicator, Digital Clock DualClockPro - Local and Server Clock for MetaTrader 5 DualClockPro is a visual clock indicator for MetaTrader 5 that displays local computer time and trading server time directly on the chart. It also supports displaying the corresponding dates, helping traders monitor time differences between their local environment and the broker's server. The panel has a compact design and customizable settings, allowing users to ada
FREE
Boleta, Painel de negociação, Gestão de risco, Negociação manual, Trailing Stop, Gestão de ordens, Execução rápida — JoOrderTrade Pro — painel de execução para MetaTrader 5 JoOrderTrade Pro é um painel gráfico completo para execução manual de ordens e gestão avançada de risco no MetaTrader 5. Ele substitui as janelas nativas da plataforma por uma interface limpa, responsiva e otimizada para desempenho, proporcionando maior precisão e controle durante as operações. O produto não é um robô de neg
RSI Trend Color
Joas Da Silva Veiga
RSI Colorido , Cores de Candles , RSI Candles , Indicador de Cores ,  Sinal Visual RSI , Análise Visual , Indicador Candle , Tendência por Cor O que faz O RSI Trend Color é um indicador visual inteligente que transforma a leitura do RSI em cores diretamente no gráfico de candles. Ele colore os candles automaticamente: Azul : RSI na área de sobrevenda Laranja : RSI na área de sobrecompra Branco : RSI na área neutra Recursos adicionais: Alertas sonoros e visuais quando o RSI toca níveis importan
FREE
top finder, bottom finder, market structure, price action, trend reversal, trend continuation, support resistance, swing high, swing low, frequency analysis, price projection, breakout detection, pullback trading, swing trading, market turning points EXPERIMENTAL VERSION – UNDER ACTIVE DEVELOPMENT Smart Top Bottom Finder is a market structure and frequency analysis indicator designed to identify potential tops and bottoms based on recurring price movement patterns. The indicator does not rely
FREE
tendencia,indicador de tendencia,momentum,oscilador,histograma,forca da tendencia,fluxo de mercado,confirmacao de tendencia,alta,baixa,analise tecnica,macd O Trend Flow Oscillator é um indicador de fluxo e momentum de mercado desenvolvido para ajudar o trader a identificar a força e a direção dos movimentos de forma clara, simples e com leitura visual rápida. É especialmente eficiente em gráficos de 5 minutos (M5), onde as mudanças de fluxo ocorrem com maior frequência. Funcionalidades Ident
FREE
Trend Zone Force
Joas Da Silva Veiga
5 (1)
tendência, pullback, indicador de tendência, volatilidade, atr, média móvel, ema, momentum, oscilador, fluxo de ordens, delta, trade em tendência, scalping, day trade, swing trade, price action Este indicador foi desenvolvido para leitura de tendência, identificação de pullbacks e análise objetiva do contexto de mercado. Ele combina médias móveis e volatilidade para criar zonas dinâmicas e fornecer uma interpretação clara da direção do preço. O objetivo é auxiliar o trader a operar alinhado co
trend indicator, momentum indicator, indicador de tendência, indicador de momentum, fluxo de mercado, bandas dinâmicas, MT5 indicator, scalping, day trade, swing trade, distância percentual, não repinta, multi timeframe, EMA trend, força da tendência TrendBands Momentum Ultra é um indicador de tendência e fluxo desenvolvido para ajudar o trader a visualizar a direção do mercado, a força do movimento e a distância do preço em relação à tendência. O indicador utiliza duas médias móveis exponencia
trend indicator, indicador de tendência, fluxo de mercado, força do mercado, momentum, reversão de tendência, scalping, price action, indicador MT5, análise técnica, forex, sinais de compra e venda, indicador de volatilidade, canais de preço, indicador profissional O Quantum Pulse Force é um indicador técnico para MetaTrader 5 desenvolvido para analisar a aceleração do movimento do preço, identificar fases de tendência e lateralização, e destacar pontos relevantes do mercado com base em múltip
indicador mt5, indicador de momentum, indicador de tendência, estratégia scalping, sinais de compra e venda, análise técnica, oscilador, suporte resistência, price action, breakout, estratégia forex, swing trading, reconhecimento de padrões, força do mercado, sinais de negociação O que é o MasterForce Pattern Panel O MasterForce Pattern Panel é uma ferramenta avançada para MetaTrader 5 que transforma dados brutos do mercado em padrões acionáveis de leitura de compra e venda. A ferramenta monit
Market Sentry
Joas Da Silva Veiga
Market Analysis, Market Structure, Price Action, Trend Analysis, Bullish, Bearish, Range Market, Directional Bias, Market Dashboard, Trading Dashboard, Trend Detection, Market Scanner, Market Context, Breakout Analysis, Consolidation Analysis, Trend Filter, Technical Analysis, Real Time Analysis This indicator analyzes price behavior in real time and classifies market conditions into Bullish , Bearish , Range , and Neutral scenarios. Price is continuously evaluated relative to a dynamic referen
Time and Sales, Time and Sales Indicator, Tape Reading, Pressure Book, Buy Sell Pressure, Tick Analysis, Market Pressure, Tick Data, Price Movement Analysis, Tick Strength, Momentum Analysis, Buy Sell Movement, Movement Sequences, Real-Time Tick Monitor, Trading Dashboard, Points Analysis, Customizable Alerts, MT5 Indicator Pressure Book - Tick Analysis and Buy/Sell Pressure Indicator for MT5 Pressure Book is a MetaTrader 5 indicator designed to monitor tick-based price movements and display es
Flow Pressure Histogram, Market Flow Indicator, Probability Indicator, Trend Detection, Ranging Detection, Multi-Filter Indicator, Volatility Thermometer, Pattern Recognition, Breakout Alert, Momentum Indicator, Market Pressure, Buy Sell Pressure, Signal Indicator, MT5 Indicator, Forex Indicator Flow Pressure Histogram The Multi-Layer Market Flow Indicator for MT5 Flow Pressure Histogram is an advanced technical indicator that visualizes real-time buying and selling pressure as a color-coded h
Filtro:
Sem comentários
Responder ao comentário