Nexus Order Block Workspace

5

The same chart, read in the same order, every day.
Structure, the nearest zone, where you sit in the range and which way the trend points — on screen at once, always in the same form.

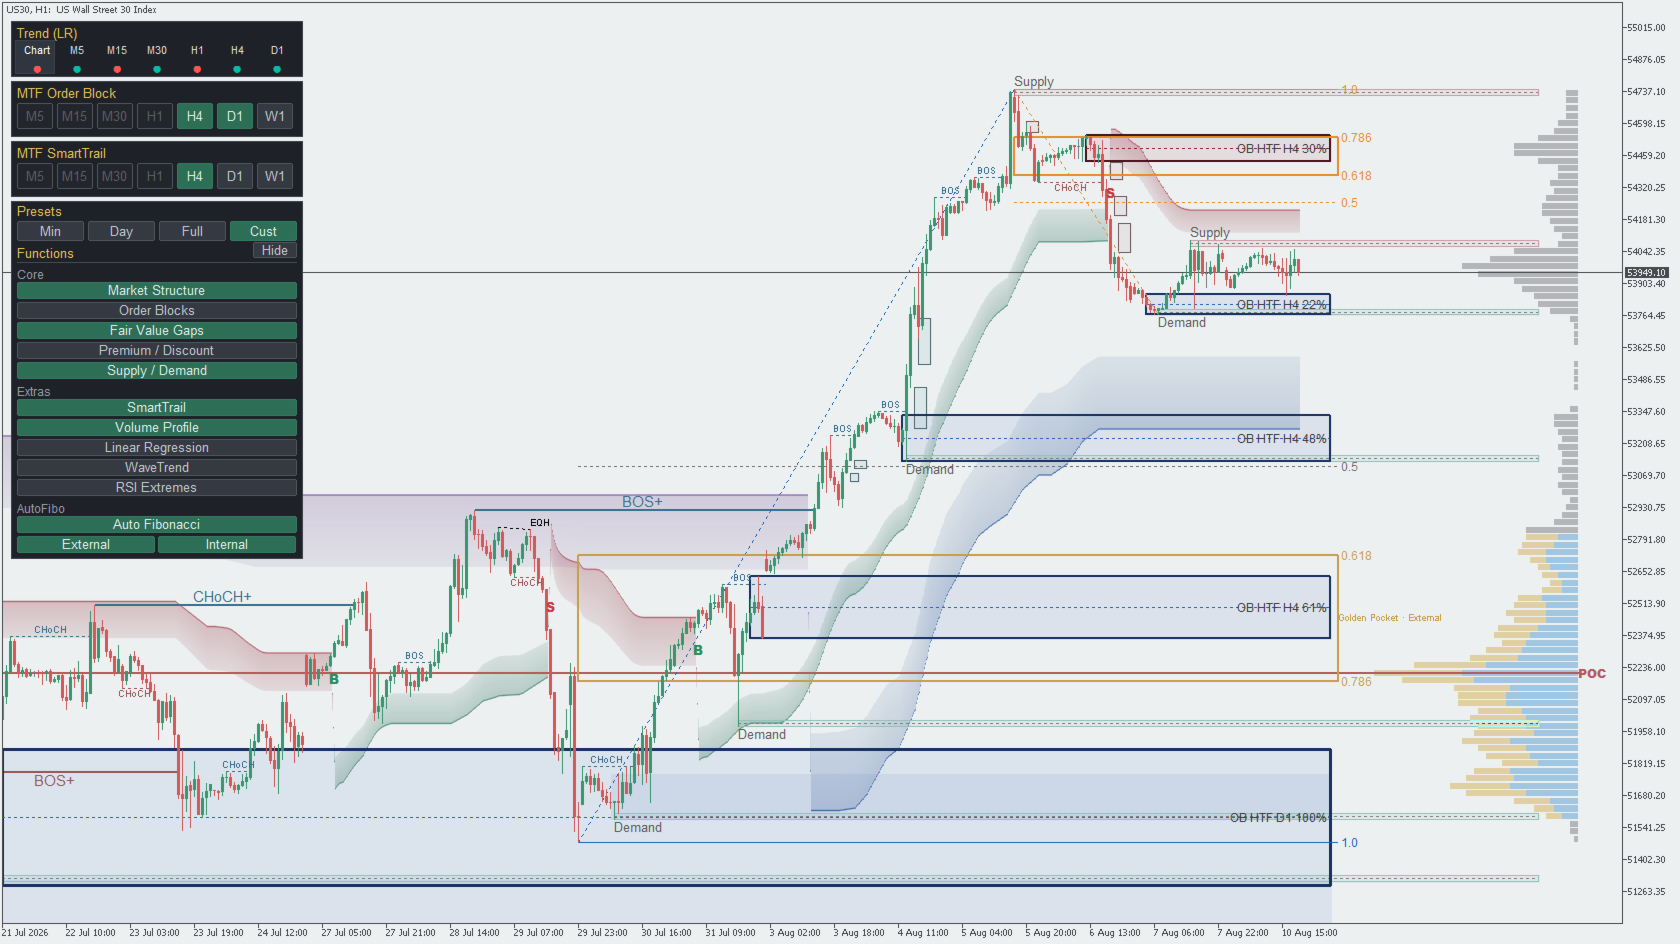
Fourteen layers under one panel: market structure with BOS and CHoCH, order blocks with a strength percentage, fair value gaps, supply and demand, higher-timeframe order blocks, and the context tools most charts need a second indicator for — Volume Profile, Linear Regression, a multi-timeframe Trend Dashboard, Auto Fibonacci on the last structure break, SmartTrail, WaveTrend and RSI Extremes.

That constant order is what separates a process from improvisation — the kind where Monday you wait for the zone, Tuesday you buy the first touch, and Wednesday you widen the stop because the zone looked too wide.

The tool does two things about that. It draws levels that stay where they printed, and it fixes the order in which you check them. Where exactly your own "buy here" shows up is your call, out of the combination: which zone, where in the range, on what confirmation, and which way the trail is pointing while it happens. Working those combinations out once is precisely the job this indicator makes manageable. Holding to your own rules on a bad afternoon is still your part; no software has ever done that one for anyone.

So what follows is not a feature list. It is the working day this indicator is built around.

— WHO THIS IS FOR —

  • The intraday trader on M1–M15. Structure, the nearest order block and the side of the trend on one screen — with no manual redrawing of levels before every session.
  • The swing trader who builds context first. Zones from H1, H4 and D1 arrive on your working chart by themselves, so you are not switching timeframes just to mark up.
  • The EA developer. A documented 25-buffer contract instead of writing structure and zone detection from scratch.

— YOUR TRADING DAY, IN SIX STEPS —

  1. Read the bias, before you look at price. Open H4. The trend dashboard shows regression bias per timeframe; market structure shows whether the last confirmed break was a BOS (the dominant side still in control) or a CHoCH (it just lost a level). You decide one thing here: which direction you are allowed to look for entries today.
  2. Mark the higher-timeframe zones. Set the MTF order-block selector to H4 or D1. Those are the areas that matter today. Add supply and demand for the wider bands. Where an order block sits inside a supply/demand band, you have your best area of the day.
  3. Check where you are in the range. Premium/discount, thirty seconds. This is not a rule that says buy only in discount — it answers how much of the range has already been spent. If you enter from zones, the point is not to buy right under the ceiling of the range. If you trade breakouts the conclusion is the exact opposite: it gets interesting where price leaves the boundary, and equilibrium becomes the line past which a pullback stops being a pullback. One band, two readings — what you trade decides which one applies.
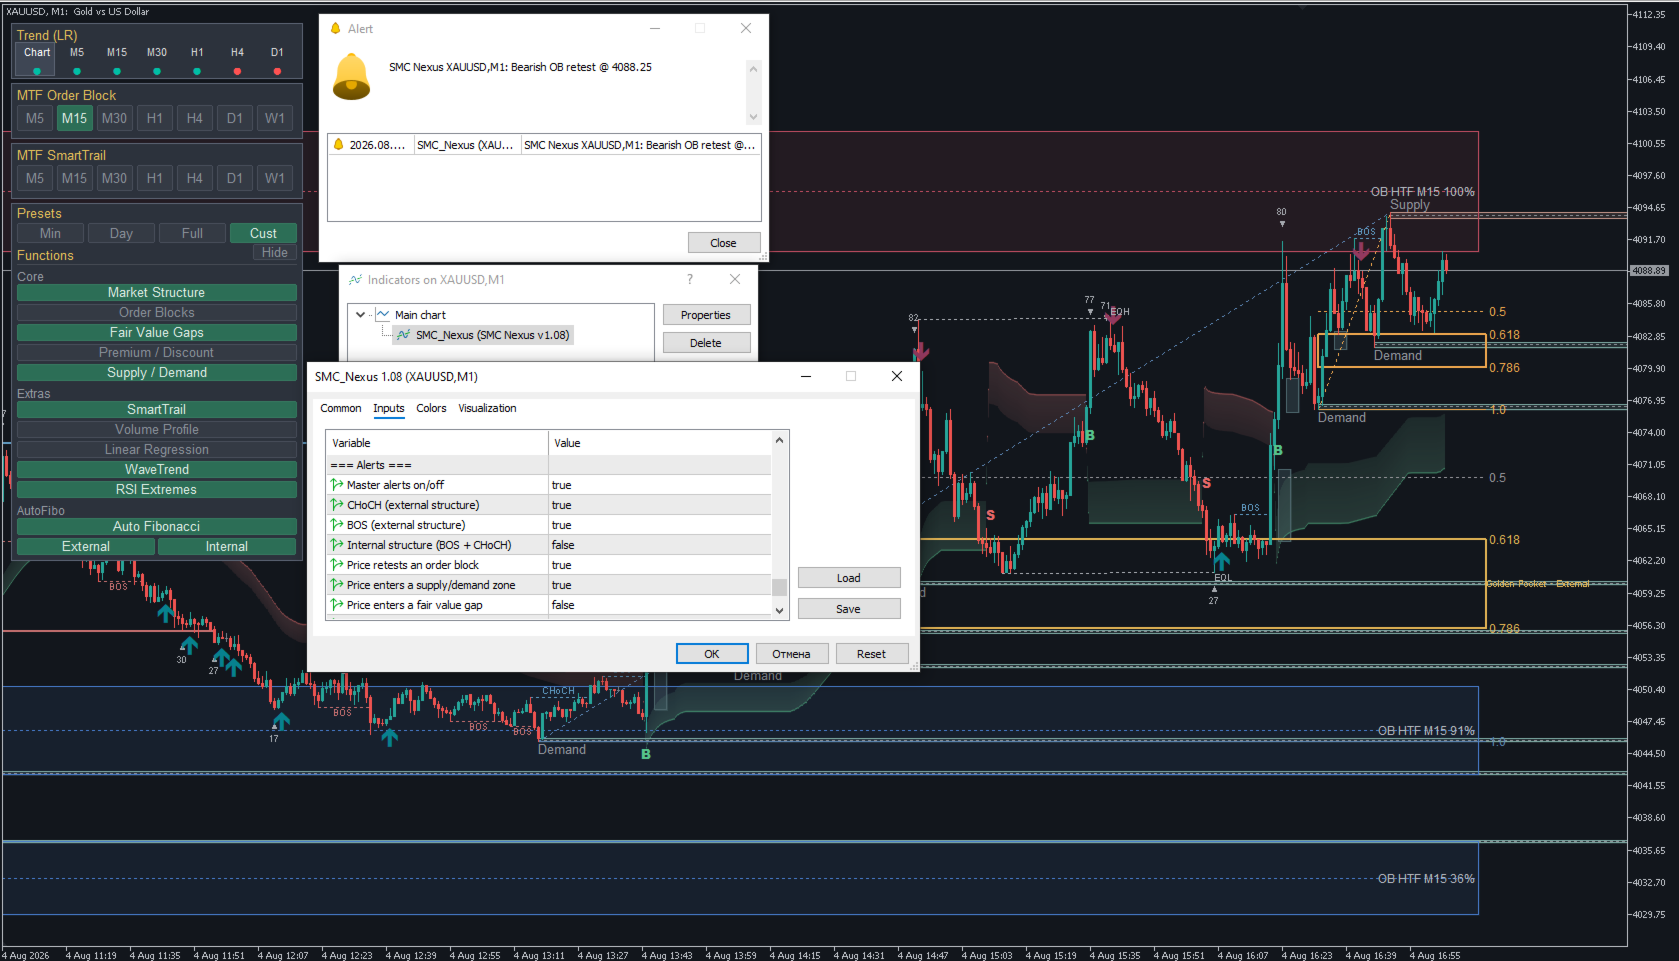
  4. Drop to the entry timeframe and stop watching. M15 or M5, higher-timeframe zones still on the chart. From here you do not need to sit in front of the screen: set the order-block retest and supply/demand touch alerts, and the terminal calls you when price actually arrives. Alerts fire on closed bars only, so nothing pings you on a wick that gets taken straight back.
  5. Demand confirmation inside the zone. Price arriving is an invitation to look, not a signal. Take the trade when the market agrees: an internal CHoCH inside the zone, a fair value gap on the reaction away, the zone overlapping the Fibonacci golden pocket, or a high strength percentage on the block itself.
  6. Let the zone place your stop. Beyond the far edge of the zone you entered from: while price holds inside the zone your read is alive, and leaving that far edge is the one event after which it is not. Not "you were wrong" — the zone simply did not hold, and arguing with that costs more than stepping out. First target is the nearest opposing order block or the range equilibrium, then the range extreme.
    There is a second way to carry a stop: the SmartTrail cloud. Its level moves only in the direction of the trade and changes side when a bar closes beyond it. A structural stop holds on to a level, a trail holds on to volatility. Which of the two suits you depends on what you trade, not on which one is "correct".

That is the whole method. Everything below is the machinery that makes those six steps take five minutes instead of forty.

— WHAT MAKES THIS ONE DIFFERENT —

  • Non-repainting structure. BOS and CHoCH are confirmed on closed bars only. A level that printed yesterday still sits exactly where it printed. You can verify that on the very first chart you attach it to.
  • Closed-bar alerts with anti-spam. One alert per event, a throttle on zone touches, and silence on load, on timeframe changes and on terminal restarts. No alert storm on a busy M1 chart.
  • Twenty-five iCustom buffers. Every level an Expert Advisor could want, on a documented, stable contract. Buffers are computed whether or not the layer is visible on screen. The extension to 25 was appended at the end: buffers 0–20 did not change, so an EA written against the previous version runs without a single edit.
  • One workspace instead of six indicators. Structure, order blocks, gaps, zones, range, trail and Fibonacci on one chart, driven from one panel, with presets that switch the whole layout in a click.

LAUNCH PRICE $39. The price moves to $79 after the next 30 purchases. It is counted, not a rolling banner: when it gets there, it goes up.

AFTER YOU BUY
Message me on MQL5 and I will send you the buyer kit: the full PDF manual, the zone-reading playbook with the six-step process and a pre-trade checklist, and four ready presets for scalping, intraday, swing and clean-structure charts. I answer these myself, so that message is also the fastest route to me if anything is unclear.

— CORE STRUCTURE & LIQUIDITY —

  • Market Structure — dual level (internal + external) BOS and CHoCH, labelled and colour-coded, with EQH/EQL liquidity marks.
  • Order Blocks — displacement + imbalance detection, mitigation logic, mid-line and a strength % label.
  • Fair Value Gaps — 2-bar imbalance gaps, selectable timeframe (current or higher).
  • Premium / Discount — live dealing-range envelope with equilibrium (50%).
  • Supply / Demand — pivot-based zones plus a broken-zone (POI) history.

What that strength percentage actually measures, and why it changes when the block itself has not: What the percentage on an order block actually means — in my blog here on MQL5.

— MULTI-TIMEFRAME & CONTEXT —

  • MTF Order Blocks — higher-timeframe order blocks drawn on your chart. On-chart selector M5 / M15 / M30 / H1 / H4 / D1 / W1 (multi-select — view several HTFs at once). M5 turns it into a genuine scalping tool on the M1 chart.
  • Trend dashboard — a multi-timeframe regression-bias strip (up / down / flat per timeframe).

— SMARTTRAIL: A VOLATILITY TRAIL AND B / S MARKS —

A volatility trailing stop drawn as a cloud: the band between the stop level and the 0.786 retracement of the leg from the last reversal. The level moves only in the direction of the trend and changes side when a bar closes beyond it — meaning it never steps back into a trade you have already carried.

  • B and S — marks on the bar where the trail changed side. They print on closed bars only and never move afterwards: the mark you saw in the morning is still on the same bar in the evening.
  • Three styles — Scalp, Intraday, Swing (ATR factor 2 / 4 / 6). The ATR period, the smoothing and the timeframe the trail is computed on are all set separately.
  • MTF SmartTrail — the same engine from higher timeframes, in its own colour, as a context layer beneath the trail of your working timeframe. The selector takes three timeframes at once and stops there deliberately: a fourth cloud stops adding context and starts covering the chart.
  • Alert on the side change — part of the working set and on out of the box.

There is no separate trail line on the chart, and that is on purpose: the level reads off the cloud boundary, and the event is the change of side — which is what the letters are for.

— VOLUME PROFILE, REGRESSION AND OSCILLATORS —

  • Volume Profile — histogram, POC and 68% value area.
  • Linear Regression Channel — regression mid-line + deviation bands, direction-coloured.
  • WaveTrend — reversal signals on the price.
  • RSI Extremes — overbought / oversold exhaustion marks.

— AUTO-FIBONACCI —

Auto-anchored to the last confirmed structure break and following the live leg. The External grid is always shown and highlights its own golden 0.618–0.786 pocket (the exact band the optional golden-pocket alert watches). One click adds the Internal overlay — the trade grid, with bright orange levels and its own pocket box — so you instantly see where to manage a trade toward the next order block.

— ONE PANEL, THREE PRESETS —

An on-chart control panel groups every layer into Core, Extras and AutoFibo sections with one-click toggles, plus three presets:

  • Minimal — the default view on first launch: market structure with EQH/EQL, order blocks, fair value gaps, SmartTrail, Auto-Fibonacci with the golden pocket and the multi-timeframe trend dashboard. Clean — but you immediately see which way the market is going and where you are getting out.
  • Intraday — the day-trading and scalping kit: adds MTF order blocks, supply/demand, premium/discount and the volume profile.
  • Full — everything on for analysis and planning.

Any manual toggle drops you into a Custom layout, and your layout is remembered between timeframe changes and terminal restarts. A compact mode collapses the panel to just the presets.

— ALERTS (CLOSED-BAR, NO REPAINT) —

Fire an alert the moment a setup confirms — on closed bars only. Out of the box (the "Core" working set):

  • Structure — Bullish / Bearish CHoCH and BOS (internal structure optional).
  • Order-block retest — price returns into an active order block.
  • Supply / Demand touch — price enters a working zone.
  • SmartTrail side change — the trail has turned and a B or S mark printed on the bar.
  • Optional: Fair Value Gap and Fibonacci golden-pocket entries.

Delivery: terminal popup, mobile push, sound and email — each independently toggled. Built-in anti-spam (one alert per event, throttle on zone touches) means no alert storm on load or on a busy M1 chart, and an optional bar-close-time stamp lets you cross-check each alert against the candle. Example: SMC Nexus XAUUSD,M1: Bullish OB retest @ 4032.84

Tip: MetaTrader delivers push notifications no matter which chart is in front. To watch more markets, attach the indicator to a background chart per symbol (e.g. EURUSD M15, BTCUSD M15) with alerts on — you'll get their push alerts while another chart stays in focus.

— LIGHT & DARK THEMES —

Auto (adapts to your chart), Light or Dark — the palette re-balances for each so zones, bands and labels stay readable on any background.

— FOR EA DEVELOPERS (iCustom-READY) —

Every level is published on 25 indicator buffers. Buffers 0–20 carry structure direction, BOS/CHoCH signals, order-block / FVG / supply-demand zone bounds and the dealing-range high / equilibrium / low. Buffers 21–24 were added in this version for SmartTrail: stop level, far cloud edge, line and side. The buffers are computed regardless of what is shown visually, so your Expert Advisor reads structure and zones directly via CopyBuffer, independent of the on-chart panel. (Buffer map is documented in the indicator header and in the buyer-kit manual.)

Compatibility. The new buffers are appended strictly at the end and indices 0–20 are unchanged — an EA written against the previous version keeps working with no edits.

Buffer coverage — read this before you build on it. Structure buffers (0–5: direction, BOS, CHoCH) are calculated over the full chart history. Zone buffers (6–20: order blocks, FVG, premium/discount, supply/demand) are populated within the drawing window (input InpDrawBars, 1500 bars by default) — beyond that window they read 0. Raise InpDrawBars if your EA needs zones deeper into history.
Buffers 0–20 are available everywhere, including optimisation mode. The SmartTrail buffers (21–24) are populated on a live chart and in a single test, but not in optimisation: there the indicator computes the structural part only and skips drawing entirely — otherwise a reused optimiser agent stalls on the heavy iCustom call.

— WHAT THIS IS NOT —

  • It is not an Expert Advisor. The indicator does not open, modify or close trades.
  • B and S are not a recommendation to buy or sell. They mark the bar on which the trail changed side, and nothing beyond that.
  • It is not repainting. Structure is confirmed on closed bars; zones extend forward as price develops — that is by design, not a drawn level moving.
  • It is not a forecast. No layer computes a probability or promises an outcome. The tool shows what has already happened on the chart, in the same order every day.

FIRST LOAD ON A NEW SYMBOL — PLEASE READ

The first time you attach the indicator to a new symbol, MetaTrader downloads that symbol's history in chunks. During this one-time sync the indicator shows a "loading a fresh symbol" panel (with a live bar counter) instead of drawing on incomplete data — this can take about 1–3 minutes on a slow connection. After the history is in place it is instant, and switching timeframes is instant. This is normal MetaTrader behaviour, not a bug — the panel simply makes the wait visible.

— WANT TO TRY THE ENGINE FIRST? —

The structure core of this product is available free on the Market as SMC Nexus Market Structure: the same non-repainting BOS / CHoCH (internal + external), EQH / EQL, order blocks with strength %, light & dark themes and 6 iCustom buffers. This workspace adds what the free core deliberately leaves out — MTF order blocks (7 timeframes), FVG, supply/demand, premium/discount, SmartTrail with B / S marks and its multi-timeframe layer, Auto-Fibonacci with the golden pocket, volume profile, linear regression, WaveTrend, RSI extremes, closed-bar alerts, the control panel with presets, and the full 25-buffer iCustom contract. An EA written against the free indicator runs on this one unchanged — the buffer indices match.

RECOMMENDED USE

Works on any symbol and timeframe. It starts in the Minimal preset — a clean chart you build up from the panel; higher timeframes may benefit from a larger structure length. This is an analytical framework — not financial advice and not a signals-only "buy/sell" product.

리뷰 2
Alex71
78
Alex71 2026.10.03 09:32 

The developer didn't just blindly follow the program's creation; he delved into the essence of what people need for successful trading and created an excellent product that helps achieve positive results. The program works quickly, reliably, and without glitches. The interface and manual are intuitive. I'd also like to point out the excellent communication: the developer is always available and promptly responds to questions. I'm not a professional trader, but this program makes my charting experience completely different, and it's incredibly helpful. I've previously installed both free and paid programs. For me, it's 5*.

happy7840
39
happy7840 2026.09.29 17:04 

Finding concise SMC education is usually hard, but the included manual and playbook deliver the essentials without any fluff. Combined with the visual workspace, I was able to put SMC into practice right away. Truly grateful for this tool!

추천 제품
Marca Dagua
Erison Francisco De Sales
3 (1)
Adiciona marca d'água com nome do ativo em negociação. Pode ser ajustado definindo tamanho da fonte e coloração do texto. Testado com vários ativos do mercado B3 e Forex  Adione ao gráfico e configure de acordo com a necessidade. Caso tenha problemas sinta-se a-vontade para nos avisar e providenciaremos a correção logo que possível. ______________________________
FREE
Displays trends in current chart. You can display trends of multiple timeframes in one chart by inserting this indicator as often as you want. Key features: displays trend line by finding highs and lows counts number of high/low of current trend in different color (long/short) allows you to display multiple timeframe trends in one chart Settings: Indicator Name: if you want to show M5 and H1 on one chart add TITrend twice to your current chart and rename M5 to "TITrendM5" and H1 to "TITrendH1" C

Cybertrade Auto Fibonacci
Emanuel Andriato
4.9 (10)
Cybertrade Auto Fibonacci retraction and projection  - MT5 Auto Fibonacci is an indicator that automatically plots the Fibonacci retracement and projection based on the number of bars you select in the indicator setting. You can customize nine different levels of retraction and three levels of projection. It works on periods longer than the period visible on the chart. All values ​​are available in the form of buffers to simplify possible automations. This indicator is the same one we use in ou
FREE
Anchored Linear Regression Channel
Jorge Adalberto Do Valle Junior
English: Anchored Linear Regression Channel (ALRC) Description: The Anchored Linear Regression Channel (ALRC) is an advanced technical analysis tool that enhances the traditional linear regression channel by allowing it to be anchored to a confirmed pivot point. This provides a more accurate and reliable reading of price behavior in relation to key structural points on the chart. Key Features: Anchoring to Confirmed Pivots: Manually select a significant pivot to fix the channel, ensuring t
Pivot Point Fibo RSJ
JETINVEST
4.41 (22)
피봇 포인트 Fibo RSJ는 피보나치 비율을 사용하여 당일의 지지선과 저항선을 추적하는 지표입니다. 이 멋진 지표는 피보나치 비율을 사용하여 피벗 포인트를 통해 최대 7단계의 지지와 저항을 생성합니다. 가격이 작업의 가능한 진입/종료 지점을 인식할 수 있는 이 지원 및 저항의 각 수준을 어떻게 존중하는지 환상적입니다. 특징 최대 7단계 지원 및 7단계 저항 레벨의 색상을 개별적으로 설정 입력 피벗 유형 피벗 피보 RSJ1 = 피보 비율 1 계산 피벗 피보 RSJ2 = 피보 비율 2 계산 피벗 Fibo RSJ3 = Fibo 비율 3 계산 피벗 피보 클래식 = 클래식 피벗 계산 최소 피벗 수준 피벗 3 레벨 피벗 4 레벨 피벗 5 레벨 6단계 피벗 피벗 7 레벨 여전히 질문이 있는 경우 다이렉트 메시지로 저에게 연락하십시오: https://www.mql5.com/ko/users/robsjunqueira/
FREE
SharperTrader Sync Indicator
Valeri Colisse Dos Santos Dieizo
SharperTrader Sync Indicator SharperTrader Sync Indicator was developed for traders seeking a professional and organized interface. It allows you to keep your price chart completely clean in one window while distributing your indicators and oscillators across separate windows, keeping them all 100% synchronized. Key Features: Clean Chart Focus: Trade with a clutter-free price chart by moving your oscillators to secondary windows without losing the connection between them. Symbol & Timeframe Sync
Dual Trend Analyzer
Elidio Xavier Guimaraes
The Dual Trend Analyzer: An MQL5 Tool for Statistical Correlation Analysis The Dual Trend Analyzer is a powerful MQL5 tool developed to analyze and visualize the statistical correlation between two distinct financial symbols (assets). This tool allows you to choose from three of the most widely recognized correlation methods: Pearson, Spearman, or Kendall-Tau . Identify Correlation Patterns with the Dual Trend Analyzer This indicator is designed to unveil the statistical correlation between two
Perfect indicator to use No Forex or Binary Options You can use it manually or use it automated on the mt2trading platform or similar 90% winrate indicator Common questions Which brokers does this work with? IQOption.com Binary.com Alpari.com Specter.ai Instaforex.com clmforex.com GCOption.com Is it necessary to leave my pc on all day using automated mode? > although our platform must constantly run on your laptop / PC, if you want it to work while you are away, it is not necessary to leave your
Divergentes
Dion Lima Dasilva
Descrição Este Expert Advisor (EA) implementa uma estratégia baseada na divergência de preços entre o mini dólar (WDO$N) e o dólar cheio (DOL$N). Ele monitora, segundos antes da abertura do mercado ou ao longo do dia (conforme o modo escolhido), possíveis discrepâncias entre esses dois ativos e efetua ordens no mini dólar, apostando na convergência futura. Principais Recursos Divergência Mínima Configurável: A estratégia utiliza um parâmetro de divergência mínima de 10 pontos, ajustável de acor
FREE
My Pivot
Ashok Kumar Singha
My Pivot is an Indicator based on Pivot Lines and Support-Resistance zones. This Indicator will Plot 11 SR zones including Pivot Line which will definitely help you to understand the exact SR zones of the Market. Steps to Setup the Indicator: Install the Custom Indicator; Set all the Lines Color, Width and Styles; Set visualization to All Timeframe; and DONE It can be used for: All Pairs: Forex, Cryptocurrencies, Metals, Stocks, Indices.  All Timeframe All Brokers All type of Trading S
BlueDigitsFx 공식 에코시스템 접근 공식 BlueDigitsFx 에코시스템을 통해 인프라 업데이트, 워크플로우 리소스, 제품 출시 및 에코시스템 접근 권한을 받으세요. Telegram 에코시스템 웹사이트 BlueDigitsFx Precision Order Flow MT5 — MetaTrader 5 완전한 오더플로우 분석 스위트 밸류 에어리어, Point of Control, 경매 컨텍스트, 구조화된 의사결정 지원을 결합한 진지한 MT5 트레이더를 위한 전문적인 세션 기반 시장 구조 프레임워크. 가치가 위치한 곳을 파악하세요 VAH, POC, VAL을 자동으로 모니터링하세요 London 및 New York 세션 구조를 이해하세요 구조화된 시장 컨텍스트로 의사결정 피로를 줄이세요 MetaTrader 5 트레이더를 위해 특별히 설계되었습니다 개발자의 메시지 저는 MetaTrader 5 내에서 세션 구조를 더 명확하게 읽고 싶어서 Precision Order Flow를 개발했습
GDXM Multi Symbol Comparisson Window
Gustavo Barros Alexandre D Almeida
GDXM Multi Symbol Comparisson Window The Multi Symbol Correlation Oscillator GDXM is a precision tool engineered for institutional traders and Smart Money Concepts (SMC) practitioners. This version operates in a separate window, transforming the price action of up to 5 assets into a normalized 0–100% efficiency scale. It is the perfect solution for identifying high-probability divergences without cluttering your main price chart. There is a version for the main chart . By isolating asset moveme
FREE
Suporte e Resistencia Agil
Renato Aparecido Braguini
️ Aviso de Risco Negociar no mercado financeiro envolve riscos significativos. Esta ferramenta é um auxílio à tomada de decisão e não garante lucros. Opere com responsabilidade e sempre com gerenciamento de risco adequado. Caracteristicas deste Super Indicador de Topos e Fundos : - Analisa as últimas barras (configurável) e detecta topos e fundos; - Agrupa pivôs próximos em um único nível, usando uma tolerância baseada no range médio das barras.; - Níveis abaixo do preço atual viram suportes e
FREE
High Low Open Close
Alexandre Borela
4.98 (45)
이 프로젝트를 좋아한다면 5 스타 리뷰를 남겨주세요. 이 지표는 열리고, 높은, 낮은 및 마감 가격을 지정합니다. 기간과 그것은 특정한 시간대를 위해 조정될 수 있습니다. 이들은 많은 기관 및 전문가에 의해 보는 중요한 수준입니다 상인은 당신이 더 많은 것일 수있는 장소를 알고 도움이 될 수 있습니다 이름 * 사용 가능한 기간: 이전 날. 이전 주. 지난 달. 이전 분기. 이전 연도. 또는: 현재 날. 현재 주. 현재 달. 현재 분기. 현재 년.
FREE
Ma ultra Trend
Johnny Da Silva
My Products: View My Products My Profile / Support / Contact: Visit My Profile My Channel: Follow My Channel MA Ultra Trend is a professional technical indicator for MetaTrader 5 designed to help traders identify market trend, momentum shifts, pullback opportunities and potential reversal points through a combination of a configurable Moving Average and a normalized oscillator. Instead of relying on a single traditional indicator, MA Ultra Trend combines trend direction + oscillator momentu
FREE
Regression Channel Pro
Hipolito Garcia Gilvan
Regression Channel Pro is an advanced trend-following indicator that automatically draws a dynamic linear regression channel on your chart and generates precise buy and sell signals based on price interaction with the channel boundaries. Unlike most signal indicators, Regression Channel Pro uses a multi-confirmation logic that reduces signal repaint by up to 90%, giving you reliable, actionable entries in real time. HOW IT WORKS The indicator ca
FREE
Candle Timer Zakirulbd
Mohammad Zakirul Haque
Zakirulbd Candle Timer V7   Professional trader utilities. Minimal design. Maximum clarity. Zakirulbd Candle Timer V7 is a professional MT5 indicator designed to display the remaining time of the current candle directly on your chart in a clean, distraction-free format. One of the most common frustrations among traders is not knowing exactly how much time remains before a candle closes. Many traders moving from other platforms actively look for a reliable candle countdown timer before fully ado
FREE
Advanced Line Tools
Felipe Monteiro Rodrigues
Advanced Line Tools 는 MetaTrader 5에서 분석을 더욱 빠르고 정확하며 체계적으로 수행할 수 있도록 설계된 차트 구조 그리기 및 관리 도구입니다. 단순히 라인을 그리는 것을 넘어 캔들, 가격 및 차트의 주요 지점을 인식할 수 있는 대화형 구조를 만들 수 있습니다. 차트에 직접 표시되는 컴팩트한 인터페이스를 통해 MetaTrader 5의 기본 도구를 계속 전환하지 않고도 분석을 생성, 편집 및 관리할 수 있습니다. 주요 기능 고급 라인 시스템 Advanced Line Tools 패널을 통해 차트에 직접 라인을 생성할 수 있습니다. 생성된 구조는 직관적으로 선택하고 편집할 수 있습니다. 전체 라인 이동 시작점 조정 끝점 조정 길이 변경 참조를 유지하면서 구조 재배치 차트의 기존 라인 직접 편집 시각적 컨트롤은 필요할 때만 표시되어 차트를 깔끔하게 유지합니다. 고급 자석 기능 — Smart Anchoring 캔들 근처에 라인을 배치하면 Advanced Line To
AutoFibonacci draws Fibonacci retracement and extension levels automatically. It finds the significant swing high and low on the chart itself, so the levels appear without you drawing anything, and they update as new highs and lows form. Drawing Fibonacci by hand has a practical problem: you choose the swing. Two traders looking at the same chart pick different points and get different levels. This indicator removes that step. It works on any symbol and any timeframe. How the range is chosen Thr
FREE
Reversal Magnet Lines
Gleidson Duca De Aguiar
Launch price: 30 USD - price will increase after the first purchases, so early buyers lock in this rate. Reversal Magnet Lines plots the closing price of each of the last N trading days (configurable from 15 to 180 days) as horizontal lines directly on the chart. These prior-day close levels frequently act as short-term support and resistance, where price either reverses or breaks through with momentum. Based on an analysis of 52 trading days on JPN225, price interacted with these levels in mo
Multi Divergence MT5을 소개합니다. 이는 여러 지표에서 발산을 감지하여 시장 분석을 향상시키도록 설계된 고급 거래 지표입니다. 이 도구는 가격 추세에서 잠재적인 반전 및 지속을 식별하여 진입 및 퇴출 전략을 개선하려는 트레이더에게 이상적입니다. Multi Divergence MT5을 사용하면 시장 모멘텀의 변화를 나타내는 발산 신호를 신속하게 해석하여 거래에서 상당한 우위를 점할 수 있습니다. 경험이 풍부한 트레이더든 이제 막 시작하는 트레이더든, 이 지표는 실시간 시장 상황에서 정보에 기반한 결정을 내리는 데 도움이 되는 귀중한 통찰력을 제공합니다. MQL 제품 설치 가이드 | MT4/MT5에서 구매한 MQL 제품 업데이트 | 일반 문제 해결 가이드 | 지표 설정 / 가이드 주요 기능 다양한 지표 지원: RSI, CCI, MACD 등 다양한 지표를 활용하여 시장 모멘텀을 측정합니다. 매수/매도 신호 트리거: 발산 조건에 따라 명확한 신호를 생성하여 트레이더가 잠재적
MultiSymbolsWpr Indice x IBOV
Israel Goncalves Moraes De Souza
O Indicador identifica relação do Índice com a soma dos principais ativos, funciona para qualquer mercado do mund o, possui um oscilador WPR com a soma dos principais ativos escolhidos, indicando a antecipação do movimento em relação ao Índice. Características WPR com a soma dos papéis escolhidos - branco WPR do papel atual - vermelho Canal de Tendência O indicador pode indicar movimento de entradas, sendo: cruzamento das linhas cruzamento da linha Multi Symbols no -50 cruzamento entre os canai
FREE
DMC Trend
Deibson Carvalho
5 (1)
Indicator that uses ATR and standard deviation to calculate the current trend. It has the top and bottom line. The top line is shown when it is high, and the bottom line when it is low. The indicator does not draw a trend line or show the trend for the day, or for a certain period. It has the function of indicating the current trend, and may indicate a reversal. use it with caution and at your own risk.
FREE
MTF Candles PRO
Renato Fiche Junior
1 (2)
Tool that allows viewing candles in multiple timeframes. This way, it helps the analysis in multiple timeframes. This is another product developed by Renato Fiche Junior and available to all MetaTrader 5 users! Input Parameters - Option 1 - TimeFrame: Standard MT5 timeframe - Option 2 - Custom TimeFrame (in minutes): Or, if this value is different from zero, the timeframe will be customized. This allows you to choose timeframe other than the MT5 standard. - Total Candles: Number of candles. -
FREE
Cris Levels
Cristian Juliano Bomm Reuter
Cris Levels é uma ferramenta visual de apoio à decisão para o MetaTrader 5 — não abre, fecha nem gerencia ordens sozinha. Ela organiza no gráfico as regiões de preço que mais importam pra sua análise, combinando módulos independentes num único indicador: • Suporte e Resistência inteligente : identifica automaticamente os topos e fundos mais relevantes, tanto na base diária (últimos N pregões) quanto na estrutura fractal do próprio gráfico. Um nível só é confirmado depois que o movimento oposto r
FREE
Auto Fibo
Renato Conti
AutoFibo Points MT5 – Projeção Automática de Fibonacci em Pontos O AutoFibo Points é um indicador utilitário projetado para traders que buscam velocidade, precisão e clareza visual na análise gráfica. Ele elimina a necessidade de fazer cálculos manuais de variação de preço, exibindo automaticamente a distância exata em pontos em cada nível de projeção diretamente no seu gráfico. Projetado com foco em usabilidade fluida , o indicador permite traçar e ajustar níveis de Fibonacci através de um atal
FREE
Price Daily Percentage Variation
Joao Victor Da Silva Dias
단독 혜택: 선착순 100명에게 이 지표에 대한 평생 이용권이 제공됩니다! Price Daily Percentage Variation Price Daily Percentage Variation 는 자산의 일일 백분율 변동을 기반으로 가격 수준을 식별하기 위해 개발된 지표로, 전체 거래 세션을 추적하는 고정된 백분율 그리드를 생성합니다. 당일의 시가로부터 이 지표는 자동으로 중앙선과 이 수준 위아래로 여러 선을 그려 통계적인 지지 및 저항 영역을 형성합니다. 작동 방식 및 응용 중앙선은 당일의 시가를 나타내며 세션의 처음부터 끝까지 그려진 상태로 유지됩니다. 이를 바탕으로 지표는 상하 백분율 수준을 계산하여 트레이더가 시가 대비 시장의 위치를 빠르게 시각화할 수 있도록 합니다. 이러한 영역은 시장 흐름의 중요한 기준으로 작용합니다. 많은 경우, 이는 움직임 둔화, 이익 실현, 추세 지속 또는 반전이 발생하는 가격 반응 지점으로 작용합니다. 이러한 이유로 이 지표는 스캘핑, 데
Trend Everest
Eduardo Da Costa Custodio Santos
Trend Everest MT5 indicator is a trend following indicator that aids in decision making. It is based on the calculation of ATR that assist and the average hull. A key issue is that the Trend Everest MT5 nominee does not repaint, so you can backtest with greater confidence. When it is Green, UpTrend When it is a Red downtrend. Not that the Market is fractal, so the longer the graphic time, the greater its degree of assertiveness.
Professional Support and Resistance Indicator This indicator was developed as a market context study and analysis tool , designed to help identify potentially relevant areas on the chart through the combination of price action, volume, and higher-timeframe market structure . The indicator displays two layers of horizontal dashed lines , positioned at areas considered relevant for analysis. This allows traders to observe different support and resistance zones and evaluate their relationship with
Technical and Professional Description of the Indicator Price Structure, Fibonacci, Financial Volume, and Interest Zone Indicator This indicator was developed based on in-depth studies of price structure, Fibonacci levels, financial volume behavior, and the identification of market interest zones . Its primary purpose is to transform these different analytical elements into a structured visual tool, allowing users to identify key levels and areas of greater structural relevance on the chart in a
FREE
이 제품의 구매자들이 또한 구매함
Trend Sniper X
Sarvarbek Abduvoxobov
4.9 (41)
Trend Sniper X 는 트레이더가 추세 방향과 잠재적 반전 지점을 명확하고 정확하게 포착할 수 있도록 도와주는 MetaTrader 5용 멀티 타임프레임 추세 추종 지표입니다. MT4용: https://www.mql5.com/en/market/product/193245 가격 정보: 현재 가격은 프로모션 할인가이며, 향후 업데이트 및 새로운 기능이 출시됨에 따라 변동될 수 있습니다. 보너스 혜택: 본 지표 전용 무료 자동매매 Assistant EA를 받으시려면 구매 후 작성자에게 메시지를 보내주시기 바랍니다. Code2Profit 채널 멀티 타임프레임 분석으로 시장을 마스터하세요! Trend Sniper X로 승률을 극대화하는 방법: 핵심 규칙 및 세션 팁 기술 사양 플랫폼 MetaTrader 5 지표 유형 멀티 타임프레임 추세 지표 운용 타임프레임 모든 차트 타임프레임 지원, 독립적으로 선택 가능한 상위 타임프레임(M1–MN1) 주요 상품 외환, 금(XAUUSD) 및 기타 C
Smart Trend Trading System — MetaTrader 5 구매 후 MQL5에서 저에게 메시지를 보내시면 Smart Universal Expert Advisor를 무료로 받으실 수 있으며, 온라인 강좌, PDF 매뉴얼 및 비공개 그룹 이용 권한도 함께 제공됩니다. STTS는 추세 방향, 진입·청산 신호, 반전 구간, 주요 가격 수준을 차트에 모아 보여줍니다. 시스템을 참고해 수동으로 거래하거나, 별도의 호환 EA를 연결하여 선택한 설정에 따라 자동으로 거래를 실행할 수 있습니다. 하나의 시스템, 네 가지 트레이딩 접근법 STTS의 트레이딩 접근법은 크게 네 가지로 나뉩니다. • 스캘핑 — 단기 신호와 시장 움직임을 살펴봅니다. • 추세 매매 — 방향을 평가하고 추세 안에서 기회를 찾습니다. • 반전 매매 — 잠재적인 전환 구간과 방향 변화를 파악합니다. • 거래량 매매 — 거래량 기반 정보로 시장 활동을 평가합니다. 진입·청산 화살표, 추세 정보, 지지·저항 수
SuperScalp Pro
Van Minh Nguyen
4.56 (36)
SuperScalp Pro - Professional Multi-Layer Confluence Scalping System SuperScalp Pro는 클래식 Supertrend에 여러 지능형 확인 필터를 추가한 고급 스캘핑 지표입니다. 더 높은 확률의 Buy/Sell 거래 기회를 식별하는 데 도움을 주며, 잘못된 신호를 크게 줄이는 데 도움을 줍니다. 명확한 Buy 및 Sell 화살표가 차트에 직접 표시되며, ATR 기반 Stop Loss 및 Take Profit 수준이 실시간으로 자동 계산됩니다. 구매 후 설정 방법 및 권장 구성에 대한 안내가 필요하시면 저에게 문의해 주세요. SuperScalp Pro Auto Trader를 사용하여 신호를 쉽게 자동화할 수 있습니다: [Auto Trader] 권장 설정 파일 다운로드: [Set File] 전체 문서는 제품 블로그에서 확인할 수 있습니다: [User Guide] 업데이트를 확인하려면 공식 채널에 참여하세요: [Official C
새로운 왕의 등장 - 인디케이터 + 주문 관리 표시(TP1 + TP2 + TP3) + 선택형 텔레그램 시그널 전송 기능 포함 (무료) (완전한 트레이딩 및 시그널 시스템) 골드를 위한 최고의 EA: Gold Slayer 이 인디케이터는 고급 전략, 사용자 지정 가능한 주문 관리 시스템, 그리고 엔벨로프 확장을 결합한 평균 회귀(mean reversion) 시스템을 포함하고 있습니다. 또한 RSI와 같은 여러 지능형 확인 필터를 통해 높은 확률의 반전 진입 구간을 포착하여 BUY 및 SELL 시그널을 제공합니다. 단순히 거래 방법만 배우는 것이 아니라, 여러 포지션을 효과적으로 관리하고 이전에 수익 중인 오픈 포지션으로 손실 거래를 커버하는 방법까지 익힐 수 있습니다. M5 전용으로 설계 및 최적화되었으며, 유동성이 풍부해 시그널이 더 깔끔하고 신뢰도 높은 BTCUSD와 XAUUSD에서 뛰어난 성능을 발휘합니다. 이 인디케이터는 ATR 기반으로 자동 계산된 진입가, 손절가, 익절가와
SMC Intraday Formula
VividMind Digital Solutions
5 (26)
먼저 솔직하게 말하겠습니다. 어떤 인디케이터도 단독으로 당신을 수익성 있게 만들어주지 않습니다. 누군가 그렇게 말한다면, 그는 당신에게 꿈을 파는 것입니다. 완벽한 매수/매도 화살표를 보여주는 모든 인디케이터는 완벽하게 보이도록 만들 수 있습니다 — 단지 올바른 과거 구간을 확대하고 승리한 거래만 캡처하면 됩니다. 우리는 그렇게 하지 않습니다.  SMC Intraday Formula는 도구입니다. 시장 구조를 읽고, 가장 높은 확률의 가격 구간을 표시하며, 현재 스마트 머니의 흐름이 어떻게 보이는지 아주 단순한 언어로 보여줍니다. 최종 결정은 여전히 당신이 합니다. 실행도 당신이 합니다. 하지만 이제는 희망이 아니라 정확성으로 거래하게 됩니다. 우리는 이 인디케이터를 지난 약 3년 동안 골드(XAUUSD) 및 주요 외환 통화쌍의 데이 트레이딩 스캘핑에 사용해 왔습니다. M1, M5, M15, M30에서 우리의 핵심 도구입니다. 이 도구는 미래를 예측하려 하지 않습니다 — 지금 형성
Entry Points Pro for MT5
Yury Orlov
4.52 (151)
전설이 돌아왔습니다: Entry Points Pro 10. MQL5 마켓 Top-3 자리를 3년간 지켜온 전설적인 지표의 재출시입니다. 수백 개의 호평 리뷰(두 버전 합산 589개), 매일 이 지표로 거래하는 수천 명의 트레이더, 31,000회 이상의 데모 다운로드   MT4+MT5 . 지난 5년간 여러분이 남긴 리뷰를 하나도 빠짐없이 읽었고, 약속 대신 그 답을 버전 10에 담았습니다. 1999년부터 시장에서 활동하며 정직함과 자신의 평판, 그리고 고객을 소중히 여기는 개발자가 만들었습니다. Entry Points Pro의 진입 시그널은 절대 리페인팅되지 않습니다. 그리고 이번에는 개발자의 말뿐이 아니라 검증 가능한 사실입니다: 확정 시그널은 캔들 종가에서만 표시되며, 자동화 테스트에서 리페인팅 0건 이 확인되었습니다(EURUSD, XAUUSD, BTCUSD에서 2,486,568회의 불변조건 검사 — 위반 0건). 검증 방법은 공개되어 있으니 전략 테스터에서 직접 재현해 보실 수
Gann Made Easy MT5
Oleg Rodin
5 (10)
Gann Made Easy 는 mr.의 이론을 사용하여 최고의 거래 원칙을 기반으로 하는 전문적이고 사용하기 쉬운 Forex 거래 시스템입니다. W.D. 간. 이 표시기는 Stop Loss 및 Take Profit Levels를 포함하여 정확한 BUY 및 SELL 신호를 제공합니다. PUSH 알림을 사용하여 이동 중에도 거래할 수 있습니다. 구매 후 거래 방법 안내 및 유용한 추가 지표를 무료로 받으시려면 저에게 연락주세요! 아마도 Gann 거래 방법에 대해 이미 여러 번 들었을 것입니다. 일반적으로 Gann의 이론은 초보자 거래자뿐만 아니라 이미 거래 경험이 있는 사람들에게도 매우 복잡한 것입니다. Gann의 거래 방식은 이론적으로 적용하기 쉽지 않기 때문입니다. 나는 그 지식을 연마하고 Forex 지표에 최고의 원칙을 적용하기 위해 몇 년을 보냈습니다. 표시기는 적용하기가 매우 쉽습니다. 차트에 첨부하고 간단한 거래 권장 사항을 따르기만 하면 됩니다. 지표는 지속적으로 시장 분석
Auto Optimized SpeedAngle 은 지속적인 워크포워드 최적화(Walk-Forward Optimization, WFO)를 통해 곡선 적합(curve-fitting)을 제거한 기관 수준의 모멘텀 벡터화 시스템입니다. 시장 체제가 바뀔 때 성능이 떨어지는 정적 입력에 의존하는 대신, 이 지표는 표본 외(Out-of-Sample, OOS) 검증을 사용하여 매개변수를 동적으로 재보정하며, 표시되는 신호가 과거의 우연이 아닌 진정한 통계적 우위를 나타내도록 보장합니다. 핵심 기관용 프레임워크 워크포워드 최적화 엔진: 핵심 알고리즘은 수천 가지의 룩백(lookback) 및 임계값 조합을 지속적으로 스캔하며, 데이터를 인샘플(in-sample)과 표본 외(out-of-sample) 세트로 엄격하게 분리합니다. 미지의 데이터 환경에서 수학적 우수성이 증명된 경우에만 새로운 매개변수 구성을 채택합니다. 정량적 목적 함수: 순수한 총이익을 쫓는 대신, 최적화 엔진은 기관 수준의 안정성
Neuro Poseidon MT5
Daria Rezueva
4.75 (52)
Neuro Poseidon is a new indicator by Daria Rezueva. It combines precise trading signals with adaptive TP/SL levels - creating best possible trades as a result! Message me and get  Neuro Poseidon Assistant  as a gift to automize your trading process! What makes it stand out? 1. Proven profitability on all assets and timeframes 2. Only confirmed BUY and SELL signals present on the chart 3. Adaptive TP & SL levels generated by the software for each trade 4. Easy to understand - suitable for al
Welcome to ENTRY IN THE ZONE AND SMC MULTI TIMEFRAME  SPECIAL BENEFIT / FOR OUR MQL5 CUSTOMERS FREE ACCESS TO THE NEW TOOL  — COMING SOON — Learn more on our official website  : https://www.fableedge.net Entry In The Zone and SMC Multi Timeframe is a real-time market analysis tool based on Smart Money Concepts (SMC) , designed to analyze market structure, price direction, and key trading zones. It supports both Single-Timeframe and Multi-Timeframe Analysis , providing a clearer view of overall m
당신의 트레이딩 우위를 한눈에 확인하세요! M5 Sniper 는 MeanFX의 새로운 지표입니다. 정확한 트레이딩 신호 와 적응형 TP/SL 레벨 을 결합하여, 결과적으로 가능한 최고의 통계적 트레이딩을 만들어냅니다! 5회 구매마다 가격이 인상되며, 다음 가격은 69$입니다. 구매 후 저에게 메시지를 보내주시면 팁/가이드와 보너스 EA를 제공해 드립니다. 무엇이 이 지표를 특별하게 만들까요? Gold XAUUSD에서 검증된 통계적 성과 ( 거의 모든 자산에서 작동 하며, 일관된 결과 없이 모든 것을 다루려고 하기보다는 하나의 타임프레임을 완전히 익히는 데 집중합니다) 각 심볼당 하루 1~8회의 트레이드 와 높은 승률을 제공하며, 모든 통계적 우위를 우리의 편으로 가져갑니다. 차트에는 확인된 BUY 및 SELL 신호만 표시됩니다. 각 트레이드에 대해 지표가 생성하는 적응형 TP 및 SL 레벨 평균 승률 75%+ 평균 Signal Ratio 최소 1.1+ 알람 및 알림이 휴대폰 으로도
M1 Sniper MT5
Oleg Rodin
5 (7)
M1 SNIPER 는 사용하기 쉬운 거래 지표 시스템입니다. M1 시간대에 맞춰 설계된 화살표 지표입니다. 이 지표는 M1 시간대 스캘핑을 위한 단독 시스템으로 사용할 수 있으며, 기존 거래 시스템의 일부로도 사용할 수 있습니다. 이 거래 시스템은 M1 시간대 거래용으로 특별히 설계되었지만, 다른 시간대에도 사용할 수 있습니다. 원래는 XAUUSD와 BTCUSD 거래를 위해 이 방법을 설계했지만, 다른 시장 거래에도 유용하다는 것을 알게 되었습니다. 이 지표의 신호는 추세 방향과 반대로 거래될 수 있습니다. 저는 지표의 신호를 활용하여 양방향으로 거래할 수 있도록 돕는 특별한 거래 기법을 알려드립니다. 이 방법은 특별한 동적 지지선과 저항선 가격 영역을 활용하는 것을 기반으로 합니다. 구매하시면 M1 SNIPER 화살표 지표를 바로 다운로드하실 수 있습니다. 또한, 아래 스크린샷에 표시된 Apollo Dynamic SR 지표는 M1 SNIPER 도구를 사용하는 모든 사용자에게 무료로
Unix Scalper
Issam Kassas
4 (4)
Unix Scalper — MetaTrader 5 구매 후 MQL5에서 저에게 메시지를 보내시면 Smart Universal Expert Advisor를 무료로 받으실 수 있으며, 온라인 강좌, PDF 매뉴얼 및 비공개 그룹 이용 권한도 함께 제공됩니다. 매매 기회를 찾고, 거래 계획을 확인하고, 실행 방법을 선택하세요. UNIX Scalper는 시장 분석, BUY/SELL/WAIT 판단, Entry, Stop Loss, TP1 및 TP2 가격 수준을 하나의 정돈된 패널에 제공합니다. 신호와 거래 계획을 한눈에 • 명확한 판단: BUY, SELL 또는 WAIT. • 구체적인 가격 수준: Entry, Stop Loss, TP1 및 TP2. • 다중 시간대 개요: 패널의 여러 시간대 신호를 비교하세요. • 판단을 돕는 분석: 추세, 모멘텀, 거래량, 변동성, 지지와 저항, 시장 품질. • 다양한 레이아웃: Minimized, Compact, Standard 또는 Full. 신호와
Scalper Vault 는 성공적인 스캘핑에 필요한 모든 것을 제공하는 전문 스캘핑 시스템입니다. 이 표시기는 외환 및 바이너리 옵션 거래자가 사용할 수 있는 완전한 거래 시스템입니다. 권장 시간 프레임은 M5입니다. 시스템은 추세 방향으로 정확한 화살표 신호를 제공합니다. 또한 상단 및 하단 신호와 Gann 시장 수준을 제공합니다.  이 시스템은 사용하기가 매우 쉽습니다. 원하는 시장 지역의 화살표만 따라가면 됩니다. 엑시트는 가격이 적정 수준에 도달하거나 시장의 고점 또는 저점 신호가 나타날 때 수행됩니다.  표시기는 PUSH 알림을 포함한 모든 유형의 경고를 제공합니다. 인디케이터 구매 후 연락주세요. 내 개인 거래 권장 사항과 훌륭한 보너스 지표를 무료로 공유합니다! 나는 당신에게 행복하고 유익한 거래를 기원합니다!
Divergence Bomber
Ihor Otkydach
4.89 (94)
이 지표를 구매하신 분께는 다음과 같은 혜택이 무료로 제공됩니다: 각 거래를 자동으로 관리하고, 손절/익절 수준을 설정하며, 전략 규칙에 따라 거래를 종료하는 전용 도우미 툴 "Bomber Utility" 다양한 자산에 맞게 지표를 설정할 수 있는 셋업 파일(Set Files) "최소 위험", "균형 잡힌 위험", "관망 전략" 모드로 설정 가능한 Bomber Utility의 셋업 파일 이 전략을 빠르게 설치, 설정, 시작할 수 있도록 돕는 단계별 영상 매뉴얼 주의: 위의 모든 보너스를 받기 위해서는 MQL5 개인 메시지 시스템을 통해 판매자에게 연락해 주세요. 독창적인 커스텀 지표인 “Divergence Bomber(다이버전스 봄버)”를 소개합니다. 이 지표는 MACD 다이버전스(괴리) 전략을 기반으로 한 올인원(All-in-One) 거래 시스템입니다. 이 기술 지표의 주요 목적은 가격과 MACD 지표 간의 다이버전스를 감지하고, **향후 가격이 어느 방향으로 움직일지를 알려주
RelicusRoad Pro MT5
Relicus LLC
4.96 (25)
거래를 더 이상 감으로 하지 마세요. 언제 진입할지, 어디서 청산할지, 시장이 어느 쪽으로 기울어 있는지를 한 차트에서 확인하세요. RelicusRoad Pro는 20개 가까운 도구를 인디케이터 하나에 담았고, 내 매매 방식에 맞는 도구만 켜서 쓰면 됩니다. 명확한 진입. 명확한 청산. 차트마다 확실한 계획. 이런 경험, 익숙하지 않으신가요? 매수하면 1분 뒤 가격이 반대로 돌아섭니다. 너무 일찍 청산하고, 그다음 움직임이 나 없이 이어지는 것을 지켜봅니다. 지표를 5개 띄우면 답도 5가지가 나옵니다. 손절(스톱로스)은 그냥 감입니다. 우리가 이걸 만든 이유 우리는 18년 동안 외환 거래를 해 왔습니다. RelicusRoad는 처음에 우리끼리 쓰려고, 전문 트레이더 모임을 위해 비공개로 만들었습니다. 이유는 개인적이었습니다. 같은 선을 손으로 계속 그리는 일에 지쳤고, 스스로 정한 규칙을 어기고, 차트에서 정말 중요한 한 가지를 놓치곤 했습니다. 우리에게 통한 것은 일관성입니다. 매
Tokyo mt5 Indicator
Vasiliy Strukov
5 (7)
Tokyo Indicator는 추세 방향, 잠재적 거래 신호 및 시장 상황을 명확하고 시각적으로 보여줍니다. 색상으로 구분된 계단식 추세선은 강세 구간(파란색)과 약세 구간(자홍색)을 명확히 구별해 줍니다. 추세가 전환될 때 나타나는 방향성 화살표는 잠재적인 매수 및 매도 기회를 강조하여 보여줍니다. 통합 대시보드는 현재 신호, 시장 성향(bias), 모멘텀, 변동성, 신호 품질 등의 정보를 한눈에 파악할 수 있도록 구성되어 있습니다. 이를 통해 트레이더는 별도의 패널을 오갈 필요 없이 가격 움직임(price action)과 지표의 데이터를 동시에 분석할 수 있습니다. 깔끔한 차트 화면과 간결한 시장 개요를 제공하는 Tokyo Indicator는 체계적인 추세 분석과 거래 결정을 지원합니다. 모든 시간대와 다양한 자산(특히 금)에서 활용할 수 있습니다. 추세 방향, 잠재적 거래 신호 및 시장 상황을 명확하고 시각적으로 보여줍니다. 색상으로 구분된 계단식 추세선은 강세 구간(파란색)
FX Trend MT5 NG
Daniel Stein
5 (6)
FX Trend NG: 차세대 멀티 마켓 트렌드 인텔리전스 개요 FX Trend NG 는 다중 시간 프레임 기반의 전문 트렌드 분석 및 시장 모니터링 도구입니다. 몇 초 만에 전체 시장 구조를 파악할 수 있도록 설계되었습니다. 여러 차트를 일일이 전환할 필요 없이, 어떤 종목이 추세에 있는지, 어디에서 모멘텀이 약화되고 있는지, 그리고 어떤 시간 프레임이 서로 정렬되어 있는지 즉시 확인할 수 있습니다. 출시 기념 특별 혜택 – FX Trend NG 를 $30 (6개월) 또는 $80 평생 라이선스 로 이용할 수 있습니다. 이미 Stein Investments 고객이신가요? -> 메시지를 보내 전용 고객 그룹에 참여하세요. 설정이나 사용 방법이 필요하신가요? -> Stein Investments 공식 페이지 를 방문하세요. 1. FX Trend NG가 특별한 이유 3단계 추세 로직 – 단순한 Buy / Sell이 아닙니다 • 대부분의 지표는 Buy 또는 Sell 두 가지 상태만 제
FiboSniper Pro
Van Minh Nguyen
5 (3)
FiboSniper Pro – Multi-Filter Fibonacci System with Auto SL/TP and Control Panel FiboSniper Pro는 동적 Fibonacci Envelopes와 여러 확인 필터를 결합하여 선별된 Buy 및 Sell 신호를 생성하는 기술적 지표입니다. Fibonacci 레벨은 Moving Average와 ATR을 기반으로 계산된 후 ADX, EMA, RSI, ATR, Volume, Time 및 Candle 구조를 통해 필터링됩니다. 이 지표는 ATR 기반의 자동 Stop Loss 및 Take Profit 레벨을 차트에 직접 표시하며, 빠른 설정 조정을 위한 인터랙티브 Control Panel을 제공합니다. 구매 후 권장 설정 파일과 자세한 사용 방법을 받으려면 저에게 문의해 주세요. Auto Trader X를 사용하여 FiboSniper Pro 신호를 자동화할 수 있습니다: [Auto Trader X] User Guide 및 Se
Market Structure Order Block Dashboard MT5는 시장 구조와 주요 가격 반응 구역을 차트에서 직접 읽고자 하는 트레이더를 위해 설계된 MT5 지표입니다. BOS, ChoCH, 오더 블록, Fair Value Gap (FVG), 유동성, Kill Zones, Volume Profile 그리고 빠른 분석을 위한 콤팩트한 대시보드를 결합합니다. 이 지표는 시장 구조, ICT 및 Smart Money 개념을 의사결정 프레임워크로 사용하는 트레이더를 대상으로 합니다. 추세 지속, 가능한 반전, 가격 불균형, 유동성 타겟 및 관심 구역을 보다 체계적으로 식별하는 데 도움을 줄 수 있습니다. 구매자를 위한 포함 리소스 구매 후 MQL5 개인 메시지로 요청하시면 완전한 PDF 사용 설명서와 파라미터 설정 팁을 제공해 드립니다. MQL5 개인 메시지를 통한 직접 기술 지원. 1.20 버전은 두 가지 주요 추가 기능을 제공합니다: Pending BOS / Pending
안녕하세요, 트레이더 여러분! 많은 개인 투자자들이 느린 웹 스크립트에 의존하고 있습니다. 수익성 있는 거래를 위해서는 체계적인 프레임워크가 필수적입니다. Astro AI 지표는 단순한 차트 오버레이가 아닙니다. 터미널에서 직접 실행되는 두 개의 에이전트로 구성된 정교한 신경망입니다. 시스템 기술 상세 설명: 1. 에이전트 1: 분석가 (그래픽 신경망 – GNN) 시장은 개별 가격 막대로 이루어진 것이 아니라 상호 연결된 데이터 네트워크입니다. 기능: 에이전트 1은 그래픽 신경망을 사용하여 이러한 복잡하고 비선형적인 관계를 파악합니다. 장점: 기존 지표는 과거 이동 평균만을 고려하는 반면, 저희 GNN은 시장의 심층적인 구조적 관계를 실시간으로 처리하여 개별 트레이더의 거래량이 시장에 큰 영향을 미치기 전에 숨겨진 상관관계를 찾아냅니다. 2. 에이전트 2: 실행기 (근접 전략 최적화 – PPO) 패턴 인식은 절반의 성공일 뿐입니다. 현재 시장 변동에 기반하여 올바른
Adaptive Price Action Engine 지표를 구매하면 EA(자동매매 프로그램)가 무료 멀티 타임프레임 기반 자기 최적화 추세 & 캔들 패턴 분석 시스템 시장은 끊임없이 변화하며, 모든 Price Action 패턴이 모든 시장 환경에서 동일한 가치를 가지는 것은 아닙니다. Adaptive Price Action Engine 은 변화하는 시장 환경에 적응할 수 있도록 설계되었으며, 추세 구조, 멀티 타임프레임 분석, 캔들 패턴 및 통계적 최적화 를 하나의 분석 프레임워크로 결합합니다. 두 가지 적응형 모드 Dual Alpha Trend Mode 낮은 타임프레임과 높은 타임프레임에서 적합한 Alpha Trend 파라미터를 자동으로 탐색하여, 최근 시장 움직임에 맞춰 추세 분석을 조정합니다. Candlestick + Alpha Mode Alpha Trend를 통한 시장 국면 분석과 22개의 상승 및 하락 캔들 패턴 을 결합합니다. 모든 패턴을 동일하게 취급하는 대신, 다양
소개       Quantum Breakout PRO   , 브레이크아웃 존 거래 방식을 변화시키는 획기적인 MQL5 지표! 13년 이상의 거래 경험을 가진 숙련된 트레이더 팀이 개발한       퀀텀 브레이크아웃 PRO       혁신적이고 역동적인 브레이크아웃 존 전략으로 거래 여정을 새로운 차원으로 끌어올리도록 설계되었습니다. Quantum Breakout Indicator는 5개의 이익 목표 영역이 있는 브레이크아웃 영역의 신호 화살표와 브레이크아웃 상자를 기반으로 한 손절 제안을 제공합니다. 초보자 거래자와 전문 거래자 모두에게 적합합니다. Quantum EA 채널:       여기를 클릭하세요 중요한! 구매 후 설치 매뉴얼을 받으려면 개인 메시지를 보내주십시오. 추천: 기간: M15 통화쌍: GBPJPY, EURJPY, USDJPY,NZDUSD, XAUUSD 계정 유형: 스프레드가 매우 낮은 ECN, Raw 또는 Razor 브로커 시간: GMT +3 중개인 :
Trend Catcher ind mt5
Ramil Minniakhmetov
5 (18)
트렌드 캐처 인디케이터 트렌드 캐처 인디케이터는 개발자가 자체 개발한 맞춤형 적응형 트렌드 분석 지표들을 조합하여 시장 가격 움직임을 분석합니다. 단기적인 노이즈를 제거하고 근본적인 모멘텀 강도, 변동성 확대, 가격 구조 움직임에 집중하여 진정한 시장 방향을 파악합니다. 또한 이동 평균, RSI, 변동성 필터와 같은 맞춤형 지표들을 활용하여 가격을 평활화하고 트렌드를 필터링합니다. 실제 운영 모니터링 및 기타 제품은 다음 링크에서 확인하실 수 있습니다:   https://www.mql5.com/en/users/mechanic/seller 텔레그램에서는 EA나 설정 파일을 판매하지 않습니다. 사기이니 주의하세요. 모든 설정 파일은 블로그에서 무료로 제공됩니다. 중요! 구매 후 즉시 연락 주시면 사용 방법 및 보너스를 드립니다!
Quant Direction MT5
Georgios Kalomoiropoulos
Quant Direction 은 3D 시장 분석 도구입니다. 다양한 매개변수에 걸쳐 정확한 백분율 편차를 계산하면서 완벽하게 객관적인 알고리즘 기반 시장 분석을 제공합니다. 첨단 AI 기반 모델링 도구와 엄격한 테스트를 거쳐 개발된 이 알고리즘은 타의 추종을 불허하는 정확도로 시장을 분석합니다. 플랫폼에서 모든 통화쌍 또는 금융 상품을 분석할 수 있습니다. 단기 거래, 데이 트레이딩, 스윙 트레이딩 등 어떤 유형의 거래를 하든 Quant Direction은 최적의 선택입니다. 운영자가 되는 것의 진정한 이점 퀀트 디렉션의 진정한 장점은 감정, 눈의 피로, 과도한 분석을 완전히 배제한다는 점입니다. 더 이상 수십 개의 차트를 일일이 살펴보며 방향을 찾거나 자신의 판단에 끊임없이 의문을 품을 필요가 없습니다. 이 시스템은 8개의 시간 간격(5개월에서 수개월까지)을 밀리초 단위로 처리합니다. 특정 시점의 주요 시장 참여자를 정확하게 식별하여 항상 성공 확률이 가장 높은 방향으로 거래할
Quantum TrendPulse
Bogdan Ion Puscasu
5 (26)
SuperTrend   ,   RSI   ,   Stochastic   의 힘을 하나의 포괄적인 지표로 결합하여 트레이딩 잠재력을 극대화하는 궁극의 트레이딩 도구   인 Quantum TrendPulse를   소개합니다. 정밀성과 효율성을 추구하는 트레이더를 위해 설계된 이 지표는 시장 추세, 모멘텀 변화, 최적의 진입 및 종료 지점을 자신 있게 식별하는 데 도움이 됩니다. 주요 특징: SuperTrend 통합:   주요 시장 추세를 쉽게 따라가고 수익성의 물결을 타세요. RSI 정밀도:   매수 과다 및 매도 과다 수준을 감지하여 시장 반전 시점을 파악하는 데 적합하며 SuperTrend 필터로 사용 가능 확률적 정확도:   변동성이 큰 시장에서 숨겨진 기회를 찾기 위해 확률적 진동   을 활용하고 SuperTrend의 필터로 사용 다중 시간대 분석:   M5부터 H1 또는 H4까지 다양한 시간대에 걸쳐 시장을 최신 상태로 유지하세요. 맞춤형 알림:   맞춤형 거래 조건이 충족되면
Atomic Analyst MT5
Issam Kassas
4.47 (60)
Atomic Analyst — MetaTrader 5 구매 후 MQL5에서 저에게 메시지를 보내시면 Smart Universal Expert Advisor를 무료로 받으실 수 있으며, 온라인 강좌, PDF 매뉴얼 및 비공개 그룹 이용 권한도 함께 제공됩니다. Atomic Analyst는 가격 움직임 분석, 추세 방향, 진입·청산 신호, 손절 수준, 여러 익절 수준을 차트에 모아 보여줍니다. 신호를 확인하고 매매 상황을 이해하세요 Atomic Analyst는 분석 결과를 명확한 시각 정보로 정리합니다. • 잠재적인 진입 기회를 확인할 수 있는 매수·매도 화살표. • 거래 계획에 도움이 되는 손절 수준과 여러 익절 수준. • 시장 방향을 평가할 수 있는 추세, 강도, 모멘텀 수치. • 더 넓은 시장 맥락을 비교할 수 있는 여러 시간대 분석. • 변화하는 시장 상황을 따라갈 수 있는 색상별 캔들과 알림. 신호와 보조 분석을 함께 검토한 다음, 해당 매매 상황이 자신의 거래 규칙에
Btmm state engine pro
Garry James Goodchild
5 (4)
BTMM State Engine Pro by G-Labs — Beat The Market Maker indicator for MetaTrader 5. Asian session range, London and New York kill zones, level progression (L1/L2/L3), peak formation detection (PFH/PFL), entry signals, and a multi-pair scanner from one chart. Stop scanning charts one pair at a time. The State Engine tracks the BTMM daily cycle automatically — Asian box, room boundaries, level blocks, peak formations, and filtered entries — while the scanner dashboard shows level, peak status, d
SkyHammer Signal Pro
Shengzu Zhong
5 (4)
SkyHammer Signal Pro Entry, SL, TP 레벨이 고정되는 전문 No-Repaint 추세 신호 인디케이터 SkyHammer Signal Pro는 명확하고 고정되며 검증 가능한 신호를 원하는 트레이더를 위해 설계된 구조적인 추세 및 모멘텀 신호 인디케이터입니다. 특히 M1 및 M5 같은 낮은 시간대에서 가장 효과적으로 작동합니다. 이 인디케이터는 시장의 고점이나 저점을 예측하려고 하지 않습니다. 대신 신호를 생성하기 전에 확인된 시장 구조, 추세 방향, 모멘텀 강도, 건강한 변동성, 그리고 목표까지의 충분한 공간을 기다립니다. 주요 기능 고정 신호 메커니즘 신호가 확인되면 화살표, Entry, Stop Loss, TP1, TP2 레벨이 차트에 영구적으로 고정됩니다. 이후 캔들 움직임 때문에 신호가 사라지거나, 이동하거나, 변경되지 않습니다. 이를 통해 트레이더는 각 신호를 명확하게 검토할 수 있으며, 실시간 시장에서 신호가 사라지는 일반적인 문제를 피할 수 있습니다
Crystal Quantum Pro
Muhammad Jawad Shabir
5 (3)
CRYSTAL QUANTUM PRO Institutional Signal & Trade Intelligence for MetaTrader 5 Final Price: 199 USD ----> Price goes up 10 USD after every 10 sales. Limited launch slots available, act fast. Most indicators give you an arrow and leave you alone. A naked arrow is a gamble. Winning consistently requires CONFLUENCE , a clear STOP and TARGET , and honest PROOF that the system works. Crystal Quantum Pro delivers all three in one clean, no-repaint package. Crystal Quantum Pro is a complete decision sy
제작자의 제품 더 보기
SMC Nexus Market Structure
Sergejs Rozkalns
4.89 (9)
Free SMC indicator for MetaTrader 5. SMC Nexus Market Structure draws the two things every Smart Money Concepts (SMC) trader reads first: market structure (BOS / CHoCH) and order blocks. Nothing else on the chart — no clutter, no lag, no repainting. Structure breaks are confirmed on closed bars only. A level that printed yesterday still sits exactly where it printed. What you get Market Structure — dual level (internal + external) BOS and CHoCH, labelled and colour-coded. Read the minor swing st
FREE
Supply and demand zones for MetaTrader 5, with zone-touch alerts. SMC Nexus Supply Demand finds swing highs and lows on the current timeframe and turns them into supply and demand zones sized by volatility (ATR). Every zone carries a point-of-interest (POI) mid-line, a broken zone leaves a short POI history line, and an alert tells you when price comes back to a zone. Everything is calculated on closed bars: once a bar has closed, the zones, breaks and alerts on it do not change. What you get Su
FREE
필터:
Alex71
78
Alex71 2026.10.03 09:32 

The developer didn't just blindly follow the program's creation; he delved into the essence of what people need for successful trading and created an excellent product that helps achieve positive results. The program works quickly, reliably, and without glitches. The interface and manual are intuitive. I'd also like to point out the excellent communication: the developer is always available and promptly responds to questions. I'm not a professional trader, but this program makes my charting experience completely different, and it's incredibly helpful. I've previously installed both free and paid programs. For me, it's 5*.

Sergejs Rozkalns
5903
개발자의 답변 Sergejs Rozkalns 2026.10.03 18:04
Alex, thank you for such a warm and detailed review! You named exactly what I was aiming for. I trade with this indicator myself, so every tool had to earn its place on a real trading day. That is also why it opens in a minimal view, with everything else one button away. Trading alongside a main job is exactly what the alerts were built for: they fire on closed bars only and can come to your phone, so the terminal calls you when price reaches a zone and you don't have to watch the chart for hours. Thank you as well for the kind words about support. Whenever a question comes up (settings, a new symbol or timeframe), just message me, I answer personally. And when you're ready, send me your instruments and the hours you're usually at the chart, and I'll put together a starter setup for exactly that. Wishing you calm, disciplined trading!
happy7840
39
happy7840 2026.09.29 17:04 

Finding concise SMC education is usually hard, but the included manual and playbook deliver the essentials without any fluff. Combined with the visual workspace, I was able to put SMC into practice right away. Truly grateful for this tool!

Sergejs Rozkalns
5903
개발자의 답변 Sergejs Rozkalns 2026.09.29 19:01
Thank you for taking the time to write this - it means a lot. "Without any fluff" was exactly the goal. The playbook is one page of theory, one daily process and one checklist, because what you actually need at the chart usually gets buried under long explanations. I built this workspace for my own trading first, so I am really glad it let you put SMC into practice right away. For anyone reading this: the PDF manual and the zone-reading playbook come with the purchase - message me on MQL5 after you buy and I will send them over. And if a setup on your chart ever does not read the way the playbook describes, send me a screenshot in private messages and we will go through it together.
리뷰 답변