RSI Alerts MT5
- Göstergeler
- Sürüm: 1.6
- Güncellendi: 11 Şubat 2026
- Etkinleştirmeler: 20

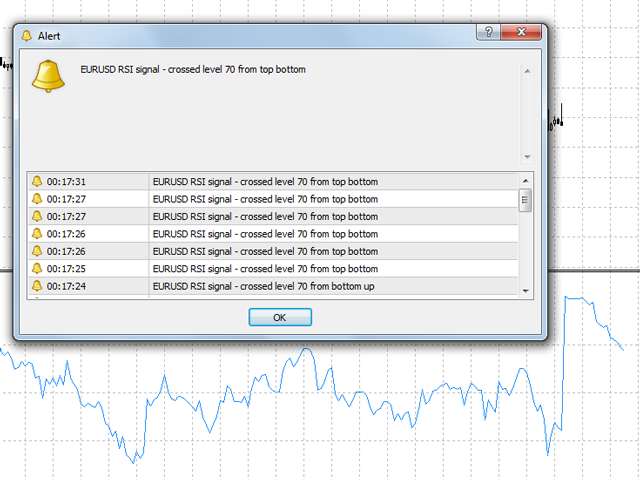
RSI Alerts, klasik Relative Strength Index (RSI) gostergesine pratik uyarılar ekleyen bir MetaTrader 5 gostergesidir. RSI cizgisi ve 30, 50, 70 seviyeleri aynen gorunur; secilen seviyeler gecildiğinde gostergede acılır uyarılar, push bildirimleri ve e-posta gonderilebilir - olası donuş veya kırılımı kacırmazsınız.
Neye dayanıyor?
Gosterge standart RSI (Relative Strength Index) uzerine kuruludur - milyonlarca trader'ın aşırı alım/aşırı satım ve momentum değişimini değerlendirmek icin kullandığı aynı osilator. RSI Alerts RSI formulunu değiştirmez; yalnızca RSI cizgisini izler ve istediğiniz seviyeleri gectiğinde sizi bilgilendirir.
- - Aşırı alım bolgesi (orn. 70, ayarlanabilir) - genelde cekilmeler veya kısa girişler icin kullanılır
- - Aşırı satım bolgesi (orn. 30, ayarlanabilir) - toparlanmalar veya uzun girişler icin
- - Orta cizgi (50) - trend veya momentum onayı icin
Hangi gecişlerin stratejiniz icin onemli olduğunu siz secersiniz.
Başlıca ozellikler
- - Altı bağımsız uyarı turu - her biri acılıp kapatılabilir:
- - RSI seviye 70'i aşağıdan yukarı gecer (aşırı alım)
- - RSI seviye 70'i yukarıdan aşağı gecer
- - RSI seviye 30'u aşağıdan yukarı gecer (aşırı satım)
- - RSI seviye 30'u yukarıdan aşağı gecer
- - RSI seviye 50'yi aşağıdan yukarı gecer
- - RSI seviye 50'yi yukarıdan aşağı gecer
- - Zaman filtresi - uyarılar yalnızca belirlenen pencerede (orn. sunucu saati 00:00-06:00) izinlidir. Başlangıc = bitiş = 24 saat.
- - Birden fazla bildirim kanalı - acılır uyarılar, MT5 push ve e-posta (her biri ayrı acılabilir).
- - RSI ayarları - periyot, fiyat turu (Close / Open / High / Low / Median / Typical / Weighted), aşırı alım/aşırı satım seviyeleri (varsayılan 70/30), cizgi rengi ve kalınlığı, seviye renkleri.
- - Sinyal bar secimi - mevcut bar (0) veya N bar oncesi (1-10) kontrol edilerek gurultu azaltılabilir veya kapanmış mum esas alınabilir.
- - Mesaj şablonları - uyarı metninde `%num%` (bar numarası) ve `%level%` (seviye değeri) yer tutucuları kullanılabilir.
- - Hafta sonu gap koruması - barlar arasında buyuk zaman farkı olduğunda (orn. cuma -> pazartesi) sinyal gonderilmez, yanlış tetiklemeler onlenir.
Kimlere uygun?
- - RSI ile giriş yapan swing ve pozisyon trader'ları, onemli seviyelere gelindiğinde uyarı isteyenler.
- - Birden fazla enstruman ve zaman diliminde işlem yapıp tum grafikleri takip edemeyenler - bildirim yalnızca koşul sağlandığında gelir.
- - RSI'yı filtre olarak kullanan algoritmik veya insiyaki trader'lar, uyarıda analiz veya manuel emir vermek isteyenler.
- - Ekran başında 24/7 oturmak istemeyen ama RSI tabanlı kurulumları kacırmak istemeyen herkes.
Ayar listesi ve anlamları
=== Alert settings ===
- Enable popup alerts - Acılır uyarıları ac/kapat (varsayılan acık).
- Signal: RSI crosses above level (overbought) - RSI aşırı alım seviyesini (orn. 70) aşağıdan yukarı gectiğinde uyarı (varsayılan kapalı).
- Signal: RSI crosses below level (overbought) - RSI aşırı alım seviyesini yukarıdan aşağı gectiğinde uyarı (varsayılan acık).
- Signal: RSI crosses above level (oversold) - RSI aşırı satım seviyesini (orn. 30) aşağıdan yukarı gectiğinde uyarı (varsayılan acık).
- Signal: RSI crosses below level (oversold) - RSI aşırı satım seviyesini yukarıdan aşağı gectiğinde uyarı (varsayılan kapalı).
- Signal: RSI crosses above level 50 - Seviye 50'nin aşağıdan yukarı gecilmesinde uyarı (varsayılan kapalı).
- Signal: RSI crosses below level 50 - Seviye 50'nin yukarıdan aşağı gecilmesinde uyarı (varsayılan kapalı).
- Bar to check for signal (0 = current bar) - Geciş kontrolunde kullanılan bar: 0 = mevcut, 1 = bir bar once, ... 10'a kadar (varsayılan 1).
- Send push notifications - MT5 push bildirimlerini ac/kapat (varsayılan kapalı).
- Send email - Uyarı metninin e-posta ile gonderilmesini ac/kapat; MT5 posta ayarları yapılmış olmalı (varsayılan kapalı).
=== Alert time filter (HH:MM, Start=End = 24h) ===
- Window start (e.g. 00:00) - İzin verilen zaman penceresinin başlangıcı (sunucu saati), bicim HH:MM (orn. 00:00).
- Window end (e.g. 06:00) - Pencere sonu, bicim HH:MM. Başlangıc = Bitiş ise uyarılar 24 saat izinlidir.
=== RSI settings ===
- RSI period - RSI hesaplama periyodu (varsayılan 14).
- Applied price - RSI icin fiyat (Close / Open / High / Low / Median (High+Low)/2 / Typical (High+Low+Close)/3 / Weighted (High+Low+Close+Close)/4), varsayılan Close.
- Overbought level - Aşırı alım seviyesi, RSI birimi (varsayılan 70).
- Oversold level - Aşırı satım seviyesi, RSI birimi (varsayılan 30).
- RSI line color - RSI gosterge cizgisi rengi.
- RSI line width - RSI cizgi kalınlığı, piksel (varsayılan 1).
- Horizontal levels color (30, 50, 70) - 30, 50 ve 70 seviye cizgilerinin rengi.
=== Alert message templates (%num%=bar, %level%=level) ===
- MessageCrossUp - Seviye aşağıdan yukarı gecildiğinde uyarı metni. Metinde `%num%` (bar numarası) ve `%level%` (seviye değeri) kullanılabilir.
- MessageCrossDown - Seviye yukarıdan aşağı gecildiğinde uyarı metni. Aynı yer tutucular `%num%` ve `%level%`.
RSI Alerts v1.6 - MetaTrader 5. Standart RSI tabanlıdır; yalnızca bilgi amaclıdır. Gecmiş sonuclar gelecek sonucları garanti etmez.


It doesnt send notifications, all settings are correct: as it should be