RSI Alerts MT5
- Indicadores
- Versão: 1.6
- Atualizado: 11 fevereiro 2026
- Ativações: 20

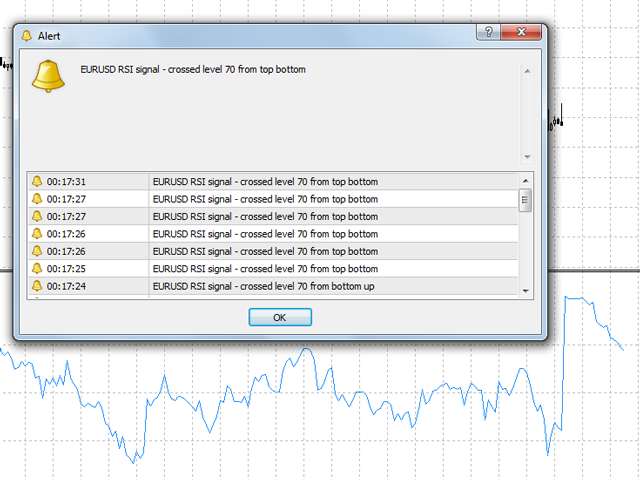
RSI Alerts e um indicador para MetaTrader 5 que adiciona alertas praticos ao classico Relative Strength Index (RSI). Voce continua a ver a linha RSI e os niveis 30, 50, 70, mas ao cruzar os niveis escolhidos o indicador pode mostrar alertas popup, enviar notificacões push e e-mail - assim não perde uma possivel reversão ou rompimento.
Em que se baseia?
O indicador e baseado no RSI padrão (Relative Strength Index) - o mesmo oscilador usado por milhões de traders para avaliar sobrecompra/sobrevenda e mudancas de momentum. O RSI Alerts não altera a formula do RSI; apenas acompanha a linha RSI e notifica quando ela cruza os niveis desejados.
- - Zona de sobrecompra (ex.: 70, configuravel) - muitas vezes usada para buscar retracões ou entradas short
- - Zona de sobrevenda (ex.: 30, configuravel) - para recuperacões ou entradas long
- - Linha media (50) - para confirmar tendencia ou momentum
Voce escolhe quais cruzamentos importam para a sua estrategia.
Principais funcões
- - Seis tipos de alerta independentes - cada um pode ser ligado ou desligado:
- - RSI cruza o nivel 70 de baixo para cima (sobrecompra)
- - RSI cruza o nivel 70 de cima para baixo
- - RSI cruza o nivel 30 de baixo para cima (sobrevenda)
- - RSI cruza o nivel 30 de cima para baixo
- - RSI cruza o nivel 50 de baixo para cima
- - RSI cruza o nivel 50 de cima para baixo
- - Filtro de tempo - alertas permitidos apenas numa janela definida (ex.: 00:00-06:00 hora do servidor). Se inicio = fim = 24h.
- - Varios canais de notificacão - alertas popup, notificacões push MT5 e e-mail (cada um ativado em separado).
- - Ajustes do RSI - periodo, tipo de preco (Close / Open / High / Low / Median / Typical / Weighted), niveis sobrecompra/sobrevenda (padrão 70/30), cor e espessura da linha, cores dos niveis.
- - Escolha do bar para o sinal - verificar o bar atual (0) ou o bar de N bars atras (1-10) para reduzir ruido ou usar uma vela fechada.
- - Modelos de mensagem - no texto do alerta pode usar os marcadores `%num%` (numero do bar) e `%level%` (valor do nivel).
- - Protecão contra gap de fim de semana - quando ha grande intervalo de tempo entre bars (ex.: sexta -> segunda) o sinal não e enviado para evitar disparos falsos.
Para quem?
- - Traders de swing e posicão que usam o RSI para entradas e querem alertas ao atingir niveis-chave.
- - Quem opera varios instrumentos e timeframes e não consegue acompanhar todos os graficos - as notificacões so chegam quando a condicão e atendida.
- - Traders com trading algoritmico ou discricionario que usam o RSI como filtro e querem analisar ou colocar ordens manualmente no alerta.
- - Quem não quer ficar em frente ao ecrã 24/7 mas não quer perder setups baseados no RSI.
Lista de parametros e significado
=== Alert settings ===
- Enable popup alerts - Ligar/desligar alertas popup (padrão ligado).
- Signal: RSI crosses above level (overbought) - Alerta quando o RSI cruza o nivel de sobrecompra (ex.: 70) de baixo para cima (padrão desligado).
- Signal: RSI crosses below level (overbought) - Alerta quando o RSI cruza o nivel de sobrecompra de cima para baixo (padrão ligado).
- Signal: RSI crosses above level (oversold) - Alerta quando o RSI cruza o nivel de sobrevenda (ex.: 30) de baixo para cima (padrão ligado).
- Signal: RSI crosses below level (oversold) - Alerta quando o RSI cruza o nivel de sobrevenda de cima para baixo (padrão desligado).
- Signal: RSI crosses above level 50 - Alerta ao cruzar o nivel 50 de baixo para cima (padrão desligado).
- Signal: RSI crosses below level 50 - Alerta ao cruzar o nivel 50 de cima para baixo (padrão desligado).
- Bar to check for signal (0 = current bar) - Índice do bar usado para verificar o cruzamento: 0 = atual, 1 = um bar atras, ... ate 10 (padrão 1).
- Send push notifications - Ligar/desligar notificacões push do MT5 (padrão desligado).
- Send email - Ligar/desligar envio do texto do alerta por e-mail; as definicões de correio do MT5 tem de estar configuradas (padrão desligado).
=== Alert time filter (HH:MM, Start=End = 24h) ===
- Window start (e.g. 00:00) - Inicio da janela horaria permitida (hora do servidor), formato HH:MM (ex.: 00:00).
- Window end (e.g. 06:00) - Fim da janela, formato HH:MM. Se Inicio = Fim, alertas permitidos 24h.
=== RSI settings ===
- RSI period - Periodo de calculo do RSI (padrão 14).
- Applied price - Preco para o RSI (Close / Open / High / Low / Median (High+Low)/2 / Typical (High+Low+Close)/3 / Weighted (High+Low+Close+Close)/4), padrão Close.
- Overbought level - Nivel de sobrecompra em unidades RSI (padrão 70).
- Oversold level - Nivel de sobrevenda em unidades RSI (padrão 30).
- RSI line color - Cor da linha do indicador RSI.
- RSI line width - Espessura da linha RSI em pixels (padrão 1).
- Horizontal levels color (30, 50, 70) - Cor das linhas dos niveis 30, 50 e 70.
=== Alert message templates (%num%=bar, %level%=level) ===
- MessageCrossUp - Texto do alerta quando o nivel e cruzado de baixo para cima. No texto pode usar `%num%` (numero do bar) e `%level%` (valor do nivel).
- MessageCrossDown - Texto do alerta quando o nivel e cruzado de cima para baixo. Os mesmos marcadores `%num%` e `%level%`.
RSI Alerts v1.6 - MetaTrader 5. Baseado no RSI padrão; apenas informativo. Resultados passados não garantem resultados futuros.


It doesnt send notifications, all settings are correct: as it should be