Mattrix Cockpit
- 지표
-
MATTRIX 8x
 Developer of the MATTRIX 8x Currency Strength System — a multi-timeframe framework analyzing all 28 major forex pairs across 8 currencies.
 - 버전: 1.22
- 활성화: 5
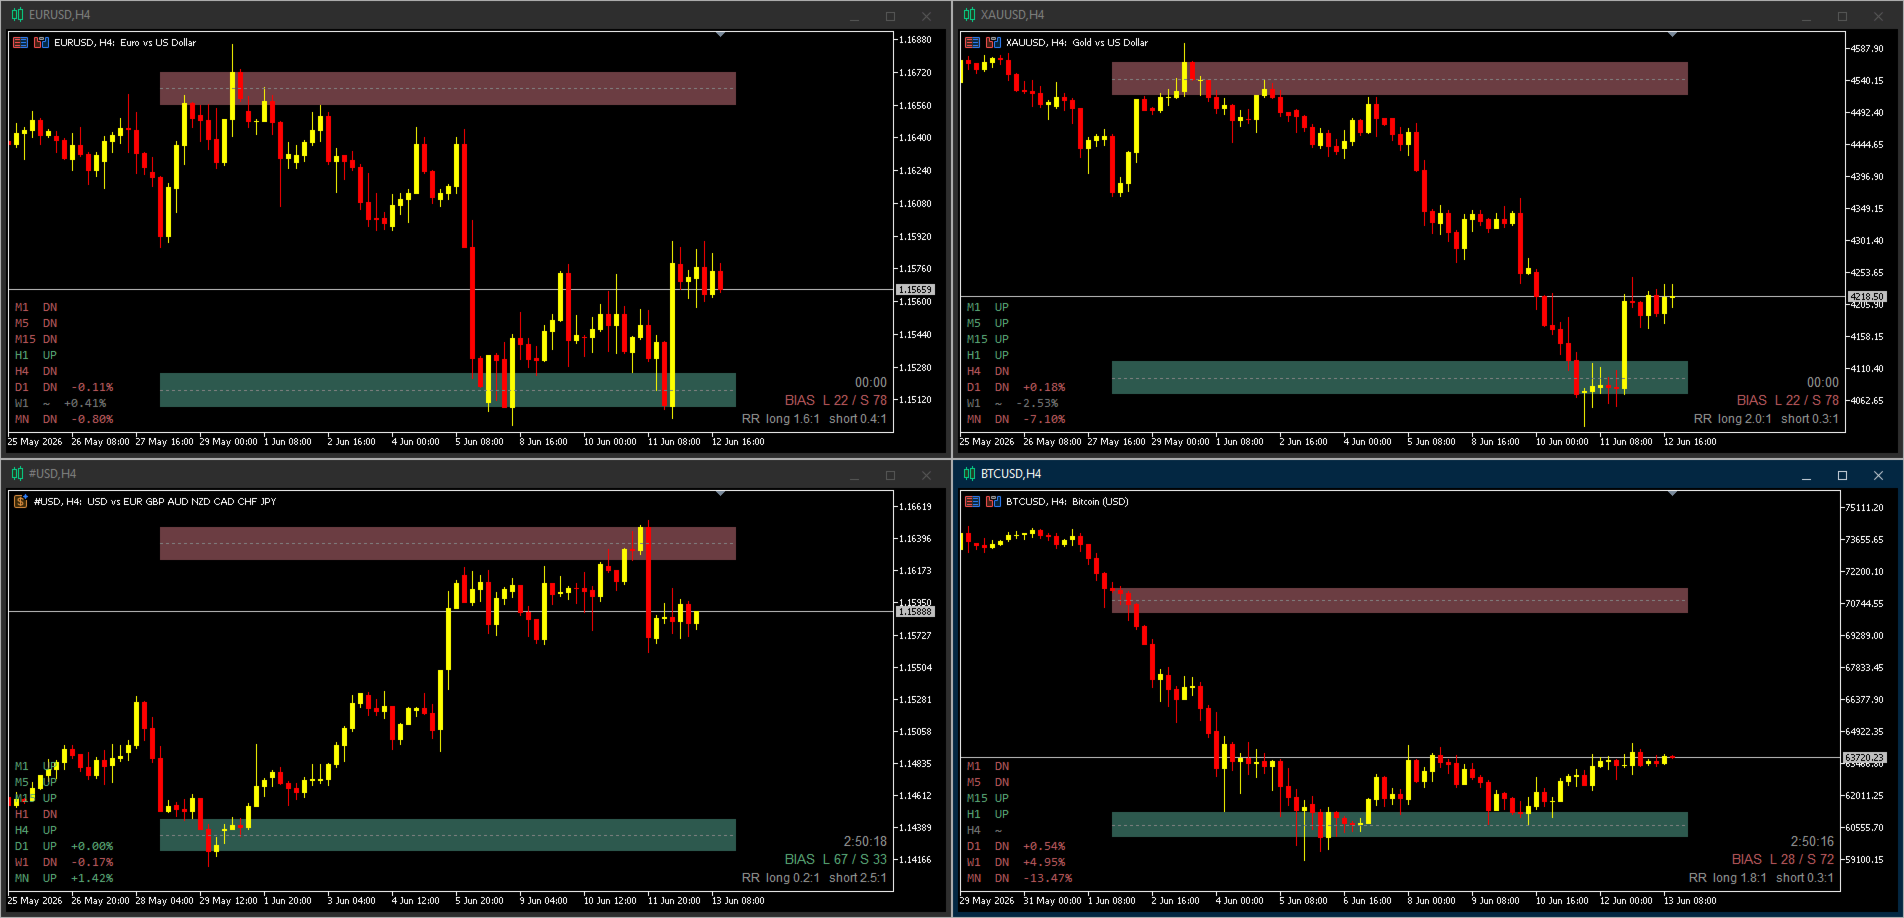
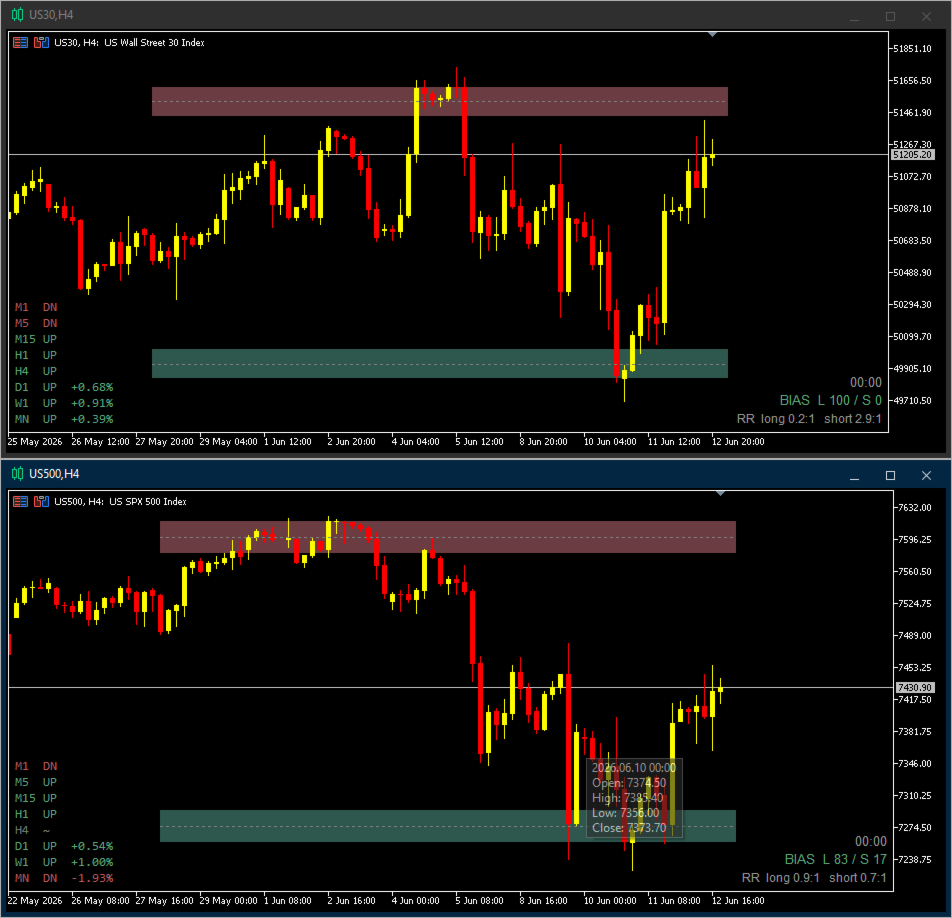
Mattrix Cockpit — read market structure at a glance
A multi-timeframe navigation panel for one chart and any symbol. It shows where
price sits inside its range, the risk-reward of trading either direction, the
trend on every timeframe, and a single weighted directional bias — so you can
read the situation in seconds and make your own call.
━━━━━━━━━━━━━━━━━━━━━━━━
📊 What it shows
▶ Range box over the last N candles, drawn from candle bodies so wicks stand out as rejections
▶ Upper and lower zones with a built-in risk-reward geometry you control with one setting
▶ Live long & short risk-reward for the current price inside the range
▶ Countdown to the close of the current candle
▶ Trend on every timeframe (M1 to MN): UP / DN / ~ (flat)
▶ Day, Week and Month performance in %
▶ Weighted Long / Short bias across your chosen timeframes
━━━━━━━━━━━━━━━━━━━━━━━━
🎯 Trend logic (per timeframe)
▶ UP — price above the EMA50 and the EMA50 is rising
▶ DN — price below the EMA50 and the EMA50 is falling
▶ ~ — transition / no agreement (an honest neutral instead of a forced arrow)
The monthly row follows the current month candle, so it also works on symbols
with limited monthly history, including custom and synthetic charts.
━━━━━━━━━━━━━━━━━━━━━━━━
⚖️ Directional bias
One Long/Short number, weighted across four timeframes. Pick Scalp, Day, Swing
or Auto and tune the weights. Flat timeframes pull the value toward neutral
rather than faking conviction.
━━━━━━━━━━━━━━━━━━━━━━━━
🔔 Alerts (all optional)
▶ Price enters or leaves a zone
▶ Range breakout
▶ Setup — a zone entry aligned with the bias
━━━━━━━━━━━━━━━━━━━━━━━━
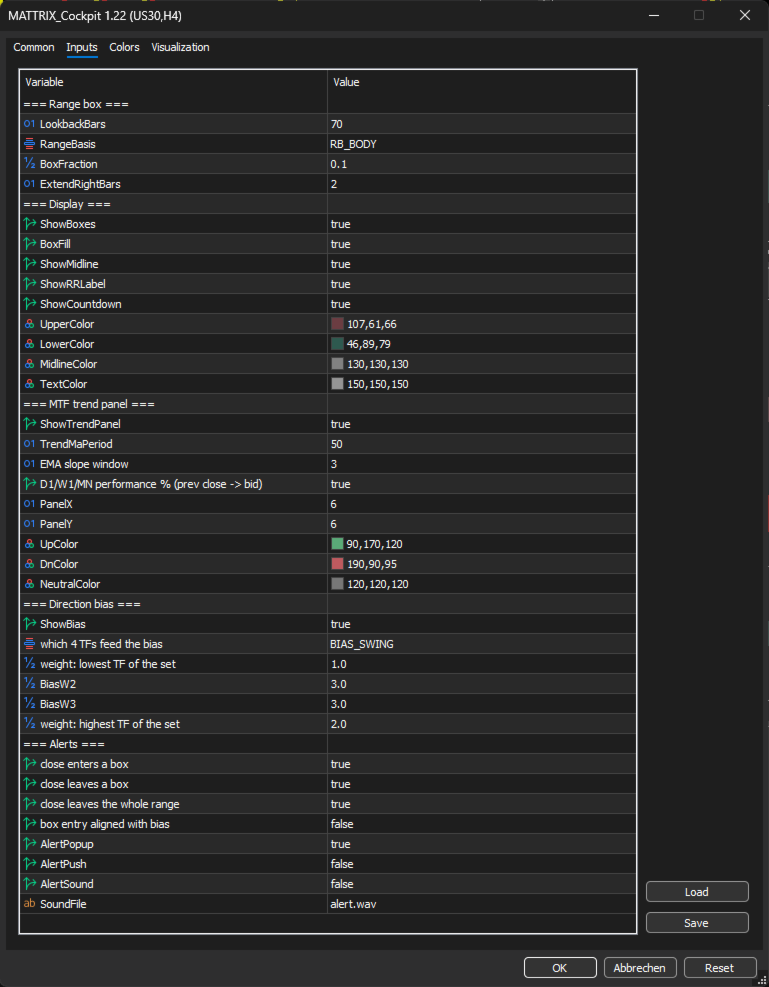
⚙️ Key settings
▶ Range lookback (number of candles)
▶ Box Fraction — controls the zone geometry; smaller = more ambitious target
(e.g. 0.10 ≈ 8:1, 0.25 ≈ 2:1)
▶ Bias mode and weights, EMA period, alert toggles, colors
━━━━━━━━━━━━━━━━━━━━━━━━
🛠 Notes
▶ Works on any symbol and any timeframe
▶ Just as comfortable on currency-strength and synthetic basket charts as on standard pairs
▶ Part of the MATTRIX 8x toolkit — see my profile for the basket and strength tools it pairs with
▶ Best trading experience alongside our Mattrix One Click Basket Trade EA
▶ Pure on-chart analysis — it does not place trades
▶ Updates live; the range is built from closed candles
▶ Draws only its own objects and leaves the rest of your chart untouched
▶ Lightweight: the panel refreshes on a one-second timer, not on every tick
Mattrix Cockpit organizes what the chart is already telling you — structure,
risk-reward, trend and bias — so you can navigate faster. It is a decision-
support tool for discretionary traders and makes no performance promises.
(c) Matthias Scholz · mattrix8x.com
IN CHART VERITAS ⚡