Mattrix Cockpit
- Indicatori
-
MATTRIX 8x
 Developer of the MATTRIX 8x Currency Strength System — a multi-timeframe framework analyzing all 28 major forex pairs across 8 currencies.
 - Versione: 1.33
- Aggiornato: 11 settembre 2026
- Attivazioni: 5
Mattrix Cockpit — read market structure at a glance
A multi-timeframe navigation panel for one chart and any symbol. It shows where
price sits inside its range, the risk-reward of trading either direction, the
trend on every timeframe, and a single weighted directional bias — so you can
read the situation in seconds and make your own call.
━━━━━━━━━━━━━━━━━━━━━━━━
📊 What it shows
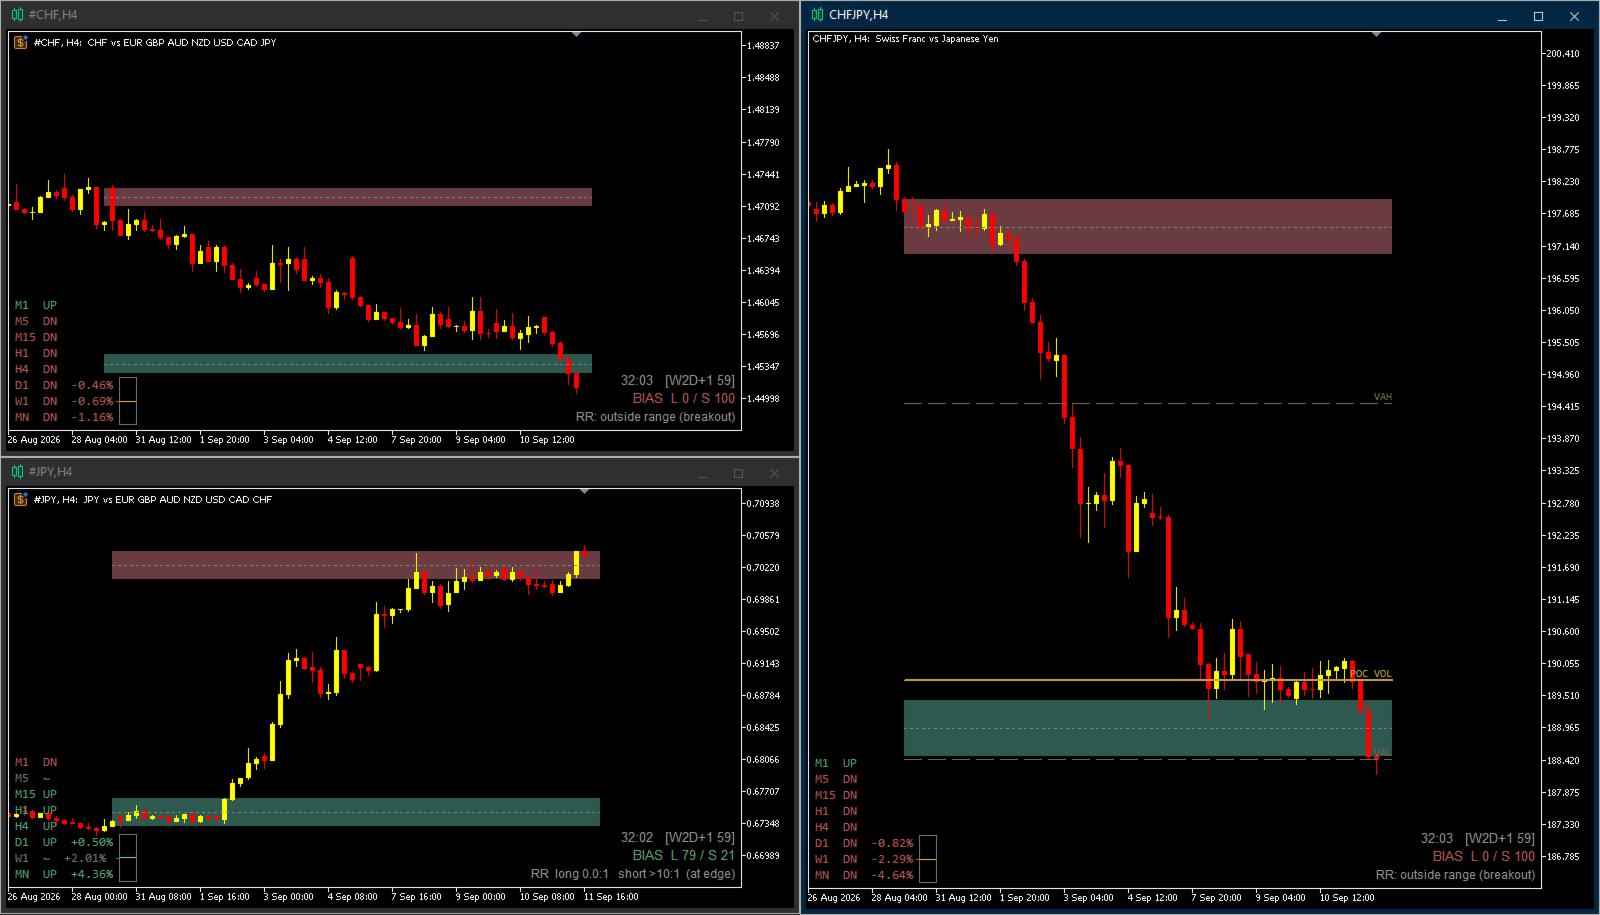
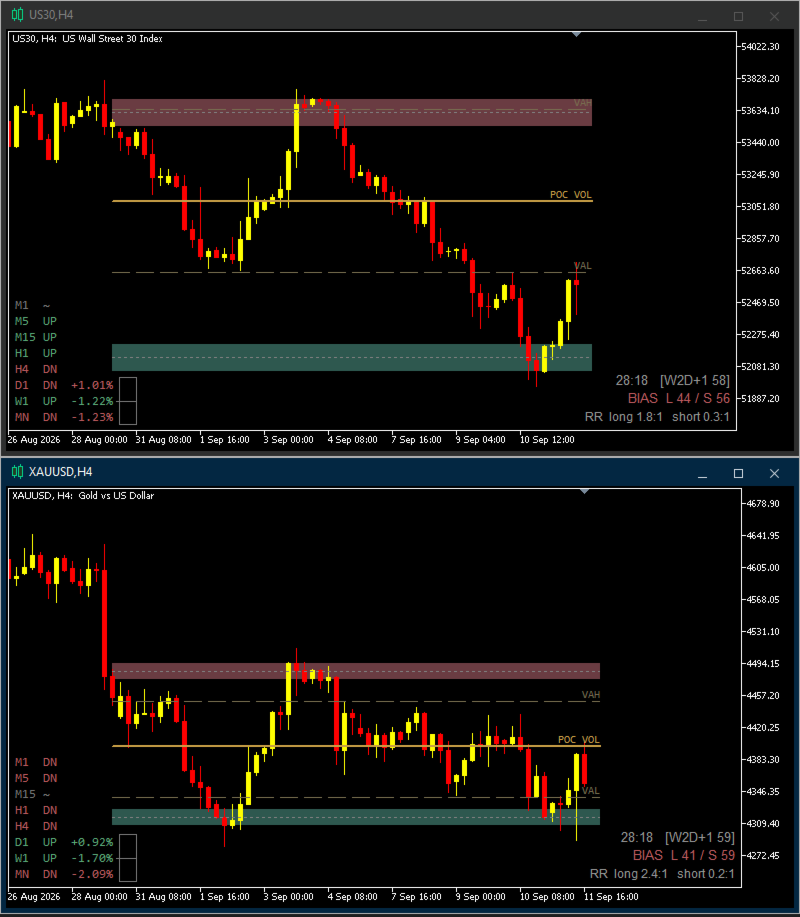
▶ Range box over the last N candles, drawn from candle bodies so wicks stand out as rejections
▶ Upper and lower zones with a built-in risk-reward geometry you control with one setting
▶ Live long & short risk-reward for the current price inside the range
▶ Countdown to the close of the current candle
▶ Trend on every timeframe (M1 to MN): UP / DN / ~ (flat)
▶ Day, Week and Month performance in %
▶ Weighted Long / Short bias across your chosen timeframes
━━━━━━━━━━━━━━━━━━━━━━━━
🎯 Trend logic (per timeframe)
▶ UP — price above the EMA50 and the EMA50 is rising
▶ DN — price below the EMA50 and the EMA50 is falling
▶ ~ — transition / no agreement (an honest neutral instead of a forced arrow)
The monthly row follows the current month candle, so it also works on symbols
with limited monthly history, including custom and synthetic charts.
━━━━━━━━━━━━━━━━━━━━━━━━
⚖️ Directional bias
One Long/Short number, weighted across four timeframes. Pick Scalp, Day,
Swing or Auto and tune the weights. Each timeframe contributes according
to how far price stands from its EMA50, measured in ATR - a market
clinging to its average counts for less than one standing well clear of
it. Flat timeframes pull the value toward neutral rather than faking
conviction.
━━━━━━━━━━━━━━━━━━━━━━━━
📐 Range window
A fixed candle count means something different on every timeframe:
70 candles are six hours on M5 and a quarter of a year on D1. The
range window can therefore follow the calendar instead.
▶ Auto — follows the chart timeframe: up to M15 the current day, up to
H4 the current week, up to D1 the current month. Above D1 the fixed
candle count applies, because a calendar anchor holds too few candles
to build a range from.
▶ Today / This week / This month — set the anchor yourself
▶ Fixed bar count — the classic behaviour, unchanged
Monday morning and the first of the month leave too few candles for a
meaningful range, so whole previous periods are added until the minimum
is reached. The left edge of the box stays on a calendar boundary. The
active window is shown in the RR label, for example [W2D 34].
Weeks start Sunday 00:00 server time, so the Sunday session counts
toward the current week.
━━━━━━━━━━━━━━━━━━━━━━━━
📐 Profile - POC and value area
The range box shows where the extremes were. The profile shows where themarket actually spent itself: POC is the busiest price band, VAH and VALenclose 70 percent of the profile. TPO counts how many candles touchedeach band and needs no volume data at all; Volume uses tick volume, whichon FX and CFDs counts price changes rather than traded size. Off by default.
━━━━━━━━━━━━━━━━━━━━━━━━
🎯 Pullback barometer
A bar beside the D1/W1/MN rows, combining the two readings that otherwisesit side by side without touching: the bias direction, and how favourablyprice sits inside the range window. A long bias with price low in therange fills the bar; the same bias with price at the top leaves it almostempty - confirmed, but late. It answers whether this is a good place tojoin, not which way to go.
🔔 Alerts (all optional)
▶ Price enters or leaves a zone
▶ Range breakout
▶ Setup — a zone entry aligned with the bias
━━━━━━━━━━━━━━━━━━━━━━━━
⚙️ Key settings
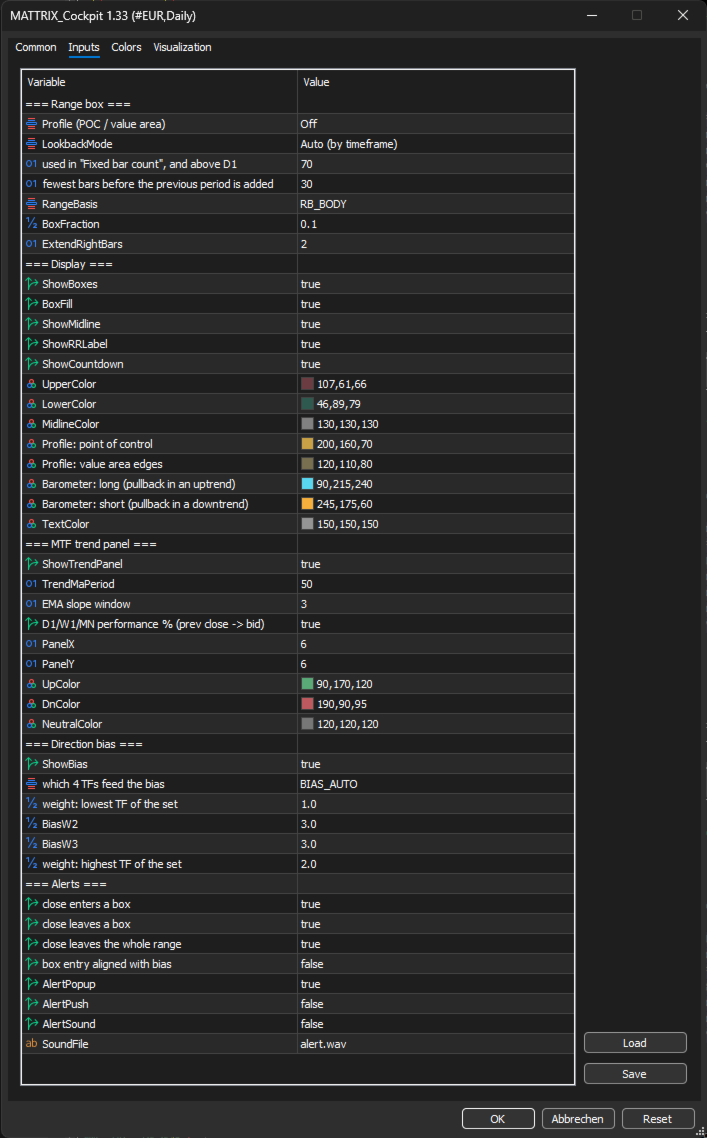
▶ Range window — Auto / Today / This week / This month / fixed candle count
▶ Minimum candles before the previous period is added
▶ Box Fraction — controls the zone geometry; smaller = more ambitious target
(e.g. 0.10 ≈ 8:1, 0.25 ≈ 2:1)
▶ Bias mode and weights, EMA period, alert toggles, colors
▶ Profile (off / TPO / volume)
▶ Barometer colours (cyan / amber, chosen for colour-deficiency safety)
▶ Profile (off / TPO / volume)
▶ Barometer colours (cyan / amber, chosen for colour-deficiency safety)
━━━━━━━━━━━━━━━━━━━━━━━━
🛠 Notes
▶ Works on any symbol and any timeframe
▶ Just as comfortable on currency-strength and synthetic basket charts as on standard pairs
▶ Part of the MATTRIX 8x toolkit — see my profile for the basket and strength tools it pairs with
▶ Best trading experience alongside our Mattrix One Click Basket Trade EA
▶ Pure on-chart analysis — it does not place trades
▶ Updates live; the range is built from closed candles
▶ Draws only its own objects and leaves the rest of your chart untouched
▶ Lightweight: the panel refreshes on a one-second timer, not on every tick
Mattrix Cockpit organizes what the chart is already telling you — structure,
risk-reward, trend and bias — so you can navigate faster. It is a decision-
support tool for discretionary traders and makes no performance promises.
(c) Matthias Scholz · mattrix8x.com
IN CHART VERITAS ⚡