VR Pivot

  • 지표
  • Vladimir Pastushak
    Vladimir Pastushak
    🤝 안녕하세요, 친구님! 제 페이지에 오신 것을 환영합니다!
    저는 블라디미르입니다. 20년 이상 전문 거래 도구를 개발해 왔습니다. 제 모든 솔루션은 오로지 제 자신의 아이디어와 개발 결과에 기반합니다. 거래 애플리케이션 제작은 단순한 일이 아니라 제 진정한 열정입니다. 매일 최신 개념을 테스트하고 독특한 거래 로봇 알고리즘에 구현합니다.
    당신은 라이브 계정에 대한 제품의 데모 버전이 필요하십니까? 채팅에 나에게 쓰기.
    💥유용한 기사:
  • 버전: 23.20
  • 업데이트됨: 13 2월 2023
  • 활성화: 20

VR Pivot is an indicator of key pivot points.

Pivot points are a special type of support and resistance levels that are used to determine the strongest price zones. Professional traders use pivot levels to determine prices at which there is a high probability of a price reversal. The levels are calculated using special mathematical formulas, which include the closing, opening, high, and low prices of the previous time period. The most effective is the daily period. It is important to note that at first glance it may seem that there is nothing special about these levels, but if you analyze the price movement using pivot levels, you can clearly see that in most cases these levels show good, accurate results.

You can request technical support, settings and demo versions of programs in the author's profile.

Pivot levels can be used not only as pivot points, but also as levels at which Take Profit can be used as efficiently as possible to maximize profit, Stop Loss to minimize losses as much as possible, and transfer positions to a no-loss zone to reduce risks.

Advantages of the VR Pivot Indicator:

  • The indicator supports the calculation of several formulas:
    • Classic Pivot - the classic formula for pivot points
    • DeMark Pivot - DeMark formula
    • Woodie Pivot - Woodie Formula
    • Camarilla Pivot - Camarilla Formula
    • Fibonacci Pivot - Fibonacci Formula
  • The program is implemented as an indicator and can work together with your Expert Advisors and other indicators
  • It is possible to analyze historical data
  • The program is written in such a way that it displays information for the period set by the user and does not clutter the chart with historical data.
  • The indicator can calculate losses for any financial instruments (Forex, Crypto, CFD, Futures, Metals)
  • The trader can choose any time frames for the calculation
  • The indicator has a large number of settings that allows you to customize it in any style

Indicator operation algorithm

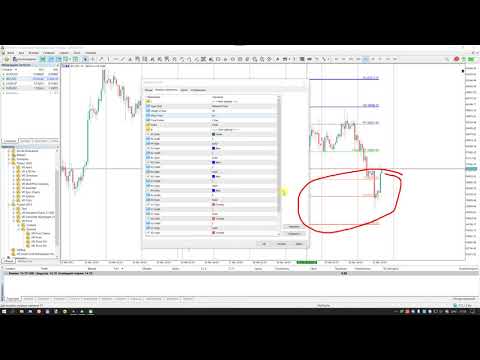
After you drag the indicator from the navigator to the chart, you will see a settings window where you can select the calculation formula and adjust the colors of the levels. After you click the "Ok" button, the chart will display horizontal levels and one vertical level. Using the vertical level, the trader can move the starting point of the calculations. Use the vertical level to study the historical data. To calculate new key levels, move the vertical level to the current period.

Indicator Settings

  • Main settings - main indicator settings
  • Type Pivot - type of pivots
    • Classic Pivot - the classic formula for pivot points
    • DeMark Pivot - DeMark formula
    • Woodie Pivot - Woodie Formula
    • Camarilla Pivot - Camarilla Formula
    • Fibonacci Pivot - Fibonacci Formula
  • Length of lines - the length of horizontal levels in bars
  • Show Price - display prices on levels
  • Time Frame - The period for calculating the levels, must be greater than the period for which the indicator is set
  • Prefix - prefix for indicator objects
  • Color settings - indicator color settings
Versions for MetaTrader 5 Versions for MetaTrader 4
추천 제품
Pivot Points MT4
KEENBASE SOFTWARE SOLUTIONS
KT Pivot Points는 최신 데이터를 기반으로 일간, 주간, 월간 피벗 레벨을 차트에 자동으로 표시합니다. 피벗 포인트는 외환 시장을 포함한 기술적 분석에서 널리 사용되는 지표입니다. 주요 기능 가격이 피벗 레벨에 도달하면 알림을 전송합니다.  각 피벗 레벨 종류별로 완전한 사용자 지정이 가능합니다.   일간, 주간, 월간 피벗 레벨을 깔끔하게 표시합니다. CPU 자원을 적게 사용하여 빠르게 계산됩니다. 차트상의 다른 지표들과 호환됩니다. 피벗 포인트란? 피벗 포인트는 전일의 고가, 저가, 종가의 평균을 이용하여 계산됩니다.  이 계산된 피벗 포인트를 기반으로 향후의 지지 및 저항 수준을 예측할 수 있으며, 이는 해당 수준 근처에서의 가격 움직임을 판단하는 데 도움이 됩니다. 일반적으로 가격이 피벗 포인트 위에서 거래되면 강세 심리를, 아래에서 거래되면 약세 심리를 나타냅니다. 피벗 계산식 피벗 레벨을 계산하기 위해 전일, 주간 또는 월간의 고가, 저가, 종가 데이터를
Smart Trendlines
Suvashish Halder
5 (1)
Smart Trendlines – No.1 Trendlines Indicator Smart Trendlines is a precision tool that automatically draws trendlines based on every valid pivot point, helping traders identify key support and resistance zones. It continuously adjusts as new market pivots form, providing a live and accurate reflection of price structure. Whether you’re tracking trends, preparing for reversals, or anticipating breakouts — this indicator keeps you one step ahead. It works seamlessly across all assets including For
Auto AndrewFork
Noor Ghani Rahman
1 (1)
Auto Pitchfork Indicator The indicator calculate the Pitch fork for the previous Day (Selectable) with multiple Support and Resistance lines from the Median price which acts as Magnet for the Price that if price touch the above warning (1) or below warning (1) lines and not cross up or down then there is maximum possibilities that it will return to the Median Line, and thus maintain the Price Action in Cyclic Pattern to the Market Move. You are able to select how many warning lines you want to k
Raymond Cloudy Day Indicator for MT4 – Pivot-Based Reversal and Trend Levels Raymond Cloudy Day Indicator is a pivot-based level indicator for MetaTrader 4 (MT4). It was developed by Ngo The Hung based on Raymond’s original idea and is designed to give a structured view of potential reversal zones, trend extensions and support/resistance levels directly on the chart. The default settings are optimised for XAUUSD on the H1 timeframe, but the indicator can be tested and adjusted for other symbols
Grapic ByArrowTrend Pro
Truong Cong Truc
1 (1)
Indicator support for only: Entry Point to Trend Pro Link indicator  support   :   https://www.mql5.com/en/market/product/70867 Supports all currency pairs declared in the definition. Help investors do not need to open many charts. Notice the DEAL:  multiple time frames confluence   M15, H1, H4. Entry Point to Trend Pro The indicator helps investors to identify the earliest and perfect reversal point. Easy to make decision to trade with the trend   Price action trading. support resistance an
FREE
pivot points using by many traders and pivot levels most of the times are very helpfull . this indicator is a custom with internal parameters. it can show two times pivot (weekly and daily). you can choose periods total for each time showing pivots.( 1 week , 2 week ,...1day , 2day ,...) when use weekly and daily pivots , it can show you many support and resistance zones. if have proposal comment too me for upgrading indicator.
FREE
VJ Pivot Levels
Vijayaratna Kumar Boda
4.25 (4)
Introduction: Whatever trading method you use, it is important to know the Pivot levels to take the key attention for your entries & exits. This indicator has been made using the standard classic formula for Auto drawing the Pivot levels. Also based on the previous day trading range, the probable expected today trading range has been highlighted in a different color for your reference. Output of the Indicator: This Indicator gives the Pivot level Different resistance Levels Different Support le
CRT Candle Range Theory HTF MT4.   Ultimate CRT Indicator: Advanced ICT Concepts and Malaysian SnR Trading System Discounted   Price   $50  !!     Secure your lifetime access   now   before it switches to   subscription-only ! Master the Market Maker's Footprints with the Most Advanced Candle Range Theory Indicator Unlock the true power of   Smart Money Concepts (SMC)   and trade precisely like the institutions with the   Ultimate CRT Indicator . Built exclusively for serious traders, this indic
The   Pivot Point indicator   automatically calculates and displays the pivot point line and support and resistance levels. Pivot can be calculated according to the Classic, Floor, Fibonacci, Woodie, Camarilla or DeMark formula. It is also possible to select the period for calculating the indicator. A trader can choose from daily, weekly, monthly, or user-defined periods. Types of pivots Classic Floor Fibonacci Woodie Camarilla DeMark Main features The indicator shows the current and historic
FREE
FiboZag
Andriy Sydoruk
Indicator FiboZag - transfer the indicator to the chart and the Fibonacci levels will be built automatically on the last ZigZag turn. The main advantage lies in the correct construction of Fibonacci levels and markup of price levels. Simple, visual and effective use. The indicator is not redrawn and does not lag. Works on all currency pairs and on all timeframes.
MP Demark Pivot Levels
Pierre Ksachikian
4 (1)
This indicator is stand alone version from  MP Pivot Levels  (All in one) containing Demark's Pivots. Calculations:     PP = X / 4     R1 = X / 2 - LOWprev     S1 = X / 2 - HIGHprev Uses: When the pair currency price may change the direction of movement. Possible constraints of support and resistance that creates plateaus for the currency pair prices. Tendency identification by comparing the present prices according to current day's pivot point and also the prior day's pivot points. ____________
FREE
PipsZenith Smart Money Swing (SMC) Indicator v1.0 Bring Institutional Trading Power to Your MT4 Charts The PipsZenith Smart Money Swing (SMC) Indicator is a cutting-edge trading tool designed for professional traders who want to trade Smart Money Concepts (SMC) directly in MetaTrader 4. It combines market structure analysis, order block detection, liquidity mapping, and imbalance zones into a single, powerful and fully customizable indicator. This is not just another repainting arrow tool
Pivot Points are a classic technical analysis indicator that calculates the central pivot point (PP) as well as support (S1–S3) and resistance (R1–R3) levels based on the previous day’s High, Low, and Close. The indicator allows you to: • identify key zones where the price may bounce or break through • determine the direction of the trend • find good entry points, as well as set stop loss and take profit levels Indicator settings: • enable/disable PP, R1/S1, R2/S2, R3/S3 • enable/disable price l
FREE
KT Auto Trendline MT4
KEENBASE SOFTWARE SOLUTIONS
KT Auto Trendline draws the upper and lower trendlines automatically using the last two significant swing highs/lows. Trendline anchor points are found by plotting the ZigZag over X number of bars. Features No guesswork requires. It instantly draws the notable trendlines without any uncertainty. Each trendline is extended with its corresponding rays, which helps determine the area of breakout/reversal. It can draw two separate upper and lower trendlines simultaneously. It works on all timeframe
BeST_ Classic Pivot Points is an MT4 Indicator that is based on the widely known and definitely classic Pivot Point of a market prices activity. A pivot point is calculated as an average of significant prices (high,low,close) from the performance of a market in the prior trading period. If the market in the following period trades above the pivot point it is usually evaluated as a bullish sentiment, whereas trading below the pivot point is seen as bearish. A pivot point and the associated suppo
FREE
The price is moving between two curve tunnel lines in a trend. The two lines of a tunnel represent support and resistance. In an uptrend, for instance, a trade might be entered at the support of the trend line (shown by the red line in the chart) and exited at resistance of the upper tunnel line (shown by the blue line). Tunnel show trend direction for any timeframe (if you have enough bars on the chart for higher timeframes). Trend, or price tunnel, can be up, down or sideways. If the current p
SRP (Strong Retracement/Reversal Points) is a powerful and unique support and resistance indicator. It displays the closest important levels which we expect the price retracement/reversal! If all level are broken from one side, it recalculates and draws new support and resistance levels, so the levels might be valid for several days depending on the market! Key Features You can use it in all time-frames smaller than daily! Displays closest significant support and resistance levels Update the le
FREE
support resistance levels indicator mt4: 이 도구는 차트에서 지원 및 저항선과 피보나치 수준을 식별하고 플롯하는 다중 시간대 지표로, 인간의 눈과 동일한 정확도로 작동합니다. TW 외환 지원 및 저항 수준은 복잡한 알고리즘을 갖추고 있어 차트를 스캔하여 이전 가격 안정화 및 반등 수준을 식별하고 터치 횟수를 기록합니다. 수동으로 지원 및 저항 수준과 피보나치 되돌림을 그리는 데 지치셨습니까? 이 제품의 기능을 확인해 보세요. 놀라울 것입니다. 제품 특징: 1. 소규모 및 대규모 수준: 고급 알고리즘을 사용하여 소규모 및 대규모 수준을 사용자 취향에 맞게 사용자 정의하고 추가 수준을 제거할 수 있습니다. 2. 수준 터치 횟수: TW 지원 저항 수준과 브레이크 mt4, 각 수준이 과거에 몇 번 터치되었는지 계산하여 제공하여 각 수준의 강도를 평가할 수 있습니다. 3. 피보나치 수준: 마지막 파도의 피보나치 수준이 동적으로 그려져, 이러한 수
QuantEx Pivot Indicator
Savia Forex Software Solutions
QuantEx Pivot Indicator is a practical MT4 technical analysis tool designed to help traders identify important Fibonacci-based pivot, support, and resistance levels directly on the chart. The indicator monitors price action and plots key levels using a structured calculation framework, giving traders a clearer view of potential reaction zones across different market conditions. QuantEx Pivot Indicator can be used on compatible currency pairs, indices, commodities, stocks, metals, and cryptocurre
.................................if you need pivot point s levels............................... ............................this is a daily pivot point level creator........................... ...it is for daily pivots and show levels at times period H4 , H1 , M30 , M15 ,M 5... .................................also shows levels for 3 last days.............................. ................can use it with other indicators and see important levels...............
FREE
Market Structure ICT 인디케이터 1. 자동화된 시장 구조 분석 가장 큰 장점은 주관적인 해석으로 인한 오류를 줄여준다는 것입니다. 정확한 추세 식별: 추세 지속을 위한 **BOS (구조 돌파)**와 추세 반전을 위한 **CHoCH (추세 성격 변화)**를 자동으로 식별합니다. 스윙 분류: 단기, 중기, 장기 등 시장 구조 유형을 선택할 수 있어 스캘퍼와 스윙 트레이더 모두에게 적합합니다. 2. 전문 대시보드 다른 타임프레임을 확인하기 위해 화면을 전환할 필요가 없습니다. 한눈에 보는 분석: 대시보드는 모든 타임프레임(M1~W1)의 상태를 한 화면에 표시합니다. 점수 시스템: 하위 타임프레임의 점수를 합산하여 전반적인 편향 (Overall Bias) (예: "강한 상승" 또는 "혼조")을 요약해 줍니다. 추세의 신선도: BOS가 방금 발생한 "신규 돌파(Fresh Break)"인지 오래된 구조인지 알려줍니다. 3. 차트 상의 MTF 표시 (멀티 타임프레임) 정밀한 진
The indicator allows to find consolidations. It is meant for channel breakthrough. Easy to use, it has only three parameters: Minimum number of bars to analyze Consolidation tunnel Indicator color It works on all timeframes . Approximate settings are adjusted for H1 by default. Works on all currency pairs. This indicator does not repaint and is not recalculated. All screenshots are real!
This is a Multi-Time-Frame Zigzag indicator You can change parameters of Zigzag, include Zigzag Depth, Zigzag Deviation, Zigzag Backstep. You can choose which Time Frame to display Zigzag by turn ShowXXX to true or false (ShowXXX = ShowM1, ShowM5, ShowM15...). Noted: Lower Time Frame Zigzag will not display on Higher Time Frame. Example: Your current Time Frame is H1, you can not see Zigzag of M1 to M30 even you turn them on.
PLUTO MASTER TURTLE (Binary Option)   The indicator allows you to trade binary options. The recommended timeframe is М5 and the expiration time is 5 minutes. The indicator works on any currency pairs. Trading time is not limited. A possible signal is specified as a arrow above/under a candle. If the arrow remains on the previous candle, you can enter the trade immediately. Arrows are not re-painted! The trading strategy is based on the correlation of the statistical RSI, STO and Candlestick body
Auto Fibo Retracement MT4
Nguyen Tuan Son
3.75 (4)
Auto Fibonacci Retracement Indicator — Flexible and Reliable This is not just another Auto Fibonacci Retracement indicator — it’s one of the most flexible and dependable tools available . If you find it useful, please leave a review or comment to support the project. Check out my other helpful tools below: Timeframes Trend Scanner    - Scan the trend of assets in difference timeframes with multiple indicators Market Trend Scanner   - Scan the trend of multiple-assets in with multiple indicators
FREE
Sniper Trend Fusion
Ilham Hijrah Saputra
Sniper Trend Fusion This indicator is a powerful all-in-one trading tool designed to simplify chart analysis and improve decision-making. It combines multiple proven techniques into a single system, helping traders identify trend direction, volatility, key price levels, and market structure without clutter. Instead of switching between multiple indicators, everything you need is integrated into one smooth and efficient interface. Key Advantages All-in-One System Combines trend, volatility, sup
FREE
Update:ver1.53 (2023/08/16) ・ Overview and required environment Generate a duplicate limit order reservation for manual orders or orders from other tools, etc. This is specialized to "simplify the ordering operation". For the analysis to decide ordering, please do your best by yourself, such as fishing for materials, deriving a rule of thumb, using other analysis tools and EA together, etc. Since version 1.28, the function of "automatically re-order after settlement" has been implemented. (This
FREE
Classic Fractals indicator for MT4, with additional Trendlines connecting the latest couples of fractals ( fractals are showing highest high, and lowest low on each period) Rules for trendlines: -if new top fractal is below the last one = new resistance line -if new bot fractal is above the last one = new support line -Trendlines can be hidden -Fractals can be hidden Fractal Period = can be both even or uneven number, as it is setting for half (one side) of the bars sequence for findin
What is a Pivot? A pivot is a significant price level known in advance which traders view as important and may make trading decisions around that level. As a technical indicator, a pivot price is similar to a resistance or support level. If the pivot level is exceeded, the price is expected to continue in that direction. Or the price could reverse at or near that level. What does a Pivot Tell You? There are pivots and pivot points. These terms may mean different things to different people.
Pivot Pro
Igor Semyonov
Description Pivot Pro  is a universal color indicator of the  Pivot Points  levels systems. You can select one of its three versions:  Standard   Old , Standard New  and  Fibo . The system will automatically calculate the  Pivot Point  on the basis of market data for the previous day ( PERIOD_D1 ) and the system of support and resistance levels, three in each. It can also display price tags for each level. You can color the indicator lines. Only a method of calculation of the third level of supp
이 제품의 구매자들이 또한 구매함
Neuro Poseidon MT4
Daria Rezueva
4.94 (31)
Neuro Poseidon is a new indicator by Daria Rezueva. It combines precise trading signals with adaptive TP/SL levels - creating best possible trades as a result! Message me and get  Neuro Poseidon Assistant  as a gift to automize your trading process! What makes it stand out? 1. Proven profitability on all assets and timeframes 2. Only confirmed BUY and SELL signals present on the chart 3. Adaptive TP & SL levels generated by the software for each trade 4. Easy to understand - suitable for all
Gann Made Easy
Oleg Rodin
4.84 (165)
Gann Made Easy 는 mr.의 이론을 사용하여 최고의 거래 원칙을 기반으로 하는 전문적이고 사용하기 쉬운 Forex 거래 시스템입니다. W.D. 간. 이 표시기는 Stop Loss 및 Take Profit Levels를 포함하여 정확한 BUY 및 SELL 신호를 제공합니다. PUSH 알림을 사용하여 이동 중에도 거래할 수 있습니다. 구매 후 거래 방법 안내 및 유용한 추가 지표를 무료로 받으시려면 저에게 연락주세요! 아마도 Gann 거래 방법에 대해 이미 여러 번 들었을 것입니다. 일반적으로 Gann의 이론은 초보자 거래자뿐만 아니라 이미 거래 경험이 있는 사람들에게도 매우 복잡한 것입니다. Gann의 거래 방식은 이론적으로 적용하기 쉽지 않기 때문입니다. 나는 그 지식을 연마하고 Forex 지표에 최고의 원칙을 적용하기 위해 몇 년을 보냈습니다. 표시기는 적용하기가 매우 쉽습니다. 차트에 첨부하고 간단한 거래 권장 사항을 따르기만 하면 됩니다. 지표는 지속적으로 시장 분석
Dynamic Forex28 Navigator
Bernhard Schweigert
4.43 (7)
Dynamic Forex28 Navigator - 차세대 외환 거래 도구. 현재 49% 할인. Dynamic Forex28 Navigator는 오랫동안 인기 있는 지표의 진화형으로, 세 가지의 힘을 하나로 결합했습니다. 고급 통화 Strength28 지표(695개 리뷰) + 고급 통화 IMPULSE with ALERT(520개 리뷰) + CS28 콤보 신호(보너스). 지표에 대한 자세한 정보 https://www.mql5.com/en/blogs/post/758844 차세대 Strength 지표는 무엇을 제공합니까?  원래 지표에서 좋아했던 모든 것이 새로운 기능과 더 높은 정확도로 강화되었습니다. 주요 기능: 독점적인 통화 Strength 공식.  모든 시간대에 걸쳐 부드럽고 정확한 강도선. 추세와 정확한 진입을 식별하는 데 이상적입니다. 역동적인 시장 피보나치 수준(시장 피보나치).  이 지표에만 있는 고유한 기능. 가격 차트가 아닌 통화 강도에 피보나치가 적용됩니다.
M1 Sniper
Oleg Rodin
5 (24)
M1 SNIPER 는 사용하기 쉬운 거래 지표 시스템입니다. M1 시간대에 맞춰 설계된 화살표 지표입니다. 이 지표는 M1 시간대 스캘핑을 위한 단독 시스템으로 사용할 수 있으며, 기존 거래 시스템의 일부로도 사용할 수 있습니다. 이 거래 시스템은 M1 시간대 거래용으로 특별히 설계되었지만, 다른 시간대에도 사용할 수 있습니다. 원래는 XAUUSD와 BTCUSD 거래를 위해 이 방법을 설계했지만, 다른 시장 거래에도 유용하다는 것을 알게 되었습니다. 이 지표의 신호는 추세 방향과 반대로 거래될 수 있습니다. 저는 지표의 신호를 활용하여 양방향으로 거래할 수 있도록 돕는 특별한 거래 기법을 알려드립니다. 이 방법은 특별한 동적 지지선과 저항선 가격 영역을 활용하는 것을 기반으로 합니다. 구매하시면 M1 SNIPER 화살표 지표를 바로 다운로드하실 수 있습니다. 또한, 아래 스크린샷에 표시된 Apollo Dynamic SR 지표는 M1 SNIPER 도구를 사용하는 모든 사용자에게 무료로
Enigmera
Ivan Stefanov
5 (8)
ENIGMERA: 시장의 핵심 중요: MQL5.com의 데모는 Strategy Tester에서 실행되며 Enigmera의 기능을 완전히 반영하지 못할 수 있습니다. 설명, 스크린샷 및 비디오를 확인하여 자세한 내용을 확인하십시오. 질문이 있으면 언제든지 메시지를 보내주세요! 인디케이터의 코드는 완전히 다시 작성되었습니다. 버전 3.0은 새로운 기능을 추가하고 인디케이터가 처음 출시된 이후 누적된 버그를 수정했습니다. 소개 이 인디케이터 및 거래 시스템은 금융 시장에 대한 주목할 만한 접근 방식입니다. ENIGMERA는 프랙탈 주기를 사용하여 정확하게 지원 및 저항 수준을 계산합니다. 실제 축적 단계를 보여주고 방향과 목표를 제공합니다. 트렌드와 수정 모두에서 작동하는 시스템입니다. 작동 방식 인디케이터의 대부분의 기능은 차트 왼쪽에 있는 버튼을 통해 제어되며, 이를 통해 다양한 시장 상황에 빠르게 대응할 수 있습니다. 버튼 ON/OFF – 인디케이터 전체를 표시하거나 숨깁니다.
Scalper Inside PRO
Alexey Minkov
4.74 (68)
Scalper Inside PRO Scalper Inside PRO is an intraday trend and scalping indicator for MetaTrader 4 that uses an exclusive algorithm to quickly detect market direction and key target levels. It automatically calculates entry, exit and multiple profit targets, and shows detailed performance statistics so you can see how different instruments and strategies performed. This helps you choose the most suitable trading instruments for the current market conditions. Additionally, you can easily integrat
Trend Catcher ind
Ramil Minniakhmetov
5 (2)
트렌드 캐처 인디케이터 트렌드 캐처 인디케이터는 개발자가 자체 개발한 맞춤형 적응형 트렌드 분석 지표들을 조합하여 시장 가격 움직임을 분석합니다. 단기적인 노이즈를 제거하고 근본적인 모멘텀 강도, 변동성 확대, 가격 구조 움직임에 집중하여 진정한 시장 방향을 파악합니다. 또한 이동 평균, RSI, 변동성 필터와 같은 맞춤형 지표들을 활용하여 가격을 평활화하고 트렌드를 필터링합니다. 실제 운영 모니터링 및 기타 제품은 다음 링크에서 확인하실 수 있습니다: https://www.mql5.com/en/users/mechanic/seller 텔레그램에서는 EA나 설정 파일을 판매하지 않습니다. 사기이니 주의하세요. 모든 설정 파일은 블로그에서 무료로 제공됩니다. 중요! 구매 후 즉시 연락 주시면 사용 방법 및 보너스를 드립니다!
이 지표는 실제 거래에 완벽한 자동 파동 분석 지표입니다! 사례... 참고:   웨이브 그레이딩에 서양식 이름을 사용하는 데 익숙하지 않습니다. Tang Lun(Tang Zhong Shuo Zen)의 명명 규칙의 영향으로 기본 웨이브를   펜   으로 명명하고 2차 웨이브 밴드를   세그먼트   로 명명했습니다. 동시에, 세그먼트에는 추세 방향이 있습니다.   주요 추세 세그먼트에는   이름이 지정되지만(이 이름 지정 방법은 향후 노트에서 사용됩니다. 먼저 말씀드리겠습니다.) 알고리즘은 굴곡 이론과 거의 관련이 없으므로 그렇게 해서는 안 됩니다. 이는 나의 시장 분석을   통해 요약된 끊임없이 변화하고 복잡한 운영 규칙을   반영합니다. 밴드는 더 이상 사람마다 다르지 않도록 표준화되고 정의되었습니다. 인위적인 간섭의 드로잉 방법은 시장 진입을 엄격하게 분석하는 데 핵심적인 역할을 합니다. 이 지표를 사용하는 것은 거래 인터페이스의 미학을 개선하고 원래의 K-line 거래를
KT Alpha Hunter Arrows MT4
KEENBASE SOFTWARE SOLUTIONS
대부분의 화살표 지표는 신호만 보여주고, 나머지 판단은 모두 트레이더에게 맡깁니다. KT Alpha Hunter Arrows는 완성된 트레이딩 플랜을 함께 제공합니다. 각 신호 화살표가 표시될 때마다 차트에는 진입 라인, 손절선, 네 개의 익절 목표, 그리고 현재 종목과 시간대가 지금 거래할 만한 가치가 있는지 알려주는 실시간 엣지 판정이 함께 그려집니다. 포함된 Trade Manager EA는 사용자가 수동으로 진입한 이후의 실행 관리를 맡아, 시장이 흔들리고 감정이 개입되기 쉬운 순간에도 거래 원칙을 유지할 수 있도록 돕습니다. 리페인트 없음. 확정된 캔들 기준 신호만 표시. Forex, 골드, 지수, 그리고 사용자가 거래하는 모든 상품을 위해 설계되었습니다. 주요 기능 캔들이 마감된 후에만 표시되는 비리페인트 매수 및 매도 화살표. 각 신호마다 진입 라인, 구조적 손절선, 네 개의 익절 목표 제공. Edge Dashboard가 현재 차트의 매수와 매도 셋업을 별도로 평가. 판
Neo Wave PRO
Nikolay Raykov
5 (1)
Price & Time Market Structure Indicator A professional market structure tool that analyzes waves through both price and time — not price alone. Main Description NeoWave PRO is a professional market structure indicator for MetaTrader 4 designed for traders who want to move beyond traditional one-dimensional wave tools such as ZigZag, swing indicators, and basic high/low systems. Most wave indicators analyze only one thing: Price. But a real market wave is not only a price movement. A true wave de
PRO Renko System
Oleg Rodin
5 (30)
PRO Renko System 은 RENKO 차트 거래를 위해 특별히 고안된 매우 정확한 거래 시스템입니다. 이것은 다양한 거래 상품에 적용될 수있는 보편적 인 시스템입니다. 체계는 효과적으로 당신에게 정확한 반전 신호에 접근을 주는 소위 시장 소음을 중화합니다. 이 표시기는 사용하기가 매우 쉽고 신호 생성을 담당하는 매개 변수가 하나만 있습니다. 당신은 쉽게 당신의 선택의 어떤 무역 계기에 공구를 적응시킬 수 있고 renko 막대기의 크기. 나는 항상 당신이 내 소프트웨어로 수익성있게 거래 할 수 있도록 추가 지원을 제공 할 준비가되어 있습니다! 나는 당신에게 행복하고 수익성있는 거래를 기원합니다! 구매 후 저에게 연락하십시오! 내 렌코 차트 생성기를 보내드립니다. 또한 내 개인 권장 사항 및 시스템의 다른 모듈을 무료로 공유 할 것입니다!
Genesis Matrix Pro is a professional multi-timeframe trend detection indicator designed to help traders identify high-quality market alignment with clarity and structure. It combines 12 different technical indicators into one visual alignment matrix, allowing traders to quickly see when market conditions are bullish, bearish, or neutral. A signal is generated only when the selected strategies are aligned, helping reduce noise and improve decision-making. PLEASE CONTACT ME AFTER PURCHASE TO GET
Current event:  https://c.mql5.com/1/326/A2SR2025_NoMusic.gif A. A2SR이란 무엇입니까 ?   * 선행 기술 지표입니다(재도장 없음, 지연 없음). -- 안내 : https://www.mql5.com/en/blogs/post/734748/page4#comment_16532516 -- 및 https://www.mql5.com/en/users/yohana/blog A2SR에는 지원(수요) 및 저항(공급) 수준을 결정하는 특별한 기술이 있습니다. 우리가 인터넷에서 본 일반적인 방식과 달리 A2SR은 실제 SR 수준을 결정하는 독창적인 개념을 가지고 있습니다. 원래 기술은 인터넷에서 가져온 것이 아니며 인터넷에 게시된 적도 없습니다. A2SR은 거래 스타일에 따라 SR 수준을 자동으로 선택합니다. 시간 프레임을 변경해도 SR 레벨은 그대로 유지됩니다. 사용하는 시간 프레임에서 실제 SR을 얻지 못하기 때문입니다. A2SR은 거래를
PZ Trend Trading
PZ TRADING SLU
4.8 (5)
Capture every opportunity: your go-to indicator for profitable trend trading Trend Trading is an indicator designed to profit as much as possible from trends taking place in the market, by timing pullbacks and breakouts. It finds trading opportunities by analyzing what the price is doing during established trends. [ Installation Guide | Update Guide | Troubleshooting | FAQ | All Products ] Trade financial markets with confidence and efficiency Profit from established trends without getting whips
Step into the world of Forex trading with confidence, clarity, and precision using   Gold Indicator   a next-generation tool engineered to take your trading performance to the next level. Whether you’re a seasoned professional or just beginning your journey in the currency markets, Gold Indicator equips you with powerful insights and help you trade smarter, not harder. Built on the proven synergy of three advanced indicators, Gold Indicator focuses exclusively on medium and long-term trends eli
이 제품은 2026년 시장에 맞게 업데이트되었으며 최신 MT5 빌드에 최적화되었습니다. 가격 업데이트 안내: Smart Trend Trading System은 현재 $99 에 제공됩니다. 다음 30회 구매 후 가격은 $199 로 인상됩니다. 특별 혜택: Smart Trend Trading System 구매 후 저에게 개인 메시지를 보내시면 Smart Universal EA를 무료 로 받을 수 있으며, Smart Trend 신호를 자동 거래로 전환할 수 있습니다. Smart Trend Trading System은 리페인트 없음, 재그리기 없음, 지연 없음의 완전한 트레이딩 시스템으로, 더 깨끗한 신호, 더 나은 추세 방향, 그리고 더 체계적인 시장 거래 방식을 원하는 트레이더를 위해 제작되었습니다. Online course , manual and download presets . 이 시스템은 추세 감지, 반전 구간, Smart Cloud, 트레일링 스톱 로직, 지지와 저항, 캔들 색
Scalper Vault
Oleg Rodin
5 (37)
Scalper Vault 는 성공적인 스캘핑에 필요한 모든 것을 제공하는 전문 스캘핑 시스템입니다. 이 표시기는 외환 및 바이너리 옵션 거래자가 사용할 수 있는 완전한 거래 시스템입니다. 권장 시간 프레임은 M5입니다. 시스템은 추세 방향으로 정확한 화살표 신호를 제공합니다. 또한 상단 및 하단 신호와 Gann 시장 수준을 제공합니다.  이 시스템은 사용하기가 매우 쉽습니다. 원하는 시장 지역의 화살표만 따라가면 됩니다. 엑시트는 가격이 적정 수준에 도달하거나 시장의 고점 또는 저점 신호가 나타날 때 수행됩니다.  표시기는 PUSH 알림을 포함한 모든 유형의 경고를 제공합니다. 인디케이터 구매 후 연락주세요. 내 개인 거래 권장 사항과 훌륭한 보너스 지표를 무료로 공유합니다! 나는 당신에게 행복하고 유익한 거래를 기원합니다!
PZ Swing Trading
PZ TRADING SLU
5 (3)
Protect against whipsaws: revolutionize your swing trading approach Swing Trading is the first indicator designed to detect swings in the direction of the trend and possible reversal swings. It uses the baseline swing trading approach, widely described in trading literature. The indicator studies several price and time vectors to track the aggregate trend direction and detects situations in which the market is oversold or overbought and ready to correct. [ Installation Guide | Update Guide | Tro
BTMM State Engine Pro MT4
Garry James Goodchild
BTMM State Engine Pro is a MetaTrader 4 indicator for traders who use the Beat The Market Maker approach: Asian session context, kill zone timing, level progression, peak formation detection, and a multi-pair scanner from a single chart. It combines cycle state logic with a built-in scanner dashboard so you do not need the same tool on many charts at once. What it does Draws the Asian session range; session times can follow broker server offset or be set in inputs. Tracks level progression (L
Dynamic Scalper System
Vitalyi Belyh
5 (1)
" Dynamic Scalper System " 지표는 추세 파동 내에서 스캘핑 방식으로 거래하도록 설계되었습니다. 주요 통화쌍 및 금에서 테스트되었으며, 다른 거래 상품과의 호환성이 가능합니다. 추가적인 가격 변동 지원을 통해 추세에 따라 단기 포지션 진입 신호를 제공합니다. 지표의 원리 큰 화살표는 추세 방향을 결정합니다. 작은 화살표 형태의 스캘핑 신호를 생성하는 알고리즘은 추세 파동 내에서 작동합니다. 빨간색 화살표는 상승 방향을, 파란색 화살표는 하락 방향을 나타냅니다. 민감한 가격 변동선은 추세 방향으로 그려지며, 작은 화살표의 신호와 함께 작용합니다. 신호는 다음과 같이 작동합니다. 적절한 시점에 선이 나타나면 진입 신호가 형성되고, 선이 있는 동안 미결제 포지션을 유지하며, 완료되면 거래를 종료합니다. 권장되는 작업 시간대는 M1~H4입니다. 화살표는 현재 캔들에 형성되며, 다음 캔들이 이미 시작되었더라도 이전 캔들의 화살표는 다시 그려지지 않습니다. 입력 매개
M30/H1/H4 스윙 버전 출시 큰 움직임을 잡고 싶으신가요? Gold Signal Swing Pro (M30/H1/H4). 목표: 거래당 $20-$80+. https://www.mql5.com/en/market/product/177643 KURAMA GOLD SIGNAL PRO (MT4) — 7층 필터, 자동 TP/SL, 품질 점수를 탑재한 XAUUSD 완벽 트레이딩 시스템 리페인트 없음. 리드로우 없음. 지연 없음. 모든 신호는 영구적입니다. 보이는 것이 그대로입니다. 보너스: 영구 라이선스 구매자에게 AI Zone Radar ($59 상당) + 전체 PDF 매뉴얼을 무료 제공. 구매 후 메시지를 보내주세요. AI Zone Radar: https://www.mql5.com/en/market/product/175834 트레이더의 신뢰: 활발한 골드 트레이더 커뮤니티에서 이미 사용 중. 정확도와 사
PZ 123 Pattern
PZ TRADING SLU
1 (1)
Unlock powerful breakout opportunities The 123 Pattern is one of the most popular, powerful and flexible chart patterns. The pattern is made up of three price points: a bottom, a peak or valley, and a Fibonacci retracement between 38.2% and 71.8%. A pattern is considered valid when the price breaks beyond the last peak or valley, moment at which the indicator plots an arrow, rises an alert, and the trade can be placed. [ Installation Guide | Update Guide | Troubleshooting | FAQ | All Products  ]
MonsterDash Harmonic Indicator
Paul Geirnaerdt
4.54 (26)
MonsterDash Harmonic Indicator is a harmonic pattern dashboard. It recognizes all major patterns. MonsterDash is a dashboard that displays all detected patterns for all symbols and (almost) all timeframes in sortable and scrollable format. Users can add their own user defined patterns . MonsterDash can open and update charts with the pattern found. Settings MonsterDash's default settings are good enough most of the time. Feel free to fine tune them to your needs. The color settings are for thos
Apollo SR Master
Oleg Rodin
5 (2)
Apollo SR Master는 지지/저항 구간에서의 거래를 더욱 쉽고 안정적으로 만들어 주는 특수 기능을 갖춘 지지/저항 지표입니다. 이 지표는 지역 가격의 고점과 저점을 감지하여 시간 지연 없이 실시간으로 지지/저항 구간을 계산합니다. 새롭게 형성된 저항 구간을 확인하기 위해 지표는 해당 저항 구간을 실제 매도 또는 매수 신호로 활용할 수 있음을 나타내는 특수 신호를 표시합니다. 이 경우, 저항 구간의 강도가 높아지고, 따라서 저항 구간에서의 성공적인 거래 가능성도 높아집니다. 이것이 바로 이 지표의 핵심 아이디어입니다. SR 존은 손절매와 이익실현을 더욱 쉽게 할 수 있도록 해줍니다. 신호 방향에 따라 SR 존 위 또는 아래 공간을 손절매로 활용할 수 있습니다. 또한, 반대쪽 SR 존은 잠재적 이익실현 영역으로 활용할 수 있습니다. 또한 Apollo SR Master 지표를 사용하는 모든 사용자에게 "Apollo Price Action System" 지표를 무료로 제공합니다.
지진계 Marketquake Detector. Description in English : https://www.mql5.com/en/market/product/113869?source=Site+Market+Product+Page#description How to use the Seismograph : https://www.mql5.com/en/market/product/113869#!tab=comments&page=2&comment=52806941 Create an EA : https://www.mql5.com/en/market/product/113869#!tab=comments&page=3&comment=52816509 어떤 방식으로 거래하든 유동성이 낮은 시장에 진입하는 것을 피하고 싶을 것입니다.- 지진계는 시장 랠리 전에 시장에 진입할 수 있는 적절한 시기를 도와줄 것입니다. 그러나 바쁠 시장 시간에 진입을 확인했음에도 불구하고 많은 사람들이 유동성이 부족한 시
Advanced Currency Strength28 Indicator
Bernhard Schweigert
4.91 (657)
현재 40% 할인 초보자 또는 전문가 트레이더를 위한 최고의 솔루션! 이 지표는 우리가 독점 기능과 새로운 공식을 통합했기 때문에 독특하고 고품질이며 저렴한 거래 도구입니다. 단 하나의 차트로 28 Forex 쌍의 통화 강도를 읽을 수 있습니다! 새로운 추세 또는 스캘핑 기회의 정확한 트리거 포인트를 정확히 찾아낼 수 있기 때문에 거래가 어떻게 개선될지 상상해 보십시오. 사용 설명서: 여기를 클릭  https://www.mql5.com/en/blogs/post/697384 그것이 첫 번째, 원본입니다! 쓸모없는 지망생 클론을 사지 마십시오. 더 스페셜  강력한 통화 모멘텀을 보여주는 하위 창의 화살표 GAP가 거래를 안내합니다! 기본 또는 호가 통화가 과매도/과매도 영역(외부 시장 피보나치 수준)에 있을 때 개별 차트의 기본 창에 경고 표시가 나타납니다. 통화 강도가 외부 범위에서 떨어질 때 풀백/반전 경고. 교차 패턴의 특별 경고 추세를 빠르게 볼 수 있는 다중 시간
Auto Optimized Parabolic RSI: 고급 3D 모멘텀 엔진 대부분의 개인 투자자용 보조지표는 시장의 변동성이 변하는 순간 무용지물이 되는 정적인 입력값에 의존하기 때문에 실패합니다. Auto Optimized Parabolic RSI는 자체적인 수학적 우위를 지속적으로 재계산하여 "보조지표 노후화" 문제를 해결하며, 기관급 퀀트 트레이딩의 적응력을 귀하의 MT5 터미널에 직접 제공합니다. 핵심 이점: 맞춤형 인메모리 3D 최적화   표준 자동 최적화 도구들은 일반적인 보조지표 호출로 터미널에 과부하를 일으켜 MT5 플랫폼을 멈추게 하는 경우가 많습니다. 이 도구는 이러한 병목 현상을 완전히 우회합니다. 맞춤형 네이티브 RAM 기반 계산기로 구축된 내부 엔진은 차트를 로드하거나 타임프레임을 변경할 때마다 빛처럼 빠른 3D 그리드 검색을 실행합니다. RSI 기간(주기), SAR 스텝(가속도) 및 SAR 최대치(속도 제한)를 동시에 스캔하여 플랫폼 지연 없이 수만 개의
Advanced Supply Demand
Bernhard Schweigert
4.91 (300)
현재 40% 할인! 초보자나 전문 트레이더를 위한 최고의 솔루션! 이 보조지표는 우리가 다수의 독창적 기능과 새로운 공식을 통합한 독특하고 고품질이며 저렴한 거래 도구입니다. 이 업데이트를 통해 이중 시간대를 표시할 수 있습니다. 더 높은 TF를 표시할 수 있을 뿐만 아니라 차트 TF와 더 높은 TF 모두를 표시할 수 있습니다: 중첩 영역 표시. 모든 Supply Demand 트레이더들이 좋아할 것입니다. :) 중요한 정보 공개 Advanced Supply Demand의 잠재력을 극대화하려면 다음을 방문하십시오. https://www.mql5.com/ko/blogs/post/720245   진입 또는 목표의 명확한 트리거 포인트를 정확히 찾아냄으로 해서 거래가 어떻게 개선될지 상상해 보십시오. 새로운 알고리즘을 기반으로 매수자와 매도자 간의 잠재적인 불균형을 훨씬 더 쉽게 분간할 수 있습니다. 왜냐하면 가장 강한 공급영역과 가장 강한 수요 영역과 과거에 어떻게 진행 되었는지를(이전
이 인디케이터는 엘리어트 파동 이론과 두 가지 방식으로 작동합니다: 자동 작동: 이 모드에서는 인디케이터가 엘리어트 파동 이론에 따라 차트 상의 모든 5개의 모티브 웨이브를 자동으로 감지하고 예측 및 잠재적인 반전 지역을 제공합니다. 또한 중요한 개발 사항을 트레이더에게 알릴 수 있는 경보 및 푸시 메시지를 생성할 수 있는 능력을 갖추고 있습니다. 이 자동 기능은 엘리어트 파동 패턴의 식별과 분석 프로세스를 간소화합니다. 수동 작동: 이 옵션은 엘리어트 파동 이론을 수동으로 다루고 싶은 트레이더를 위해 설계되었습니다. 이를 통해 사용자는 아홉 가지 다른 등급을 사용하여 웨이브를 그릴 수 있습니다. 각 등급은 나타난 후에 차트에 그려진 라인을 조정하여 개별적으로 정의할 수 있습니다. 이 기능은 웨이브를 수동으로 그리는 프로세스를 간소화하며 더 효율적으로 만들어 줍니다. 중요한 점으로 모든 그림 데이터가 미래 참조를 위해 플랫폼 데이터 폴더에 저장된다는 것을 기억해야 합니다. 파라미터:
Introduction to Fractal Pattern Scanner Fractal Indicator refers to the technical indicator that makes use of the fractal geometry found in the financial market. Fractal Pattern Scanner is the advanced Fractal Indicator that brings the latest trading technology after the extensive research and development work in the fractal geometry in the financial market. The most important feature in Fractal Pattern Scanner is the ability to measure the turning point probability as well as the trend probabi
제작자의 제품 더 보기
VR Smart Grid MT5
Vladimir Pastushak
4.27 (30)
VR Smart Grid는 MetaTrader 4와 MetaTrader 5를 위해 개발된 완전한 기능의 거래 어드바이저이며, 고전적인 그리드 거래 전략을 기반으로 구축되었습니다. 로봇은 독립적으로 포지션을 개설하고, 관리하고, 일부를 결제하여 시장 변화에 적응하는 효율적인 주문 격자를 만듭니다. 15년간의 개발을 거쳐 이 어드바이저는 수천 번의 변형과 테스트를 거쳤습니다. 이는 실제 계정과 데모 계정의 체계적인 개선 결과입니다. 세트 파일, 제품의 데모 버전, 지침 및 보너스를 사용할 수 있습니다. [블로그] 버전: [MetaTrader 4] 지능형 포지션 평균화 VR Smart Grid의 주요 특징 중 하나는 여러 평균화 모드입니다. 스마트 평균화와 부분 평균화가 포함됩니다. 로봇은 현재 시장 상황을 분석하고 포지션을 최적의 부분으로 분할하며 평균 마감 가격을 계산합니다. 이는 현재 시장 가격에 최대한 가깝게 됩니다. 이 접근 방식은 주문 격자를 유연하게 관리하고 차트를 지속적으
VR Lollipop
Vladimir Pastushak
5 (11)
VR Lollipop 은 현재 시장 추세를 거래하기 위한 고유한 자동 거래 전략입니다. 이 로봇의 독창성은 시장 추세의 방향에 따라 포지션을 점진적으로 늘릴 수 있는 복잡한 알고리즘을 사용한다는 것입니다. 이 경우 손익분기점 기능 덕분에 모든 오픈 포지션이 자동으로 안전 모드로 전환됩니다. 손절매 수준이 손익 분기점 영역으로 이동하면 포지션은 안전한 것으로 간주됩니다. 이러한 복잡한 작업은 MetaTrader 터미널의 강력한 기능을 사용하여 수행됩니다. 세트 파일, 제품의 데모 버전, 지침 및 보너스를 사용할 수 있습니다. [블로그] 버전: [MetaTrader 5] VR Lollipop 작품에 담긴 독특한 기술 로봇의 주요 기능 중 하나는 플로팅 트레일링을 사용하는 것입니다. 고정된 크기를 사용하는 기존 추적과 달리 이 방법은 가격 변동률을 기반으로 합니다. 정지 손실 크기는 포인트가 아닌 백분율로 계산되므로 사소한 시장 조정 중에 포지션이 조기에 마감되는 것을 방지할 수 있습니
VR Lollipop MT5
Vladimir Pastushak
2.71 (7)
VR Lollipop 은 현재 시장 추세를 거래하기 위한 고유한 자동 거래 전략입니다. 이 로봇의 독창성은 시장 추세의 방향에 따라 포지션을 점진적으로 늘릴 수 있는 복잡한 알고리즘을 사용한다는 것입니다. 이 경우 손익분기점 기능 덕분에 모든 오픈 포지션이 자동으로 안전 모드로 전환됩니다. 손절매 수준이 손익 분기점 영역으로 이동하면 포지션은 안전한 것으로 간주됩니다. 이러한 복잡한 작업은 MetaTrader 터미널의 강력한 기능을 사용하여 수행됩니다. 세트 파일, 제품의 데모 버전, 지침 및 보너스를 사용할 수 있습니다. [블로그] 버전: [MetaTrader 4] VR Lollipop 작품에 담긴 독특한 기술 로봇의 주요 기능 중 하나는 플로팅 트레일링을 사용하는 것입니다. 고정된 크기를 사용하는 기존 추적과 달리 이 방법은 가격 변동률을 기반으로 합니다. 정지 손실 크기는 포인트가 아닌 백분율로 계산되므로 사소한 시장 조정 중에 포지션이 조기에 마감되는 것을 방지할 수 있습니
VR Smart Grid
Vladimir Pastushak
4.29 (168)
VR Smart Grid는 MetaTrader 4와 MetaTrader 5를 위해 개발된 완전한 기능의 거래 어드바이저이며, 고전적인 그리드 거래 전략을 기반으로 구축되었습니다. 로봇은 독립적으로 포지션을 개설하고, 관리하고, 일부를 결제하여 시장 변화에 적응하는 효율적인 주문 격자를 만듭니다. 15년간의 개발을 거쳐 이 어드바이저는 수천 번의 변형과 테스트를 거쳤습니다. 이는 실제 계정과 데모 계정의 체계적인 개선 결과입니다. 세트 파일, 제품의 데모 버전, 지침 및 보너스를 사용할 수 있습니다. [블로그] 버전: [MetaTrader 5] 지능형 포지션 평균화 VR Smart Grid의 주요 특징 중 하나는 여러 평균화 모드입니다. 스마트 평균화와 부분 평균화가 포함됩니다. 로봇은 현재 시장 상황을 분석하고 포지션을 최적의 부분으로 분할하며 평균 마감 가격을 계산합니다. 이는 현재 시장 가격에 최대한 가깝게 됩니다. 이 접근 방식은 주문 격자를 유연하게 관리하고 차트를 지속적으
VR Locker MT5
Vladimir Pastushak
3.8 (5)
VR Locker 트레이딩 로봇은 포지티브 락(Positive Locks)을 사용한 트레이딩을 기반으로 하는 자동 트레이딩 전략입니다. VR Locker의 포지티브 락 원리는 반대 방향 포지션을 통해 실현되지 않은 이익으로 "안전 장치"를 만드는 데 기반합니다. 어드바이저는 동일한 볼륨의 초기 시장 주문(Buy 및 Sell)을 열고, 가격 움직임 방향으로 주문 그리드를 "확장"시켜 Sell 주문이 Buy 주문 위에 양수 잔고로 있을 때 락을 형성합니다. 설정 파일(set files), 제품 데모 버전, 지침 및 보너스는 [블로그] 에서 확인하실 수 있습니다. [MetaTrader 5] 용 버전 작동 원리 어드바이저는 동일한 볼륨의 두 시장 주문(Buy 및 Sell)으로 시작한 후 가격 움직임에 따라 주문 그리드로 "확장"합니다. 포지션 사이의 거리가 설정된 수준에 도달하면 새로운 포지티브 락이 형성되어 드로다운을 줄이기 위한 이익을 축적합니다. 전문가 어드바이저는 두 단계로 작동합니
VR Stealth Pro MT 5
Vladimir Pastushak
5 (1)
VR Stealth Pro — 는 거래의 편리성과 효율성을 향상시키기 위해 개발된 전문 무료 거래 패널입니다. 이 도구의 주요 목적은 Stop Loss와 Take Profit 수준을 숨기는 것으로, 이는 거래 수준에 대한 정보 유출 위험을 최소화합니다. 세트 파일, 제품의 데모 버전, 지침 및 보너스를 사용할 수 있습니다. [블로그] 버전: [MetaTrader 4] VR Stealth Pro는 "as is" 원칙으로 제공되는 무료 거래 패널입니다. 더 많은 기능을 사용하려면 VR Trade Panel 거래 패널을 사용하십시요. 이 패널은 트레이더의 눈 앞에 있는 모든 필요한 도구에 빠른 액세스를 제공하는 사용하기 쉬운 인터페이스를 갖고 있습니다. 실제 수준을 숨기기 위해 그래픽 요소(트렌드 라인)로 그것들을 대체하는 가상화 기술이 사용되며, 이로 인해 터미널의 작업 공간에서 직접 관리가 가능합니다. 프로그램은 마우스 한 번 클릭으로 거래를 열고 닫고 변경하는 등 어떤 거래 작업도
FREE
VR Donchian MT5
Vladimir Pastushak
4.82 (17)
VR Donchian 표시기는 Donchian 채널의 향상된 버전입니다. 개선 사항은 채널의 거의 모든 기능에 영향을 주었지만 주요 운영 알고리즘과 채널 구성은 그대로 유지되었습니다. 현재 추세에 따라 볼 표시기에 레벨 색상 변경이 추가되었습니다. 이는 거래자에게 추세 또는 플랫의 변화를 명확하게 보여줍니다. 스마트폰, 이메일 또는 MetaTrader 터미널 자체를 통해 두 채널 수준 중 하나의 돌파에 대해 거래자에게 알리는 기능이 추가되었습니다. 가격표가 추가되어 거래자가 차트에서 가격 수준을 볼 수 있습니다. 고전적인 Donchian 지표의 작동 알고리즘은 트레이더가 지표가 계산할 기간 수를 직접 설정할 수 있다는 사실로 인해 최적화되고 가속화되었습니다. 고전적인 Donchian 지표는 MetaTrader 터미널에서 사용할 수 있는 전체 내역을 계산하며, 이는 MetaTrader 터미널에 수학적 계산을 많이 로드합니다. VR Donchian 지표는 트레이더가 설정에 설정한 금액만
FREE
VR 컬러 레벨은 추세선, 직사각형, 텍스트 등의 요소를 사용하여 기술적 분석을 적용하는 사람들에게 편리한 도구입니다. 차트에 직접 텍스트를 추가하고 스크린샷을 찍는 것이 가능합니다. 설정, 세트 파일, 데모 버전, 지침, 문제 해결 등은 다음에서 얻을 수 있습니다. [블로그] 다음에서 리뷰를 읽거나 작성할 수 있습니다. [링크] 버전 [MetaTrader 4] 표시기 작업은 한 번의 클릭 으로 수행됩니다. 이렇게 하려면 선이 있는 버튼을 클릭하세요. 그러면 커서 아래에 추세선이 나타납니다. 그런 다음 커서를 움직여 선 위치 를 선택하고 다시 클릭하여 수정하면 됩니다. 표시기 의 특징은 스타일과 색상의 모든 변경 사항이 자동으로 저장되고 나중에 새로 생성된 모든 그래픽 개체에 적용된다는 것입니다. 이 지표에는 서로 다른 스타일의 추세선을 설정하기 위한 두 개의 독립 버튼, 서로 다른 스타일의 두 개의 독립 직사각형, 자체 스타일이 있는 하나의 텍스트 필드 및 스크린샷 생성용 버튼
FREE
VR Donchian
Vladimir Pastushak
4.87 (15)
VR Donchian 표시기는 Donchian 채널의 향상된 버전입니다. 개선 사항은 채널의 거의 모든 기능에 영향을 주었지만 주요 운영 알고리즘과 채널 구성은 그대로 유지되었습니다. 현재 추세에 따라 볼 표시기에 레벨 색상 변경이 추가되었습니다. 이는 거래자에게 추세 또는 플랫의 변화를 명확하게 보여줍니다. 스마트폰, 이메일 또는 MetaTrader 터미널 자체를 통해 두 채널 수준 중 하나의 돌파에 대해 거래자에게 알리는 기능이 추가되었습니다. 가격표가 추가되어 거래자가 차트에서 가격 수준을 볼 수 있습니다. 고전적인 Donchian 지표의 작동 알고리즘은 트레이더가 지표가 계산할 기간 수를 직접 설정할 수 있다는 사실로 인해 최적화되고 가속화되었습니다. 고전적인 Donchian 지표는 MetaTrader 터미널에서 사용할 수 있는 전체 내역을 계산하며, 이는 MetaTrader 터미널에 수학적 계산을 많이 로드합니다. VR Donchian 지표는 트레이더가 설정에 설정한 금액만
FREE
VR Ticks MT5
Vladimir Pastushak
4.5 (4)
VR Ticks는   스캘핑 기반 전략에 대한 특별한 지표입니다. 이 지표 덕분에 거래자는 금융상품의 메인 차트에서 직접 틱 차트를 볼 수 있습니다. 틱 차트를 사용하면 가능한 한 정확하게 시장에 포지션을 입력하거나 시장에서 포지션을 청산할 수 있습니다. VR Ticks는 방향에 따라 색상이 변하는 선 형태로 진드기 데이터를 표시합니다. 이를 통해 진드기의 상황을 시각적으로 이해하고 평가할 수 있습니다. 틱 차트의 장점은 기간을 고려하지 않고 가격 변동을 기반으로 작성된다는 것입니다. VR Ticks는 가능한 가장 최소한의 차트를 구축합니다. 설정, 세트 파일, 데모 버전, 지침, 문제 해결 등은   [블로그]   에서 확인할 수 있습니다. [링크]   에서 리뷰를 읽거나 작성할 수 있습니다. [MetaTrader 4]   용 버전 틱은 하나의 가격 변동입니다. 한 번의 가격 변동에 대해 가격은 하나 또는 여러 포인트만큼 변경될 수 있습니다.   진드기가 움직임이라는   것을 이해하
FREE
VR Grid Mt5
Vladimir Pastushak
3.25 (8)
VR 그리드 표시기는 사용자 정의 설정으로 그래픽 그리드를 생성하도록 설계 되었습니다. 표준 그리드 와 달리 VR 그리드는 원형 레벨 을 구축하는 데 사용됩니다. 사용자의 선택에 따라 라운드 수준 사이의 단계는 임의적일 수 있습니다. 또한 VR Grid는 다른 인디케이터나 유틸리티와는 달리 기간이 바뀌거나 단말기를 재부팅해도 그리드의 위치 를 유지합니다. 설정, 세트 파일, 데모 버전, 지침, 문제 해결 등은 다음에서 얻을 수 있습니다. [블로그] 다음에서 리뷰를 읽거나 작성할 수 있습니다. [링크] 버전 [MetaTrader 4] 수직 수준 은 실제 시간 간격을 기준으로 하며 누락 또는 존재하지 않는 기간은 무시 합니다. 따라서 레벨 사이의 단계는 사용자가 선택한 값과 엄격하게 일치합니다. VR 그리드 표시기를 사용할 때 트레이더는 모든 수준에서 스타일 , 수직선 및 수평선의 색상 및 두께를 변경할 수 있습니다. 이를 통해 금융 상품의 라운드 수준 을 제어할 수 있습니다. 라운
FREE
VR Alert MT5
Vladimir Pastushak
3.5 (2)
지표의 형태로 만들어진 VR 경고 유틸리티는 특정 수준에 도달하는 가격이나 지표에 대해 상인에게 알리기 위해 가격 또는 기타 지표를 모니터링하도록 설계되었습니다. 신호 레벨은 수평뿐만 아니라 비스듬하게 설정할 수 있다. 따라서 거래자는 금융 분야에서 최신 도구를 얻을 수 있는 새로운 기회와 기회를 얻는다. 가상현실 알림 유틸리티 덕분에 더 이상 모니터 근처에 오래 앉아 있을 필요가 없다. 당신은 안전하게 당신의 가정 집안일에 대해 갈 수 있습니다, 작업 의무를 수행, 가족과 함께 시간을 보내고. 당신의 임무는 단순히 레벨을 설정하고 정보의 네 가지 방법 중 하나를 선택하는 것이다. 유틸리티는 스마트폰, 이메일로 알림을 보내고 표준 알림 창과 소리를 표시하며 그래프를 빨간색으로 칠할 수 있다. 유틸리티의 모든 제어는 차트의 마우스로 수행된다. 출시 당시 유틸리티는 차트에서 다른 지표에 대해 검사합니다. VR 경고의 감독하에 차트에 표시되는 부분이 있는 지표입니다. 추적할 수 있는 모든
VR Sync Charts MT5
Vladimir Pastushak
5 (3)
VR Sync Charts는 창 간의 레이아웃을 동기화하는 유틸리티입니다. VR Sync Charts를 사용하여 추세 수준, 수평 수준, 피보나치 표시가 모든 차트와 동기화됩니다. 본 유틸리티를 사용하여 MetaTrader 터미널에서 모든 표준 그래픽 개체를 동기화할 수 있으며 모든 추세, Gann 라인 및 기타 개체가 인접 차트에 정확하게 복사됩니다. 더 이상 괘선과 표시를 수동으로 복사할 필요가 없습니다. 아래 그림과 비디오에서 VR Sync Charts 유틸리티의 작업을 보고 평가할 수 있습니다. 권장 사항: 모든 차트에 지표를 설정하기. 터미널 설정에서 «더블 클릭으로 개체 선택» 기능을 설정하기. 본 프로그램을 전략 시험에서 테스트할 수 없습니다. 아래 비디오를 보십시오. 혜택 모든 그래픽 개체를 동기화함. 모든 시간대와 차트 동기화 모든 업데이트는 무료입니다 초보자뿐만 아니라 전문 트레이더 모두에게 적합함 설정이 많지 않아 선택적으로 동기화를 할 수 있음. 모든 금융 상품
Vr Stealth pro
Vladimir Pastushak
4.91 (53)
VR Stealth Pro — 는 거래의 편리성과 효율성을 향상시키기 위해 개발된 전문 무료 거래 패널입니다. 이 도구의 주요 목적은 Stop Loss와 Take Profit 수준을 숨기는 것으로, 이는 거래 수준에 대한 정보 유출 위험을 최소화합니다. 세트 파일, 제품의 데모 버전, 지침 및 보너스를 사용할 수 있습니다. [블로그] 버전: [MetaTrader 5] VR Stealth Pro는 "as is" 원칙으로 제공되는 무료 거래 패널입니다. 더 많은 기능을 사용하려면 VR Trade Panel 거래 패널을 사용하십시요. 이 패널은 트레이더의 눈 앞에 있는 모든 필요한 도구에 빠른 액세스를 제공하는 사용하기 쉬운 인터페이스를 갖고 있습니다. 실제 수준을 숨기기 위해 그래픽 요소(트렌드 라인)로 그것들을 대체하는 가상화 기술이 사용되며, 이로 인해 터미널의 작업 공간에서 직접 관리가 가능합니다. 프로그램은 마우스 한 번 클릭으로 거래를 열고 닫고 변경하는 등 어떤 거래 작업도
FREE
VR Watch list and Linker MT5
Vladimir Pastushak
4.88 (8)
VR 감시 목록 및 링커 - 터미널용 스크리너 애플리케이션 메타트레이더 . 가장 흥미롭고 기술적인 금융 상품을 더 쉽게 찾을 수 있습니다. 이 스크리너는 bybit, Moscow Exchange, American Exchange, 외환 및 암호화폐 시장, 금속 시장 등의 거래소에서 트레이더가 거래하는 데 사용되며 소품 회사에서 거래하는 데 사용됩니다. 금융상품의 선택은 수동으로 수행됩니다. 스크리너는 MetaTrader 터미널의 오픈 차트를 연결하고, 금융상품 변경 시 각 차트의 데이터를 별도로 표시합니다. 설정, 파일 설정, 데모 버전, 지침, 문제 해결 등은 다음에서 얻을 수 있습니다. [블로그] 다음에서 리뷰를 읽거나 작성할 수 있습니다. [링크] 버전: [메타트레이더4] 스크리너를 사용하면 거래자가 가장 기술적인 금융 상품을 찾고 유동성이 낮고 위험이 높은 상품에 대한 거래를 제외하는 데 도움이 됩니다. 스크리너를 사용하면 티커가 포함된 시트를 쉽고 빠르게 생성 및 변경하
VR Alert
Vladimir Pastushak
5 (1)
VR Alert是一种实用工具,设计用于指示交易者价格达到给定水平。신호 레벨은 수평뿐만 아니라 비스듬하게 설정할 수 있다. 따라서 거래자는 금융 분야에서 최신 도구를 얻을 수 있는 새로운 기회와 기회를 얻는다. 가상현실 알림 유틸리티 덕분에 더 이상 모니터 근처에 오래 앉아 있을 필요가 없다. 당신은 안전하게 당신의 가정 집안일에 대해 갈 수 있습니다, 작업 의무를 수행, 가족과 함께 시간을 보내고. 당신의 임무는 단순히 레벨을 설정하고 정보의 네 가지 방법 중 하나를 선택하는 것이다. 유틸리티는 스마트폰, 이메일로 알림을 보내고 표준 알림 창과 소리를 표시하며 그래프를 빨간색으로 칠할 수 있다. 유틸리티의 모든 제어는 차트의 마우스로 수행된다. 권장 사항: 단말기를 구성하여 스마트폰으로 푸시 메시지를 보낼 수 있도록 구성하고 블로그의 지침입니다. 단말이 전자 메일 메시지를 전자 메일로 보내도록 구성하고 블로그의 지침입니다. 그냥 네비게이터에서 차트로 표시기를 드래그합니다. 표시기의 이름
VR Calculate Martingale 지표는 위험 없이 모든 거래 전략을 사전 계산하기 위한 강력한 도구입니다. 지표가 가상 주문을 사용한다는 사실로 인해 거래자는 거래 계좌의 이벤트 진행 상황을 미리 계산할 수 있습니다. 더 이상 EXCEL 테이블과 계산기가 필요하지 않으며, 다양한 거래 로트의 다방향 포지션 평균을 구하는 공식을 알 필요도 없습니다. VR Calculate Martingale은 모든 것을 계산하는 데 도움이 됩니다. 설정, 세트 파일, 데모 버전, 지침, 문제 해결 등은 다음에서 얻을 수 있습니다. [블로그] 다음에서 리뷰를 읽거나 작성할 수 있습니다. [링크] 버전 [MetaTrader 4] 이 지표는 포지션 네트워크의 거래를 계산할 목적으로 2015년에 개발되었으며 현재 전 세계적으로 주요 업데이트를 받았습니다. 많은 리뷰와 제안 덕분에 지표가 개선되고 업데이트되었습니다. VR Calculate Martingale 계산기의 주요 기능 가상 주문 생성,
VR Color Levels MT4
Vladimir Pastushak
5 (1)
VR 컬러 레벨은 추세선, 직사각형, 텍스트 등의 요소를 사용하여 기술적 분석을 적용하는 사람들에게 편리한 도구입니다. 차트에 직접 텍스트를 추가하고 스크린샷을 찍는 것이 가능합니다. 설정, 세트 파일, 데모 버전, 지침, 문제 해결 등은 다음에서 얻을 수 있습니다. [블로그] 다음에서 리뷰를 읽거나 작성할 수 있습니다. [링크] 버전 [MetaTrader 5] 표시기 작업은 한 번의 클릭 으로 수행됩니다. 이렇게 하려면 선이 있는 버튼을 클릭하세요. 그러면 커서 아래에 추세선이 나타납니다. 그런 다음 커서를 움직여 선 위치 를 선택하고 다시 클릭하여 수정하면 됩니다. 표시기 의 특징은 스타일과 색상의 모든 변경 사항이 자동으로 저장되고 나중에 새로 생성된 모든 그래픽 개체에 적용된다는 것입니다. 이 지표에는 서로 다른 스타일의 추세선을 설정하기 위한 두 개의 독립 버튼, 서로 다른 스타일의 두 개의 독립 직사각형, 자체 스타일이 있는 하나의 텍스트 필드 및 스크린샷 생성용 버튼
FREE
VR Grid
Vladimir Pastushak
5 (3)
VR 그리드 표시기는 사용자 정의 설정으로 그래픽 그리드를 생성하도록 설계 되었습니다. 표준 그리드 와 달리 VR 그리드는 원형 레벨 을 구축하는 데 사용됩니다. 사용자의 선택에 따라 라운드 수준 사이의 단계는 임의적일 수 있습니다. 또한 VR Grid는 다른 인디케이터나 유틸리티와는 달리 기간이 바뀌거나 단말기를 재부팅해도 그리드의 위치 를 유지합니다. 설정, 세트 파일, 데모 버전, 지침, 문제 해결 등은 다음에서 얻을 수 있습니다. [블로그] 다음에서 리뷰를 읽거나 작성할 수 있습니다. [링크] 버전 [MetaTrader 5] 수직 수준 은 실제 시간 간격을 기준으로 하며 누락 또는 존재하지 않는 기간은 무시 합니다. 따라서 레벨 사이의 단계는 사용자가 선택한 값과 엄격하게 일치합니다. VR 그리드 표시기를 사용할 때 트레이더는 모든 수준에서 스타일 , 수직선 및 수평선의 색상 및 두께를 변경할 수 있습니다. 이를 통해 금융 상품의 라운드 수준 을 제어할 수 있습니다. 라운
FREE
VR Ticks
Vladimir Pastushak
VR Ticks는 스캘핑 기반 전략에 대한 특별한 지표입니다. 이 지표 덕분에 거래자는 금융상품의 메인 차트에서 직접 틱 차트를 볼 수 있습니다. 틱 차트를 사용하면 가능한 한 정확하게 시장에 포지션을 입력하거나 시장에서 포지션을 청산할 수 있습니다. VR Ticks는 방향에 따라 색상이 변하는 선 형태로 진드기 데이터를 표시합니다. 이를 통해 진드기의 상황을 시각적으로 이해하고 평가할 수 있습니다. 틱 차트의 장점은 기간을 고려하지 않고 가격 변동을 기반으로 작성된다는 것입니다. VR Ticks는 가능한 가장 최소한의 차트를 구축합니다. 설정, 세트 파일, 데모 버전, 지침, 문제 해결 등은 [블로그] 에서 확인할 수 있습니다. [링크] 에서 리뷰를 읽거나 작성할 수 있습니다. [MetaTrader 5] 용 버전 틱은 하나의 가격 변동입니다. 한 번의 가격 변동에 대해 가격은 하나 또는 여러 포인트만큼 변경될 수 있습니다. 진드기가 움직임이라는 것을 이해하는 것이 중요합니다. 표시
FREE
VR Orders History MT5
Vladimir Pastushak
3 (2)
The VR Orders History script is designed to upload a trade report to a csv file. This format is intended for additional analysis of trading history in programs such as EXCEL, Openoffice, and Libreoffice. Thanks to the script, it is now much easier for a trader to analyze their trading history. The program facilitates the analysis of the trading history for the MetaTrader 5 terminal. The trader sees structured trading. The entire report is based on the following principle: Position > Order on the
FREE
VR Object Delete All MT5
Vladimir Pastushak
5 (1)
The VR Object Delete All script solves the problem of garbage on the chart. it is often necessary to completely clear the chart of everything that is put on it, comments, lines, objects. The script completely deletes everything, even those objects that are not visible. When working, VR Object Delete All writes everything it does in the terminal log, as well as the names of objects to delete. Displays the number of deleted objects as a separate line. in case of any errors, it will display an erro
FREE
VR Orders History
Vladimir Pastushak
5 (4)
The VR Orders History script is designed to upload a trade report to a csv file. This format is intended for additional analysis of trading history in programs such as EXCEL, Openoffice, and Libreoffice. Thanks to the script, it is now much easier for a trader to analyze their trading history. The program facilitates the analysis of the trading history for the MetaTrader 5 terminal. The trader sees structured trading. The entire report is based on the following principle: Position > Order on the
FREE
VR Close Orders MT5
Vladimir Pastushak
1 (1)
The VR Close orders script is designed to close positions in the terminal at a profit or loss mark set by the trader. The program is written as a script and can work together on the same chart with any other indicators and expert advisors. The program has a simple visual panel and is easy to configure with the mouse. With this program's help, the trader can automatically close positions and delete orders depending on the conditions set.  There is often a situation when you need to close position
FREE
VR Close Orders
Vladimir Pastushak
3.5 (4)
The VR Close orders script is designed to close positions in the terminal at a profit or loss mark set by the trader. The program is written as a script and can work together on the same chart with any other indicators and expert advisors. The program has a simple visual panel and is easy to configure with the mouse. With this program's help, the trader can automatically close positions and delete orders depending on the conditions set.  There is often a situation when you need to close position
FREE
VR Object Delete All
Vladimir Pastushak
5 (1)
The VR Object Delete All script solves the problem of garbage on the chart. it is often necessary to completely clear the chart of everything that is put on it, comments, lines, objects. The script completely deletes everything, even those objects that are not visible. When working, VR Object Delete All writes everything it does in the terminal log, as well as the names of objects to delete. Displays the number of deleted objects as a separate line. in case of any errors, it will display an erro
FREE
VR ATR Pro
Vladimir Pastushak
4.33 (6)
VR ATR Pro 는 이전 거래 기간의 통계적 분석 을 기반으로 목표 수준을 결정하기 위한 기술 지표입니다. 이는 선택한 기간 동안의 평균 가격 변동 을 수학적으로 계산하는 데 기반합니다. 통계에 기반한 지표 작동 원리 이 지표의 작동은 가격의 일일 움직임 관찰에 기반합니다: 각 거래 기간은 특정 변동폭 을 특징으로 합니다 — 가격은 시가를 기준으로 위아래로 일정 포인트 거리를 이동합니다. 마찬가지로, 각 새로운 거래 기간이 시작될 때 가격이 조건부 "주행 거리" 를 가지고 있다고 가정할 수 있습니다... 간단한 수학적 계산을 통해 평균값 이 결정됩니다... 이 평균값은 보장된 것은 아니지만, 현재 기간에서 가능한 움직임 크기를 나타내는 기준 역할을 합니다. 따라서 이 지표는 다음과 같은 원리를 적용합니다: 선택한 기간 동안의 역사적 가격 변동 을 분석하고, 통계적 평균값 을 계산하여 차트에 수준을 표시합니다. 이를 통해 트레이더는 현재 금융 상품의 강도 와 "주행 거리" 를 이해
Vr Trade Panel
Vladimir Pastushak
4.71 (17)
VR Trade Panel은 거래의 편의성을 높이고 위험을 줄이기 위해 개발된 전문 트레이딩 패널입니다. 인터페이스의 단순함과 상세한 가이드 덕분에 초보자도 거래의 기초를 배우고 실습을 시작하기가 더 쉬워집니다. 패널의 주요 원칙: 편안함, 속도, 기능성. 지침: 설치 방법 , 사용 방법, 데모 버전 . 프로그램 인터페이스는 직관적이고 간단하여 두 번의 클릭으로 시장 포지션을 열거나 모든 유형의 지정가 주문을 설정할 수 있습니다. 포지션 및 주문 관리가 새로운 수준으로 향상되어, 수평 손절 및 익절 레벨을 이동할 수 있을 뿐만 아니라 경사 레벨을 만들 수도 있습니다. 이 솔루션 덕분에 손절, 익절 레벨 및 지정가 주문 가격이 귀하가 지정한 방향으로 이동하거나 설정된 조건에서 자동으로 비활성화될 수 있습니다. 트레이딩 패널은 트레이더가 사전에 모든 것을 설정하고 빠르고 편안하게 거래할 수 있도록 설계되었습니다. 이를 위해 트레이딩 패널은 다음과 같은 고급 솔루션을 사용합니다: 5개의
VR MultiPrice Analysis - 통화쌍에서 통화의 강도를 결정하는 지표. EUR/USD 쌍을 예로 들어보자. 어떤 통화가 현재 약하고 어떤 통화가 강한지 어떻게 판단하는가? 가장 쉽고 신뢰할 수 있는 방법은 EUR를 USD를 제외한 다른 통화와 비교하는 것입니다. 전력 분배 옵션: EUR은 다른 통화에 대해 상승하고 있습니다. 이는 통화가 거래자와 투자자에게 더 매력적이 되거나 좋은 소식이 나왔다는 신호입니다. EUR은 다른 통화에 대해 하락합니다. 이것은 대부분의 거래자와 투자자가 EUR를 없애고 다른 통화를 구매하거나 나쁜 소식이 나왔다는 신호입니다. 이 표시기는 통화마다 다른 가치를 보여준다 - 이것은 유로화시장의 불확실성의 신호 유럽연합화폐(유로화)에 대해 이야기하자면, 이 지표는 미국 달러화를 다른 화폐들과 연결하여 분석합니다. 그 결과 VR MultiPrice Analysis을 사용하면 트레이더는 EUR/USD 통화 쌍의 합성 분석을 받아 전체 통화 쌍의 전체
VR Watch list and Linker
Vladimir Pastushak
4.57 (7)
VR 감시 목록 및 링커 - 터미널용 스크리너 애플리케이션 메타트레이더 . 가장 흥미롭고 기술적인 금융 상품을 더 쉽게 찾을 수 있습니다. 이 스크리너는 bybit, Moscow Exchange, American Exchange, 외환 및 암호화폐 시장, 금속 시장 등의 거래소에서 트레이더가 거래하는 데 사용되며 소품 회사에서 거래하는 데 사용됩니다. 금융상품의 선택은 수동으로 수행됩니다. 스크리너는 MetaTrader 터미널의 오픈 차트를 연결하고, 금융상품 변경 시 각 차트의 데이터를 별도로 표시합니다. 설정, 파일 설정, 데모 버전, 지침, 문제 해결 등은 다음에서 얻을 수 있습니다. [블로그] 다음에서 리뷰를 읽거나 작성할 수 있습니다. [링크] 버전: [메타트레이더5] 스크리너를 사용하면 거래자가 가장 기술적인 금융 상품을 찾고 유동성이 낮고 위험이 높은 상품에 대한 거래를 제외하는 데 도움이 됩니다. 스크리너를 사용하면 티커가 포함된 시트를 쉽고 빠르게 생성 및 변경하
필터:
GoodMorningg
535
GoodMorningg 2023.04.08 20:40 
 

사용자가 평가에 대한 코멘트를 남기지 않았습니다

Quantum Trader
3015
Quantum Trader 2021.06.01 17:19 
 

사용자가 평가에 대한 코멘트를 남기지 않았습니다

Vladimir Pastushak
111955
개발자의 답변 Vladimir Pastushak 2021.06.01 17:41
Thank!
fcg554
24
fcg554 2021.05.03 20:40 
 

사용자가 평가에 대한 코멘트를 남기지 않았습니다

Vladimir Pastushak
111955
개발자의 답변 Vladimir Pastushak 2021.06.01 17:42
Thank!
Postoylec
14
Postoylec 2021.04.16 23:50 
 

사용자가 평가에 대한 코멘트를 남기지 않았습니다

Vladimir Pastushak
111955
개발자의 답변 Vladimir Pastushak 2021.06.01 17:42
Спасибо!
varon
531
varon 2021.03.24 20:21 
 

사용자가 평가에 대한 코멘트를 남기지 않았습니다

Vladimir Pastushak
111955
개발자의 답변 Vladimir Pastushak 2021.03.24 20:42
Thank!
AskarSar
14
AskarSar 2021.03.24 14:01 
 

사용자가 평가에 대한 코멘트를 남기지 않았습니다

Vladimir Pastushak
111955
개발자의 답변 Vladimir Pastushak 2021.03.24 20:42
Спасибо!
리뷰 답변