Omega Support Resistance MT5
- 지표
-
James Erasmus
 트레이더 겸 개발자
MT5에 집중하며, 천문학적 금융, 브로커 비교 및 기술적 전략에 대한 폭넓은 연구를 진행하고 있습니다.
천문 추세 편향, 거래 관리 및 브로커 분석에 대해 더 자세히 알아보시려면 연락 주세요.
최신 EA인 Newton을 확인해 보세요. 평점은 6/10이며, 위험 및 안전성은 9/10입니다. 테스트 및 리뷰를 남겨주시면 감사하겠습니다.
관심이 많으시면 더욱 개선된 EA를 출시할 수도 있습니다. 감사합니다. Jaypipin - 버전: 1.6
- 활성화: 7
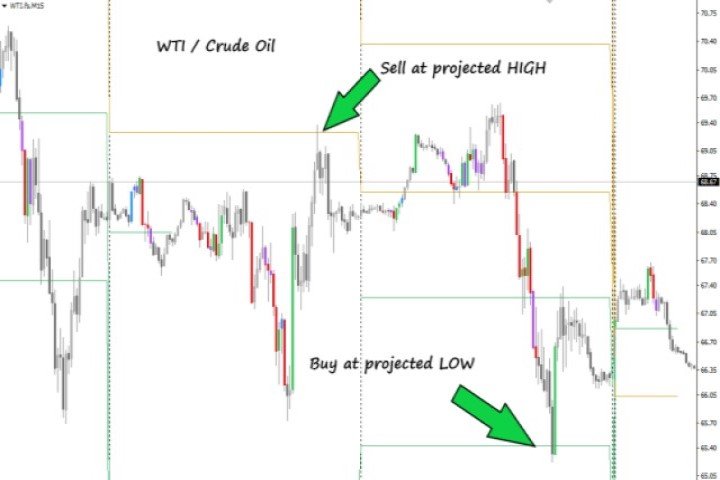
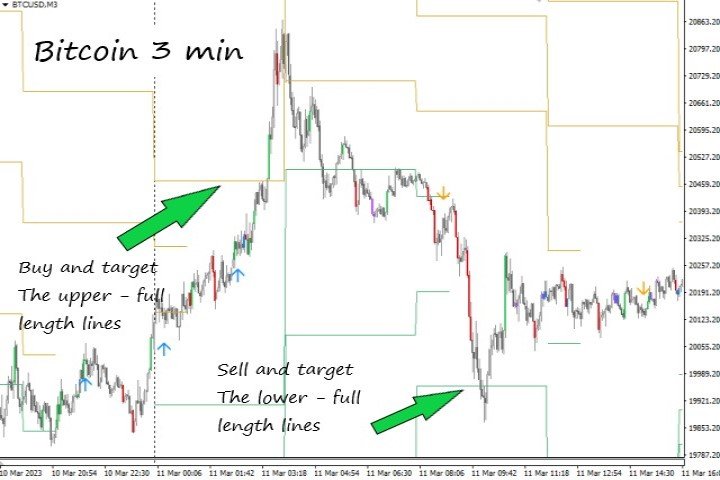
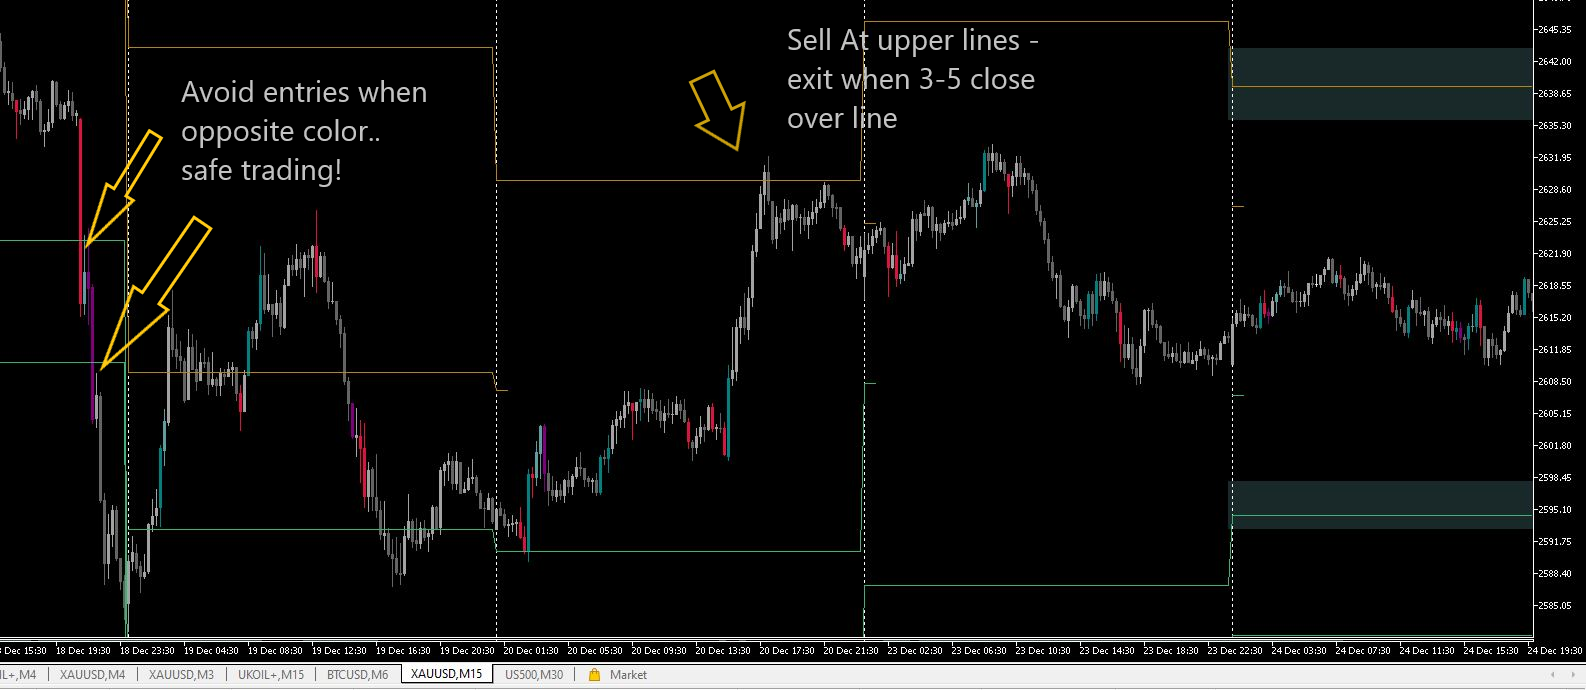
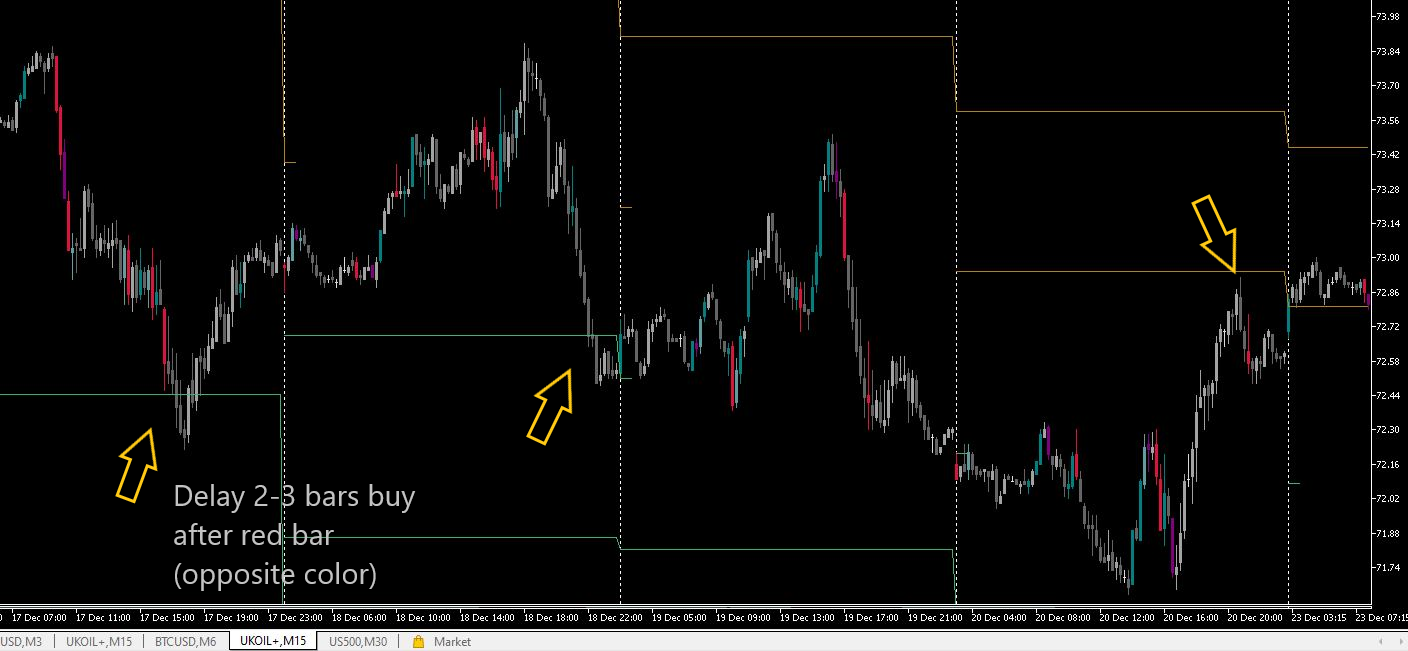
오메가 지지 및 저항 저가 매수, 고가 매도 전략에 대한 고유한 지표 반전 유형 항목은 가격이 전체 길이 선까지 상승함에 따라 가격이 회전/스윙/반전할 것으로 예상합니다. 주간 설정의 경우 4시간으로 1~5분 차트를 거래할 수 있고, 장기 설정의 경우 일일로 m15 이상, 주간으로 1시간 차트를 거래할 수 있습니다. 주간, 일일, 4시간, 심지어 1시간 차트에 대한 모든 제품의 고가 또는 저가에 대한 고정밀 미래 가격 예측기 특정 수준의 진입을 피하려면 SonicR 컬러 바 표시기 또는 이와 유사한 것을 사용하는 것이 가장 좋습니다. 비디오를 시청하여 방법과 이유를 알아보세요. MT4 버전은 무료이므로 지원이 제공되지 않습니다. MT5 고객만 지원을 받을 수 있습니다. 영상과 자세한 내용은 곧 공개됩니다! 특징 고유한 지지 및 저항 가격 수준 기록의 일수 제한 선, 색상 변경을 위한 입력 용법 이 지표는 거래에만 사용하거나 다른 전략과 결합하여 사용할 수 있습니다. 예상 목표 및 전환점, 고유한 지지 및 저항에 대한 높고 낮은 가격 수준 제공 - 예시는 내 동영상을 참조하세요. 이 지표는 대부분의 자산 그룹, 외환, 상품, 지수 등에 사용할 수 있습니다. 모든 시간대, 다시 칠하지 않음, 빠른 로딩 MT5 시뮬레이터로 테스트할 때 ATR 입력을 500 미만으로 변경하십시오. 컬러 바 표시기는 SonicR PVA 캔들입니다. 곧 제품 목록에 추가해 보겠습니다. 지금은 온라인에서 찾아보세요. 거래 및 테스트에 중요 *** 입력 기간 선택: m10, m15, m30 차트 거래 시 매일 입력 기간 선택: 최소 1-5 거래 시 4시간 입력 기간 선택: 최소 1-5 거래 시 1시간 차트를 설정할 때 시간 프레임을 변경하면 데이터 로드에 도움이 되는 경우가 있으므로 5분으로 변경한 다음 원하는 시간 프레임으로 다시 변경하세요. 차트에 모든 수준이 표시될 때까지 몇 가지 다른 시간 프레임이 필요할 수도 있습니다.