MetaTrader 4용 유료 기술 지표 - 8
이것은 바이너리 옵션 거래를 위한 신호 지표입니다. 신호는 현재 촛불이 열릴 때 발생하며 닫힐 때까지 유효합니다. 신호는 차트에서 바로 화살표와 신호 메시지를 동반합니다. 권장 옵션 만기 시간은 캔들 1개입니다. 즉, 차트가 H1이면 만료 시간은 1시간이 됩니다. 차트가 M5인 경우 옵션 만료 시간은 5분이 됩니다. 그러나 실제로 원하는 대로 신호를 자유롭게 사용할 수 있으며 원하는 경우 자신의 거래 규칙을 자유롭게 따를 수 있습니다. 필터 역할을 하는 다른 지표와 함께 이 지표를 사용하는 것이 좋습니다. 나는 모든 구매자에게 두 번째 지표를 절대적으로 무료로 제공합니다. 또한 지표를 사용하여 최상의 결과를 얻는 방법에 대한 권장 사항을 공유할 것입니다. 이 시스템은 바이너리 옵션 거래자와 외환 거래자 모두에게 적합합니다. 구매 후 메일 주세요! 추가 지표를 무료로 보내드립니다! 또한 이 시스템과의 거래에 대한 권장 사항을 공유할 것입니다.

외환 거래를 한다면, 통화 강도와 통화쌍 상관관계에 대한 상세한 정보를 아는 것은 거래 실력을 한 단계 끌어올리는 데 큰 도움이 됩니다. 상관관계를 분석하면 리스크를 절반으로 줄일 수 있고, 강도 분석을 통해 수익을 극대화할 수 있습니다. 이 지표는 통화 강도 분석과 통화쌍 상관관계를 결합하여 가장 적합한 통화쌍을 선택할 수 있도록 도와주는 하이브리드 접근 방식을 제공합니다.
통화 강도 분석 활용 방법
예를 들어, 당신의 거래 전략이 AUD/JPY 매수 기회를 제공한다고 가정해 봅시다. 하지만 KT 통화 강도 분석을 통해 JPY가 AUD보다 강해지고 있다는 것을 발견했다면, 이 거래는 손실로 끝날 가능성이 높습니다. 이 지표를 사용하면 이러한 손실을 쉽게 피할 수 있습니다.
통화쌍 상관관계 활용 방법 또 다른 예로, 거래 전략이 NZD/USD와 GBP/JPY 두 통화쌍 모두에 대해 매도 기회를 제공한다고 가정해 봅시다. KT 통화쌍 상관관계 분석을 사용하면 이 두 통화쌍 간 상관

OVERVIEW
A Lorentzian Distance Classifier (LDC) is a Machine Learning classification algorithm capable of categorizing historical data from a multi-dimensional feature space. This indicator demonstrates how Lorentzian Classification can also be used to predict the direction of future price movements when used as the distance metric for a novel implementation of an Approximate Nearest Neighbors (ANN) algorithm. This indicator provide signal as buffer, so very easy for create EA from this indi

The Scalper Boss indicator is a cutting-edge analytical tool designed to assess market conditions and identify optimal entry and exit points using a multi-layered logic framework. It adapts to changing market environments, providing traders with clear visual signals and trend lines. Its primary value lies in its ability to enhance market analysis by filtering noise and capturing meaningful movements, making it especially beneficial for scalping and intraday trading. While Scalper Boss does not g

Special offer! https://www.mql5.com/ru/users/bossik2810 Bomb Signal is a powerful indicator for MetaTrader 4 designed to identify the most relevant trends in the financial market. If you are looking for a tool that accurately predicts movements, Bomb Signal is your ally. How does this work: This indicator combines three different methods – volume analysis, candlestick closing and symmetrical trend – to detect and signal buying and selling opportunities. Bomb Signal is like a “bomb” when it dete
Ultimate Volatility Insight is a highly professional tool for analyzing and fully understanding market activity based on an advanced ATR with improved algorithms and calculation formulas. The indicator helps traders accurately assess market dynamics, identify key support and resistance levels, and effectively manage risks. Ultimate Volatility Insight works only with real data using live statistics. The indicator has been developed for over two years, and its effectiveness has been proven through

Currency Strength Meter is the easiest way to identify strong and weak currencies. This indicator shows the relative strength of 8 major currencies + Gold: AUD, CAD, CHF, EUR, GBP, JPY, NZD, USD, XAU. Gold symbol can be changed to other symbols like XAG, XAU etc.
By default the strength value is normalised to the range from 0 to 100 for RSI algorithm: The value above 60 means strong currency; The value below 40 means weak currency;
This indicator needs the data of all 28 major currency pairs

현재 26% 할인!!
이 지표는 두 주요 지표( Advanced Currency Strength 28 & Advanced Currency IMPULSE with ALERT )의 슈퍼 조합입니다. TICK-UNITS에 대한 통화 강도 값과 28개 Forex 쌍에 대한 경고 신호를 보여줍니다. 11개의 다른 틱 단위를 사용할 수 있습니다. 1, 2, 3, 4, 5, 6, 10, 12, 15, 20, 30초입니다. 두 번째 타이머 내에 최소 1틱이 있으면 하위 창의 Tick-Unit 막대가 표시되고 왼쪽으로 이동합니다.
단 하나의 차트로 28 Forex 페어를 스캘핑할 수 있습니다! 스캘핑 기회의 정확한 트리거 포인트를 정확히 찾아낼 수 있기 때문에 스캘핑이 어떻게 개선될지 상상해 보십시오.
그것은 1분보다 낮은 기간에 작동하는 시장의 첫 번째 통화 강도 지표입니다! 그것은 시장에 빠르게 들어오고 나가고 시장에서 작은 핍을 잘라내기를 원하는 빠른 스캘퍼를 위한 것입니다.
사

CS ATR FIBO CHANNELS MULTI TIMEFRAME
Additional tool to trade with Cycle Sniper Indicator.
Cycle Sniper : https://www.mql5.com/en/market/product/51950 Indicator Draws Channels based on: - Cycle Sniper Price and Moving Averages - ATR Deviations - Fibonacci Retracement and Extensions
Features: - Multi TimeFrame - Full alert and Notification options. - Simple Settings - Finds the trend change or extreme reversals.
Inputs: - Arrow Mode: ATR Levels or Median Line If Median Line is selected ind

This indicator shows the gaps on the current chart with a rectangle shape and indicates when the gap is filled by closing the shape. Gaps are considered over the shadows. Allows sending alerts by e-mail or push notifications when a gap is found.
Parameters SizeGAP - Size of the gap that you want to indicate; HGcolor1 - Color of the gap in an upward movement; HGcolor2 - Color of the gap in a downward movement; HGstyle - The style of rectangle to be drawn; StartCalculationFromBar - How many candl
An indicator to draw a graph of account current and historical state such as Balance, Equity, Margin, Free Margin, Margin Level, Drawdown, Account Profit, Deposit and Withdrawals.
Indicator Inputs : Draw Balance Graph Draw Equity Graph Draw Margin Graph Draw Free Margin Graph Draw Margin Level Graph Draw Drawdown Graph Draw Account Profit Graph Connect Gaps by Lines Sign of DDs on Profit Sign of DDs on Loss
Tips : The Indicator will draw historical balance graphs and deposit/withdraw arrows b

About:
Get Free Scanner and example Strategies
And understand detailed description here: https://www.mql5.com/en/blogs/post/759237
And also get example wrappers from above post. You can make your own wrappers if your indicators have complex conditions or for In-Built MT4 indicators.
Features:
- Specify your own Custom Indicator - Specify Buffer values and create Variables - Use those Variables to create your own Buy/Sell Conditions - Get Arrows Up/Down Signals - See Arrows Signals in Scanners
The ORB The Opening Range Breakout or the OPR 'Open Price Range' MT5 Indicator is a powerful tool designed to enhance your trading experience by automatically tracking market openings range , custom ranges, sessions, and Asian ranges. This dynamic indicator is perfect for price action traders, offering unparalleled precision and accuracy without any manual effort. Key Features: London ORB The Opening Range Breakout : Automatically displays the London open price range. New York ORB The Ope
i pyosigineun EMAleul giban-eulo han idong pyeong-gyun mich magdae saegsang-eulo maesu mich maedo hwasalpyoleul jegonghabnida.
idongpyeong-gyunseon wieneun maesu hwasalpyoman pyosidoego idongpyeong-gyunseon alaeeneun maedo hwasalpyoman pyosidoebnida.
hwasalpyoneun banjeon algolijeum-eul giban-eulo hameulo pulbaeg jijeom-eul chaj-eulyeogo habnida.
wonhaneun daelo allim-eul hwalseonghwahal su issseubnida.
seontaeghan gigan-ina dogue jeoghab
gumaehagi jeon-e demo-eseo teseuteuhae b
이 지표는 여러 통화쌍과 시간대를 동시에 모니터링할 수 있는 효율적인 방법을 제공합니다. 가격과 MACD 간 다이버전스를 명확하고 읽기 쉬운 표 형태로 시각화하여, 트레이더들이 차트를 계속 전환할 필요 없이 잠재적인 시장 전환점을 파악할 수 있습니다. 다이버전스는 상승(강세) 또는 하락(약세) 추세 전환 신호로 작용할 수 있습니다. 예를 들어, 가격이 새 고점을 기록했지만 MACD가 이를 더 높은 고점으로 확인하지 못한다면 이는 약세 다이버전스입니다. 반대로, 가격이 더 낮은 저점을 형성하는 동안 MACD가 더 높은 저점을 형성한다면 이는 강세 다이버전스입니다. 지표의 표에서 각 종목(예: EURUSD, GBPUSD)은 왼쪽에 세로로 나열되고, 선택한 시간대(M5, H1, D1 등)는 상단에 가로로 배치됩니다. 단순한 점은 다이버전스가 감지되지 않았음을 의미하며, “UP” 또는 “DN”(하락) 표시가 나타나면 잠재적 거래 신호를 강조합니다. 녹색 “UP”은 매수 기회를, 빨간색 “D

RSI Divergence Full +10 other divergence indicators
Contact me after payment to send you the User-Manual PDF File. Download the MT5 version here. Also you can download the >>> Hybrid Trading EA <<< that is designed and implemented based on RSI Divergence Indicator. RSI is a pretty useful indicator in itself but it's even more effective when you trade divergence patterns with that. Because the divergence signal of the RSI indicator is one of the most powerful signals among the indicators. Di
Enjoy a 50% OFF Christmas holiday sale!
This indicator is unstoppable when combined with our other indicator called Katana. After purchase, send us a message and you could get Katana for FREE as a BONUS After purchase, send us a private message for your instructions. The Trend Forecasting indicator is a very unique & easy tool that is able to make prediction about future price movement based on the signals generated by MACD . It helps you have an estimation on the areas that the price ma
Special offer : ALL TOOLS , just $35 each! New tools will be $30 for the first week or the first 3 purchases ! Trading Tools Channel on MQL5 : Join my MQL5 channel to update the latest news from me 최근 변동성이 큰 금융 트레이딩 환경에서 지지선과 저항선을 정확하게 파악하는 것은 트레이더가 올바른 의사결정을 내리는 데 매우 중요합니다. Predictive Ranges Scanner Multi-TF 는 여러 통화쌍과 시간 프레임에 걸쳐 미래의 매매 구간을 스캔 및 예측하도록 설계된 고급 도구로, 효과적이고 정밀한 시장 추세 파악을 지원합니다. See more MT5 version at: Predictive Ranges MT5 Scanner Multi TF See more products at: All

The Missing Edge You Need To Catch Breakouts Like A Pro. Follow a step-by-step system that detects the most powerful breakouts!
Discover market patterns that generate massive rewards based on a proven and tested strategy.
Unlock Your Serious Edge
Important information here www.mql5.com/en/blogs/post/723208
The Reliable Expert Advisor Version
Automate Breakout EDGE signals using "EA Breakout EDGE" Click Here Have access to the game changing strategy that will take your trading to the next l
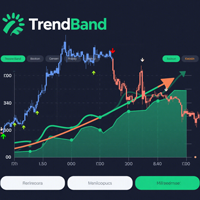
TrendBand Navigator Pro – Non-Repainting Multi-Timeframe Trading System
Powered by proprietary multi-dimensional trend band algorithm delivering clear arrow signals Big Arrows Define Direction Small Arrows Capture Entries Core Advantages
Intelligent Noise Filtering
Volatility-adaptive technology avoids false breakouts, triggers arrows only during strong trends Multi-Timeframe Compatibility
Automatically adapts from 1-minute to monthly charts for all trading strategies Vis
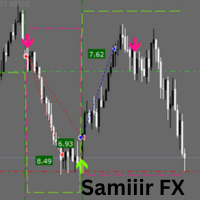
Samiiir FX: Your Ultimate MT4 Trading Companion for Precision and Profit Elevate your trading game with Samiiir FX , a premium MT4 indicator designed to deliver clear, actionable buy and sell signals across forex, commodities, and indices. Built for traders who demand precision and reliability, Samiiir FX combines advanced market analysis with intuitive visuals and robust risk management tools. Whether you're a scalper hunting quick profits, a day trader seeking consistency, or a swing trader a

Important!! ZO Trend can't work on MN timeframe. /*--------------------------------------------------------------------------------------------------------------------------------------------------------------------------------------------- ZO Trend an indicator used to search for entry point. With the session candle algorithm on many timeframe, ZO Trend creates an area for traders find good Entry Point. ZO SYSTEM BASIC SETUP : https://www.youtube.com/watch?v=qdNOXHWozNw ZO TREND User guide :
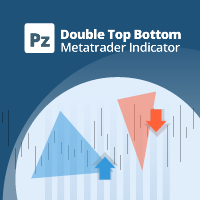
Trade double tops and bottoms effectively
The PZ Double Top/Bottom Indicator is a technical analysis tool that helps traders identify potential price reversal patterns in the market. These patterns, known as double tops and bottoms, are characterized by two consecutive peaks or valleys in the price of an asset. Double tops and bottoms are often seen as potential reversal patterns because they can signal a change in the direction of the current trend. [ Installation Guide | Update Guide | Troubl
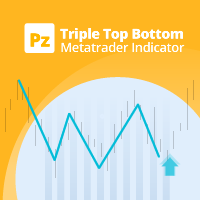
Leverage triple top and bottom patterns for better market timing
The triple top and bottom pattern is a type of chart pattern used in to predict the reversal of trend. The pattern occurs when the price creates three peaks at nearly the same price level. The bounce off the resistance near the third peak is a clear indication that buying interest is becoming exhausted, which indicates that a reversal is about to occur. [ Installation Guide | Update Guide | Troubleshooting | FAQ | All Products ]
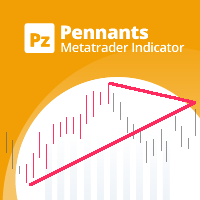
Unlock market continuations with the accurate pennants indicator
The PZ Pennants Indicator is a technical analysis tool that helps traders identify potential continuation patterns in the market. These patterns, known as pennants, are formed when the price of an asset consolidates within a narrowing range, bounded by converging trendlines. Pennants are considered to be continuation patterns because they often precede a breakout in the direction of the preceding trend. When a pennant pattern is id

Stay ahead of the market: predict buying and selling pressure with ease
This indicator analyzes past price action to anticipate buying and selling pressure in the market: it does so by looking back into the past and analyzing price peaks and valleys around the current price. It is a state-of-the-art confirmation indicator. [ Installation Guide | Update Guide | Troubleshooting | FAQ | All Products ] Predict buying and selling pressure in the market Avoid getting caught in buying selling frenzies
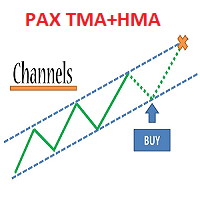
Trade system "PAX Multi TMA/HMA 8"
it is a ready-made trading system for trading on any instrument and any timeframe.
Completely ready for manual trading and use in robots.
Not redrawn.
It is convenient to work on timeframes M30, H1, H4.
Tested on metals, currency pairs, oil, international stocks, Russian stocks, cryptocurrencies, monetary and cryptocurrency indices.
What the trading system consists of:
1. The main channel of price movement named Medina. May be of 3 colors: red - downtr
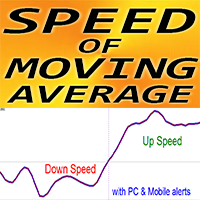
Crypto_Forex 지표 "MA 속도" MT4, 리페인트 없음.
이동 평균 속도 - 고유한 트렌드 지표입니다.
- 이 지표의 계산은 물리학의 방정식을 기반으로 합니다. - 속도는 이동 평균의 1차 미분입니다. - MA 속도 지표는 MA 자체가 방향을 얼마나 빨리 바꾸는지 보여줍니다. - MA 속도로 표준 전략도 업그레이드할 수 있는 기회가 많습니다. SMA, EMA, SMMA 및 LWMA에 적합합니다. - MA 속도는 트렌드 전략에서 사용하는 것이 좋습니다. 지표 값이 < 0이면 트렌드가 하락하고 지표 값이 > 0이면 트렌드가 상승합니다. - 시간 프레임 - 모두; 거래 쌍 - 모두. - 지표에는 모바일 및 PC 알림이 내장되어 있습니다.
매개변수(설정이 매우 쉽습니다): 1) 속도 기간. 권장 값은 3~7입니다. 지표의 민감도는 속도 기간이 낮을 때 증가하고 그 반대의 경우도 마찬가지입니다. 2) MA 기간(이 MA의 속도가 계산됩니다). 3) MA 방법: SMA, EM

Find the Closest Forex Patterns with This Indicator With this indicator, you can automatically detect the closest classic patterns in Forex. The lower the calculated value, the closer the pattern matches your criteria. You can also: Manually identify patterns on the chart. Create your own custom patterns and scan for them. About Chart Patterns Chart patterns are essential tools for traders to identify potential trading opportunities. These patterns form based on price action and provide i

I recommend you to read the product's blog (manual) from start to end so that it is clear from the beginning what the indicactor offers. This multi time frame and multi symbol divergence dashboard indicator sends an alert when one or two different divergences have been identified. It can be used with all time frames from M1 to MN. It is possible to enable moving average or RSI trend filter to filter out only the strongest setups. It should be combined with your own confirmation rules, techni

No Repaint Bext is a ready-made trading system. Shows when to open and when to close trades, as well as in which direction. Every time a green arrow appears, you need to open a buy trade. Close all buy trades when a red arrow appears. The same goes for the opposite direction, every time a red arrow appears, open sell trades and close them all when a green arrow appears. We use the M5 timeframe for trading. You can trade on any cozy pair.
This indicator does not repaint and practically does not

표시기는 핀 바 촛대 패턴을 표시합니다. 그림자,몸체 및 크기의 비율은 계수 설정을 사용하여 쉽게 조정할 수 있습니다. 추세(2 이동 평균)및 반전(리시 및 볼린저 밴드)별로 필터링 할 수 있습니다. 이것은 가장 인기있는 가격 행동 패턴입니다. 다중 통화 대시 보드를 사용할 수 있습니다. 그것으로,당신은 쉽게 차트 사이를 전환 할 수 있습니다.
거래 패턴: 트렌드 별 재시험. 거짓 고장. 기타.
EURUSD, GBPUSD, XAUUSD, ... M15, M30, H1.
입력 매개변수.
주요. Bars Count – 표시기가 작동하는 히스토리 바의 수. Min Candles Shadows / Body Ratio – 촛불의 몸에 그림자의 최소 비율. 그림자가 지정된 값보다 작 으면 이러한 촛불은 무시됩니다. 이 공식은 다음과 같습니다. Min Shadows UP/DN Ratio – 는 촛불의 다른 측면에서 그림자의 최소 비율입니다. 양쪽의 그림자가 길이가 같으면 그 비율은 1.

Multicurrency and multitimeframe modification of the indicator Bollinger Bands. On the dashboard you can see breakouts and touches of the Bollinger Bands. In the parameters you can specify any desired currencies and timeframes. The indicator can also send notifications when the price touches the Bollinger Bands, when the current volatility changes (expands or falls), and when the price touches all the bands. By clicking on a cell with a period, this symbol and period will be opened. This is MTF

Point Trend Indicator - An indicator of the upper and lower level of the trend, which can determine the trend direction and indicate its strengthening. The trend direction is determined by round dots; if the points are above the zero line, the trend is bullish; if below, the trend is bearish. The increase in directional movement is indicated by arrows. It has the only parameter for manual adjustment - Duration of the trend direction.
Possibilities
Works on all time frames Adapts to any financ

이 인디케이터는 임펄스 캔들을 검색하여 차트에 표시합니다. 섀도우 필터가 포함되어 있습니다. 또한 볼린저 밴드의 브레이크 아웃 레벨을 찾습니다. 설정에서 다중 통화 대시보드를 활성화할 수 있습니다. 알림은 현재 차트 또는 전체 목록 중에서 선택할 수 있습니다. Blog-Link - Retest and Fake Breakout with UPD1
거래 패턴: 추세 재테스트. 거짓 브레이크아웃. 기타.
EURUSD, GBPUSD, XAUUSD, ... M15, M30, H1.
입력 매개 변수.
기본. Bars Count - 인디케이터가 작동할 히스토리 막대의 수입니다. Coeff Period – 계산을 위한 기간입니다. Min HL Coeff – 캔들이 검색되는 계수입니다. 기본값은 2.0이지만 더 높은 주기에 더 많은 신호를 찾으려면 1.5로 설정할 수 있습니다. Shadow Filter – 값이 높을수록 캔들 스틱에 그림자의 크기가 커집니다. 50 이하로 설정하는 것이 바람

거래 수준 지표는 진입점을 결정하고 포지션을 유지하며 추세 방향을 유지하도록 설계된 거래 시스템입니다.
하나의 복합체에서 작동하는 여러 메커니즘, 추세 방향의 파동 분석, 신호 구성 시 레벨 분석을 포함하고 가능한 TP 및 SL 목표를 보여줍니다.
표시기 기능
신호 화살표는 현재 캔들에 표시되며 다시 칠해지지 않습니다. 가격이 반등하는 수준을 검색하기 위해 특별한 알고리즘을 사용합니다. 추세에 따라 작동합니다. 이 시스템은 보편적이며 다양한 거래 수단에 적용될 수 있습니다. 화살표 경고에는 여러 유형이 있습니다. 신호 화살표의 입력 매개변수는 자동 모드에서 구성되고 작동됩니다. 기간에 따라 "추세 파동 기간" 매개변수를 변경합니다. "목표 수준 SL TP" 매개변수는 주요 통화쌍에 대해 정의되어 있으며 다른 거래 상품에 사용하기 위해 10개 이상의 증가가 가능합니다.
표시기 작동 방식
추세를 결정하기 위해 지표에는 파동선이 있습니다. 가격보다 높으면 추세는 약세이고, 가격보다
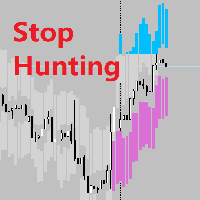
Realtime Stop Hunting Background What Is Stop Hunting? I refer to the definition of Stop Hunting from Investopedia, Stop hunting is a strategy that attempts to force some market participants out of their positions by driving the price of an asset to a level where many individuals have chosen to set stop-loss orders. The triggering of many stop losses at once typically creates high volatility and can present a unique opportunity for investors who seek to trade in this environment. Setting up the
Scalp SWING indicator.
It works on any time frame and Instruments
It works on trending and ranging markets.
The signals are robust and does not repaint.
The system is robust and requires no supporting indicator.
You don’t need any multiple indicators to trade the markets.
The alerts/ notifications can be enabled to gain prompt entries.
The entries are at Top and Bottom of Trend Cycles
It is Very accurate and robust system- yet extremely simplified tools for the pro traders.
Scalp SWING

The Percent Pivot indicator is a simple indicator that calculates the main percentage values. The graphical layout makes it very similar to the traditional pivot but its internal computing system is unique and irreplaceable. Every day, the market creates new bullish or bearish rates. This indicator help you to identify possible supports or resistance levels. The main values such as 0.25% and 0.50% are good reference points to use as potential target or reversal levels. This indicator has been de
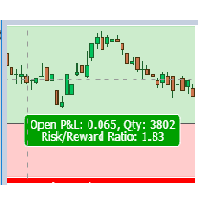
Risk Reward Panel This is a useful tool to plan a trade risk to reward visually. The indicator is very simple to use with minimum settings. Long or Short You can use the indicator for both long and short positions.
Lot Size Calculator You can also use this indicator as a lot size calculator. If you set the risk amount the indicator will calculate the lot size for you based on the stop loss line. You do not need to calculate the lot size manually.
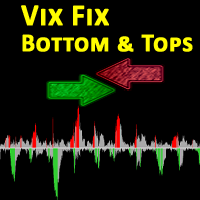
The VIX Fix is a volatility indicator developed by renowned trader Larry Williams. It's designed to measure volatility in assets that don't have options or futures, such as individual stocks and forex markets. Essentially, it acts as a synthetic VIX (Volatility Index) for any asset , providing a gauge of market uncertainty. This modified version of William's indicator helps you to find market bottoms and market tops. It comes with 2 styles: Stochastic and histogram style. Please see screenshot

The latest version of Indicator is fully integrated into an all-in-one package, including: Fair Value Gaps (FVG). Implied Fair Value Gap (IFVG). OrderBlock (OB). The options in the settings section are relatively easy to navigate, and you can even use them right away upon activation without encountering difficulties when using the default configuration. The indicator utilizes an algorithm to automatically draw and identify Order Blocks (OB), Fair Value Gaps (FVGs), and Implied Fair Value Gap
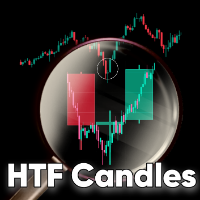
HTF Candles MT4 is a mt4 indicator which plots the outline of the higher time-frame candles on the lower candle, including any MT5 higher time-frame chosen. The indicator gives you the option to choose whether or not to view live current HTF candle, with no lag or repainting. Features MT5 Period Candles: This indicator plots any mt5 time-frame candle e.g m3, m5, m12, m15, m20... and so on, on the lower time-frame. Heiken Ashi Options: You have the option to view the HTF Heiken ashi instead of

The indicator displays a matrix of indicators across multiple timeframes with a sum total and optional alert. Custom indicators can also be added to the matrix, in a highly configurable way. The alert threshold can be set to say what percentage of indicators need to be in agreement for an alert to happen. The alerts can turned on/off via on chart tick boxes and can be set to notify to mobile or sent to email, in addition to pop-up. The product offers a great way to create an alert when multiple

Of all the four principle capital markets, the world of foreign exchange trading is the most complex and most difficult to master, unless of course you have the right tools! The reason for this complexity is not hard to understand. First currencies are traded in pairs. Each position is a judgment of the forces driving two independent markets. If the GBP/USD for example is bullish, is this being driven by strength in the pound, or weakness in the US dollar. Imagine if we had to do the same thing

This scanner is for showing Cross of various TDI elements: PriceLine, Trade Signal Line and Market Base Line And for getting alerts, so you can be prepared for finding good trade setups before they happen. It also shows TDI signals, trend, volatility and different timeframe alignment.
Detailed blog post:
https://www.mql5.com/en/blogs/post/759050
Features: Show TDI Signal and Trend Show Volatility & Overbought/Oversold Show cross between: PriceLine & TSL PriceLine & MBL MBL & TSL PriceLine and

Dark Breakout is an Indicator for intraday trading. This Indicator is based on Trend Following strategy, providing an entry signal on the breakout. The signal is provided by the arrow, which confirms the breaking of the level. We can enter in good price with this Indicator, in order to follow the main trend on the current instrument. It is advised to use low spread ECN brokers. This Indicator does Not repaint and N ot lag . Recommended timeframes are M5, M15 and H1. Recommended working pairs

"SOLVE ALL YOUR PROBLEMS FOREVER WITH THIS UNIQUE TRADING INDICATOR!" Additional Bonus: You get the ProTrading Arrow indicator for FREE! By doing something very simple, winning 6 out of every 10 trades, you will be a trader who makes money from the forex market. Trend Reversing PRO indicator giving perfect arrows along the trend combining trend reversal and trend following system. The indicator filters out most consolidation zones and market noise by avoiding false breakouts.
BENEFITS OF USING
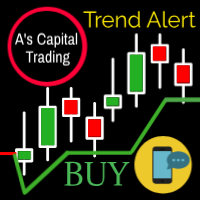
A 's Capital Line is a complex algorithm helpful for trends.
The EA for this indicator is As Capital EA . So you can test the indicator preformance. also use optimization funcion on trategy tester for a better preformance.
This line marks the following information: The entrance to the trend. Stop of loss. Supports and resistances. When to take Profit.
Send alerts to your cell phone through metatrader It works perfect on any instrument (stocks, forex, crypto, commodities, indices, etc). Also

Adaptive Volatility Range [AVR] is a powerful tool for identifying key trend reversal points. AVR accurately reflects the Average True Range (ATR) of volatility, taking into account the Volume-Weighted Average Price (VWAP). The indicator adapts to any market volatility by calculating the average volatility over a specific period, ensuring a stable rate of profitable trades. You receive not just an indicator but a professional automated trading system , AVR-EA . Advantages: Automated Trading Sys
COMPLETE VISUAL TRADING SYSTEM WITH THE BUY SELL SIGNALS - USING MULTI TIME FRAME TREND ANALYSIS
TREND STRENGTH POWER SIGNALS DASHBOARD.
TRADE INTRADAY, SHORT OR MEDIUM OR LONG TIME FRAME .
ALL THE SIGNALS WITH A MULTIPLE TIME FRAME TREND CONFLUENCE - INDICATES A STRONG MOVE AND CAN BE EASILY TRADED AS HIGH PROBABILITY TRADES.
COMPLE TRADING SYSTEM - WITH THE LOGICAL ENTRY , TARGETS AND STOP LOSS .
THE ALERTS ON THE DISPLAY SIDE OF THE ALERTS PANEL AREA , WILL INDICATE CLEARLY ALL THE ENTR

About Scanner:
Detailed blog post is here: https://www.mql5.com/en/blogs/post/749119
BB Squeeze Scanner uses bbsqueeze.ex4 in background to calculate when BB Squeeze (Bollinger Bands Squeeze) happens and when BBands expand. It is attached with the above blog post.
What is Bollinger Bands Squeeze:
The Bollinger bands squeeze is a special pattern when the volatility of a market decreases after trending periods. It is generally observed the price is ranging during this period until a new t
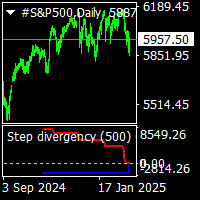
step divergency indicator is a buy sell divergency indicator.include sinus wave indicator. it work all timeframes and all pairs. red line gives step divergency sell formations. blue line gives step divergency buy formations. suitable for experienced and beginners. when prices is moving up and red lines step down ..this is sell divergecy formation and if prices moving down but blue line moving step up this is buy divergency formation. increased cnt value show more back side. gold line is sinus w

MASTER MA는 이동 평균 교차 기반 지표로, 서로 다른 기간 십자가를 가진 3개의 이동 평균을 사용하여 신호를 생성하고, 전략은 매우 간단하지만, 지표에는 승률/총 이익과 같은 유용한 인스턴트 백 테스트 결과를 보여주는 통계 대시보드가 있습니다. 등등, 이 지표에는 TP 및 SL 입력이 포인트로 표시되므로 TP와 SL을 TP의 경우 녹색 점, SL의 경우 빨간색 x 형태로 차트에 표시할 수 있으며, 지표는 해당 값을 사용하여 승/패 비율을 계산합니다.
이 표시기는 새 막대가 열릴 때 엄격하게 신호를 보냅니다. 신호는 다시 칠해지거나 지연되지 않습니다.
권장 사항 : m5 이상 사용... 일일 목표를 세우세요... 더 나은 결과를 얻기 위해 지표 기간을 가지고 놀아보십시오.
매개 변수:
3개의 이동평균, 기간 및 유형
경고
TP/SL 값은 각 신호와 함께 차트에 인쇄하고 다음을 기준으로 승패를 계산합니다.
Dashboard colors and Position 입력
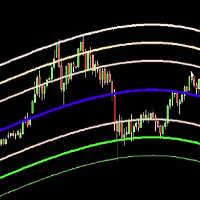
The Belkhayate center of gravity indicator is best used to confirm major turning points, and distinguish price extremes. Generally if price reaches the upper or lower levels one should expect a turn around coming soon, or at least a pull back towards the centre line if there is a strong trend. The upper and lower levels are red and green lines.
Our indicator use the same parameters as the well known trader M.Mostafa Belkhayate the inventor of the indicator, allow the use of buffers for your EA a

안녕하세요, 이것은 빙입니다. ICT 개념을 거래하기 위한 신뢰할 수 있는 지표를 찾고 있다면, ICT Market Structure는 보다 고급 전략을 사용하는 트레이더들을 위한 사용자 매뉴얼을 제공합니다. 이 올인원 지표는 ICT 개념(스마트 머니 개념)에 초점을 맞추고 있습니다. ICT Market Structure는 기관들이 어떻게 거래하는지 이해하려고 하며, 그들의 움직임을 예측하는 데 도움이 됩니다. 이 전략을 이해하고 활용함으로써, 트레이더들은 시장 움직임에 대한 귀중한 통찰력을 얻고 가격 행동에 기반한 더 실용적인 진입 및 청산 포인트를 찾을 수 있습니다. 다음은 일부 기능에 대한 간단한 소개입니다: 비재페인팅, 비리드로잉, 비래깅 지표 오더 블록(상승 및 하락), 볼륨 메트릭스와 얼럿이 있는 오더 블록 실시간 시장 구조와 스윙 구조 고점과 저점(HH, HL, LL, LH)과 얼럿이 있는 구조 붕괴(BOS), 성격 변화(CHoCH)/ 모멘텀 변화(MS) 브레이커 블록

KT Price Border는 세 개의 가격 밴드로 구성된 가격 채널을 생성하여 시장의 잠재적인 고점과 저점을 식별합니다. 이러한 레벨은 동적 지지 및 저항선으로도 사용할 수 있습니다. 중앙 밴드는 트렌드 방향을 식별하는 데에도 사용할 수 있으며, 결과적으로 트렌드 추종형 지표로도 작동합니다. 또한, 사용이 간편하고 직관적인 거래 신호를 제공하여 초보 트레이더에게 큰 도움이 됩니다。
특징
대부분의 외환 통화 쌍에서 효과적으로 작동합니다. 낮은 시간 프레임과 높은 시간 프레임에서 모두 사용 가능합니다. 스캘핑, 데이트레이딩, 스윙 트레이딩에 적합합니다. 트렌드 및 역추세 거래 전략을 모두 지원합니다. 가격이 가격 밴드를 통과할 때 알림을 보낼 수 있습니다. 가격 밴드는 동적 지지 및 저항 수준으로도 활용할 수 있습니다.
가격 경계 개념 이해하기 이 지표는 볼린저 밴드와 유사하게 작동합니다. 하단 밴드는 시장의 과매도 상태를 나타내며 동적 지지 역할을 합니다. 상단 밴드는 시장의

M & W Pattern Pro is an advanced scanner for M and W patters , it uses extra filters to ensure scanned patterns are profitable.
The indicator can be used with all symbols and time frames.
The indicator is a non repaint indicator with accurate statistics calculations.
To use , simply scan the most profitable pair using the statistics dashboard accuracy , then enter trades on signal arrow and exit at the TP and SL levels.
STATISTICS : Accuracy 1 : This is the percentage of the times price hits TP

KT MACD Alerts는 MetaTrader에서 제공되는 표준 MACD 지표를 기반으로 한 맞춤형 구현입니다. 다음 두 가지 이벤트 발생 시 알림을 제공하며 차트에 수직선을 표시합니다: MACD가 0선을 위로 돌파할 때 MACD가 0선을 아래로 돌파할 때
기능 모든 시간 프레임에서 MACD 방향을 보여주는 MTF(멀티 타임프레임) 스캐너가 내장되어 있습니다. MACD의 0선 상단 및 하단 크로스 신호에 따라 거래하는 트레이더에게 적합합니다. 알림과 함께 수직선을 자동으로 표시하여 교차 지점을 더 쉽게 식별할 수 있습니다. 가볍고 최적화된 코드로 설계되어 메모리와 시스템 자원을 거의 소모하지 않습니다. 팝업, 알림음, 이메일, 푸시 알림 등 MetaTrader에서 제공하는 모든 알림 방식을 지원합니다.
MACD의 역사 MACD(Moving Average Convergence Divergence, 이동 평균 수렴 확산 지표)는 주식 및 외환 시장에서 널리 사용되는 기술적 분석

harmonic patterns Harmonic patterns can be used to spot new trading opportunities and pricing trends – but only if you know exactly what you are looking for. Harmonic patterns are formed by combining geometric shapes and Fibonacci levels. As a result, Fibonacci levels are the key concept of these patterns. Identifying harmonic patterns requires more practice than other market classical patterns. But by learning these patterns, you can recognize the future trend of the price chart. These patter

정밀 거래 시스템의 PTS Demand Index 코드
Demand Index는 James Sibbet의 창조물이며 볼륨과 가격을 조합으로 해석하는 작업을 간단하게 만들기 위해 복잡한 코드를 사용합니다.
볼륨을 이해하는 것은 쉬운 작업이 아니지만, 이 아름다운 프로그래밍 조각은 작업을 훨씬 쉽게 만듭니다.
이 지표가 거래자와 투자자에게 어떻게 혜택을 줄 수 있는 몇 가지 방법이 있습니다.
다이버전스 (선행 지표로) 여러 해 동안 다양한 기술 지표를 연구한 결과, Demand Index는 의미 있는 다이버전스를 찾는 데 한몫하는 것 중 하나라는 의견을 형성했습니다.
시장 가격이 새로운 고점을 찍고 Demand Index가 아닌 경우 이를 악재 다이버전스라고 합니다. 웹 사이트에는 어떤 것을 찾아볼 지 이해하기 위해 극단적인 다이버전스 사례를 보여주는 강렬한 사진이 여러 장 있습니다. 다이버전스의 차이가 클수록 추세 변화 이벤트를 예측하는 데 중요한 지표가 됩니다.
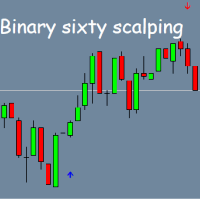
Binary Sixty Scalping – MT4용 바이너리 옵션 지표 Binary Sixty Scalping은 MT4 플랫폼용으로 특별히 설계된 바이너리 옵션 거래 지표입니다. 모든 시간 프레임에서 사용할 수 있지만 더 높은 정확도를 위해 M5 이상의 시간 프레임을 사용하는 것이 좋습니다. 모든 통화쌍과 호환되며 다양한 시장에 적응할 수 있습니다. 주요 특징: 기본 만료 시간 – 1 캔들 (설정에서 조정 가능); 추세 기반 거래 : 지표가 추세 방향을 분석하고 최적의 진입점을 찾아 신호를 제공합니다; 캔들 마감 전에 정확한 신호 : 차트에 화살표를 표시하며, 파란색은 매수, 빨간색은 매도를 나타냅니다; 신호 통계 : 신호의 성공률 통계를 표시하여 지표의 효과를 평가하는 데 도움이 됩니다; 리페인트 없음 : 신뢰할 수 있고 안정적인 신호를 제공합니다. 설치 가이드: 정상적인 작동을 위해 "MQL5" 폴더를 터미널의 루트 폴더에 복사하십시오. 파일 다운로드: Yandex Disk .
SSL은 Semaphore Signal Level(세마포 신호 레벨)의 약자로, 각각 고가와 저가에 적용된 두 개의 이동 평균선을 통해 가격을 따라가는 밴드를 형성하는 지표입니다. 매수 신호: 종가가 상단 이동 평균선 위에서 마감될 때. 매도 신호: 종가가 하단 이동 평균선 아래에서 마감될 때.
주요 기능 모든 시간 프레임에서 새로운 신호를 감지하는 다중 타임프레임 스캐너 내장. 전통적인 SSL 채널을 간단하게 구현하여 추세 방향을 손쉽게 파악 가능. 모든 MetaTrader 경고 기능을 포함합니다.
SSL 계산 방식 상단 라인: 캔들의 고가에 적용된 이동 평균선. 하단 라인: 캔들의 저가에 적용된 이동 평균선.
매수 진입: 종가가 SSL 상단 라인 위에서 마감될 때. 매수 청산: 종가가 SSL 하단 라인 아래에서 마감될 때.
매도 진입: 종가가 SSL 하단 라인 아래에서 마감될 때. 매도 청산: 종가가 SSL 상단 라인 위에서 마감될 때.

Warning: Our product works with 28 symbols. The average accuracy level of the signals is 99%. We see signals below 15 pips as unsuccessful.
Pip Counter Arrows indicator is designed for signal trading. This indicator generates trend signals.
It uses many algorithms and indicators to generate this signal. It tries to generate a signal from the points with the highest trend potential.
This indicator is a complete trading product. This indicator does not need any additional indicators.
The in

Ultimate Trend Finder (Multi Pair And Multi Time Frame) : ---LIMITED TIME OFFER: NEXT 25 CLIENTS ONLY ---46% OFF REGULAR PRICE AND 2 FREE BONUSES ---SEE BELOW FOR FULL DETAILS Institutional traders use moving averages more than any other indicator. As moving averages offer a quick
and clear indication of the institutional order flow. And serve as a critical component in the decision making
within numerous institutional trading rooms.
Viewing the market through the same lens as the inst

The indicator of the indicators. The Most Powerful Technique to Determine Forex Trend Strength in 2023. We have perfected Supreme Commander that it calculates an average of the selected indicators (up to 16) and the selected timeframe (all) with the result of a single trend that indicates the potential of buying and selling. It includes the following indicators:
Accelerator/Decelerator oscillator Average Directional Movement Index Awesome oscillator; Bulls and Bears Commodity Channel Index; De

Upper and Lower Reversal - 반전 순간의 조기 예측을 위한 시스템입니다. 상한 및 하한 가격 이동 채널의 경계에서 가격 전환점을 찾을 수 있습니다.
표시기는 신호 화살표의 색상을 다시 지정하거나 위치를 변경하지 않습니다. 빨간색 화살표는 매수 신호, 파란색 화살표는 매도 신호입니다.
모든 기간 및 거래 수단에 맞게 조정됩니다. 표시기는 다시 그려지지 않으며 양초가 닫힐 때만 작동합니다. 신호에 대한 경고에는 여러 유형이 있습니다. 이 표시기는 사용하기 쉽고 2개의 외부 구성 매개변수만 있습니다.
Channel Length - 신호가 구축될 가격 채널의 길이를 조정합니다. Signal Normalization - 신호 화살표의 품질 수준을 변경합니다. 매개변수가 높을수록 잘못된 신호가 줄어듭니다(BTC, 금 및 변동성이 높은 상품의 경우 몇 배로 변경됨). Alerts play sound / Alerts display message / Alerts send n

The Silent Edge of Smart Money
"It's not about how much you do, but how much love you put into what you do that counts." – Mother Teresa
They say the real money in trading is made in the shadows—where inefficiencies hide and only the most perceptive capitalize. That’s exactly where the Arbitrage Thief Index (ATI) thrives. For years, this tool has been my personal advantage , silently identifying low-risk, high-reward trades before the crowd even notices. It’s the kind of edge top fund managers
"IF YOU'RE LOOKING FOR A UNIQUE TRADING INDICATOR TO TRADING…AT AN AFFORDABLE PRICE…YOU'VE COME TO THE RIGHT PLACE!" Additional Bonus: You get the ProTrading Arrow indicator for FREE! Forex trading is like any business, includes some rules, for example using a good indicator and proper money management (a skill that anyone can master). The DayTradingArrow v1 indicator usually allows to trade on the safe side of the market by filtering out most consolidation zones and market noise. Adaptive intel
트레이딩 전략과 기술 지표를 판매하기에 가장 좋은 장소가 왜 MetaTrader 마켓인지 알고 계십니까? 광고나 소프트웨어 보호가 필요 없고, 지불 문제도 없습니다. 모든 것이 MetaTrader 마켓에서 제공됩니다.
트레이딩 기회를 놓치고 있어요:
- 무료 트레이딩 앱
- 복사용 8,000 이상의 시그널
- 금융 시장 개척을 위한 경제 뉴스
등록
로그인
계정이 없으시면, 가입하십시오
MQL5.com 웹사이트에 로그인을 하기 위해 쿠키를 허용하십시오.
브라우저에서 필요한 설정을 활성화하시지 않으면, 로그인할 수 없습니다.
