RunwiseFX Multiple Indicator Matrix with Alert
- 지표
- 버전: 4.4
- 업데이트됨: 21 9월 2023
- 활성화: 5

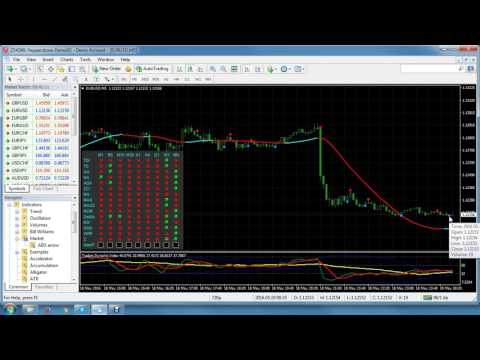
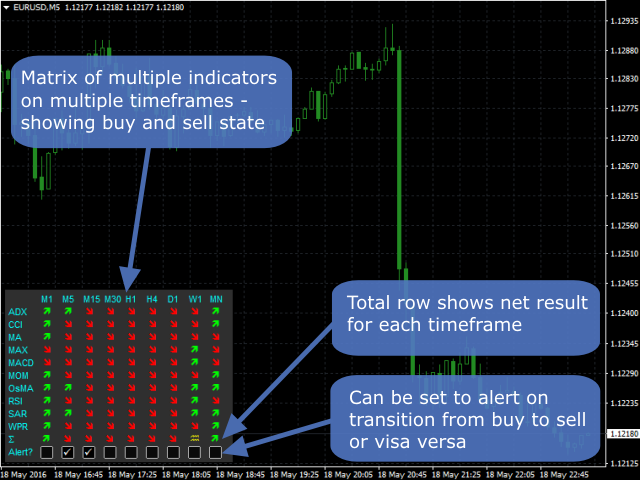
The indicator displays a matrix of indicators across multiple timeframes with a sum total and optional alert. Custom indicators can also be added to the matrix, in a highly configurable way. The alert threshold can be set to say what percentage of indicators need to be in agreement for an alert to happen. The alerts can turned on/off via on chart tick boxes and can be set to notify to mobile or sent to email, in addition to pop-up.
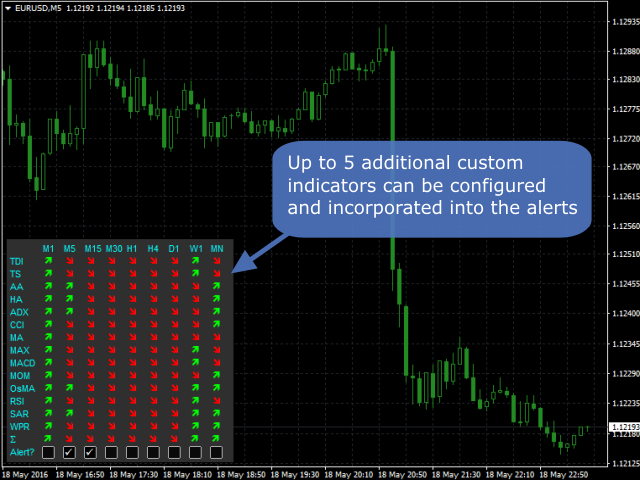
The product offers a great way to create an alert when multiple indicators are in agreement, whether they be standard indicators or custom indicators, including those purchased via Market.
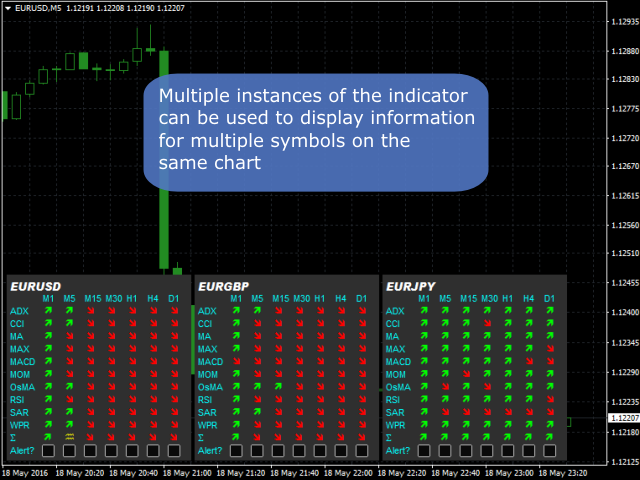
Information on multiple symbols can be shown on the same chart by using multiple instances of the indicator, each configured with a different symbol and position.
The properties of the standard indicators can be changed via the indicator inputs and a wide variety custom indicators are supported. The standard indicators shown by default are: ADX, CCI, market price above/below Moving Average (MA), Moving Average Cross (MAX), MACD, Momentum (MOM), OsMA, RSI, Parabolic SAR, William's Percentage Range (WPR). Any of these can be turned off.
Notes when using strategy tester: The test needs to be running at least market speed for the alert tick boxes to work. Alerts will appear in the Journal tab. Indicators on the weekly and monthly timeframes may not be calculated.
Inputs
- Important_alertThresholdPercentage - Threshold at which alert will happen, e.g. if set to 75 would mean 75% of indicators would need to agree for alert on the timeframe.
- Important_alertOnlyWhenAllSelectedMatch - If true, then will only alert if all the selected timeframes are in agreement.
- Important_defaultAlerts - Set to 1 if alert should be on by default. Values are comma separated for each timeframe.
- Important_periodsToShow - Periods (timeframes) to show. Values are comma separated.
- Important_symbol - Symbol to show information for. If blank will be the symbol of the chart.
- Main_alertAllResetLevel - How many periods need to have gone other way for alert to reset
- Main_disableSpreadAskBid - If true then won't show spread/ask/bid
- Main_distanceMethod - How to look back for indicators showing arrows/dots
- Main_drawBackground - Set false to turn off background
- Main_indiExamineCandles - (used for debugging)
- Main_maxBarsToSearch - How far to search back for indicators showing arrows/dots
- CustomN_indicatorName - Custom indicator name as appears in Indicators folder in your MetaTrader Data Folder
- CustomN_indicatorDisplayAs - Indicator name to display as in the matrix. If left blank then will truncated CustomN_indicatorName.
- CustomN_indicatorProperties - Indicator properties. Should be comma separated in the order they appear in the indicator. Boolean type inputs should be set as 0 or 1 and text inputs should be enclosed in double quotes. If left blank then the default indicator properties will be used.
- CustomN_colorIndex - Color index of the indicator to show in matrix. Can be comma separated if buy and sell indexes need to be supplied.
- CustomN_shift - Candle shift to use for indicator capture, where 0 is live candle and 1 is most recently closed candle
- CustomN_midPoint - Mid point to be used if only one color index is supplied and gives the indicator value that represents the transition from buy to sell
- CustomN_nullValue - Null value to be used to decide if the indicator value should be ignored / regarded as not present. AUTO is EMPTY_VALUE or 0
- CustomN_captureMethod - Controls how the indicator value should be interpreted (see video for examples)
- Show_* - Allows the standard indicators to be turned on/off, in terms of being in the matrix and contributing to the alert
- Box_* - Allows the position of the matrix to be changed
- Property_* - Allows the properties of the standard indicators to be changed, e.g. period of moving average
- Gen_alert* - Allows the alert to be sent to mobile / email
- (other properties) - These are cosmetic and shouldn't need to be changed
Converting Into an EA to Trade Automatically
Our Ultimate Trade Manager can configured to trade the signals from the Matrix automatically. Contact us for details.

Great Product, Great Team, Great Support and i think nothing else needed to buy this product.