MetaTrader 4용 유료 기술 지표 - 3

Scalping Arrow Notification Phone is a unique scalping trading indicator. The indicator draws arrows on the chart when you need to open an order, shows in which direction you need to open orders, and also sends you a notification about a signal to your mobile phone. At any time, even when you are not at the computer, you will receive signals, be able to control the market and trade. The indicator shows with an arrow when to open an order, as well as the direction of the arrow shows in which dir

The indicator very accurately determines the levels of the possible end of the trend and profit fixing. The method of determining levels is based on the ideas of W.D.Gann, using an algorithm developed by his follower Kirill Borovsky. Extremely high reliability of reaching levels (according to K. Borovsky - 80-90%) Indispensable for any trading strategy – every trader needs to determine the exit point from the market! Precisely determines targets on any timeframes and any instruments (forex, met

ADR 경보 대시보드는 가격이 일반적인 일일 평균 범위와 관련하여 현재 거래되고 있는 위치를 한 눈에 보여줍니다. 가격이 평균 범위를 초과하고 선택한 수준보다 높을 때 팝업, 이메일 또는 푸시를 통해 즉각적인 알림을 받을 수 있으므로 신속하게 철회 및 반전에 뛰어들 수 있습니다. 대시는 빈 차트에 배치되도록 설계되었으며 배경에 앉아서 레벨에 도달하면 경고하므로 앉아서 보거나 전혀 볼 필요가 없습니다! MT5 버전은 여기에서 사용 가능: https://www.mql5.com/en/market/product/66316
새로운 기능: 이제 평균 WEEKLY 및 MONTHLY 범위와 경고도 표시됩니다!
여기에서 차트의 수준을 나타내는 ADR 반전 표시기를 얻으십시오. https://www.mql5.com/en/market/product/62757
시간의 약 60%는 가격이 정상적인 일일 평균 범위(ADR) 내에서 거래되고 이 수준 이상으로 상승하면 일반적으로 급격한 가격 변동의 지표

Ultimate Engulfing Bar Scanner (Multi Pair And Multi Time Frame) : ---LIMITED TIME OFFER: NEXT 25 CLIENTS ONLY ---46% OFF REGULAR PRICE AND 2 FREE BONUSES ---SEE BELOW FOR FULL DETAILS Nothing is more important than institutional price action and order flow.
And a strong engulfing candle is a clear indication that the institutions have flipped their sentiment.
Engulfing bar patterns are widely used by institutional traders around the world. As they allow you to manage
your trades within

This indicator works on MT4 and is very easy to use. When you receive a signal from it, you wait for that candle with the signal to close and you enter your trade at the beginning of the next new candle . A red arrow means sell and a green arrow means buy. All arrows comes with Alert like for easy identification of trade signal. Are you okay with that?
1 minute candle
1 minute expire
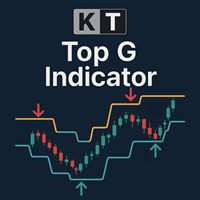
KT Top G는 가격 행동 기반의 인디케이터로, 스마트 채널 분석을 결합하여 시장의 잠재적인 고점과 저점을 식별합니다. 반전 가능성이 감지되면, 차트에 굵고 선명한 화살표를 표시하여 시장이 반전되기 전에 미리 알려줍니다. 큰 화살표: 가격 소진과 모멘텀 전환을 감지하여 고확률의 시장 고점과 저점을 강조합니다. 작은 화살표: 낮은 확률의 반전 지점을 나타내며, 실제 반전 전에 종종 돌파됩니다.
기능 광범위한 호환성: 모든 통화쌍은 물론, 지수, 주식, ETF 등 다양한 종목에서 매끄럽게 작동합니다. 다중 시간 프레임 최적화: M1, M5에서의 스캘핑, H1, H4, D1에서의 스윙 트레이딩에 모두 적합합니다. 중심선 포함 동적 채널: 화살표 외에도 현재 시장 범위와 추세 방향을 강조하는 중간선을 포함한 채널이 함께 표시됩니다. 리페인트 없음: 차트에 화살표가 한 번 나타나면 유지되며, 사라지거나 바뀌지 않습니다. 변동성 있는 시장 대응 가능: 길이 및 스무딩 계수를 조정하여 예측

Apollo BuySell Predictor 는 여러 거래 모듈을 포함하는 전문 거래 시스템입니다. 트레이더에게 고유한 브레이크아웃 영역, 피보나치 기반 지원 및 저항 수준, 피벗 추세선, 풀백 볼륨 신호 및 모든 트레이더가 매일 필요로 하는 기타 유용한 기능을 제공합니다. 시스템은 모든 쌍과 함께 작동합니다. 권장 시간 프레임은 M30, H1, H4입니다. 지표는 H4보다 높은 시간 프레임을 제외하고 다른 시간 프레임에서도 작동할 수 있습니다. 이 시스템은 모든 트레이더가 성공적인 거래에 필요한 모든 것을 제공하므로 보편적입니다. 이 시스템은 여러 가지 방법으로 사용할 수 있습니다. 데이 트레이딩, 스윙 트레이딩, 심지어 스캘핑까지 사용할 수 있습니다. 귀하가 선호하는 거래 스타일에 관계없이 시스템은 귀하가 시장을 실제 모습으로 볼 수 있도록 도와줄 것입니다. 모든 신호는 다시 칠하지 않고 지체하지 마십시오! 거래 기본 설정 및 작업에 따라 시스템의 다른 모듈을 켜거나 끌 수 있습

ICT Silver Bullet
If you are searching for a reliable indicator to trade the ICT Silver Bullet concept, or ICT concepts, Smart Money Concepts, or SMC, this indicator will respond to your need! This indicator will help you identify the following: FVG - fair value gaps Market structure: BOS and CHOCH. It is based on ZIGZAG as it is the most subjective way to do it. ICT Silver Bullet windows and related notifications when it starts and when an FVG appears Swing High and low that are potential bu

TPA True Price Action indicator reveals the true price action of the market makers through 100% non-repainting signals (except early signals mode) strictly at the close of a candle!
TPA shows entries and re-entries, every time the bulls are definitely stronger than the bears and vice versa. Not to confuse with red/green candles. The shift of power gets confirmed at the earliest stage and is ONE exit strategy of several. There are available now two free parts of the TPA User Guide for our custom

Special offer : ALL TOOLS , just $35 each! New tools will be $30 for the first week or the first 3 purchases ! Trading Tools Channel on MQL5 : Join my MQL5 channel to update the latest news from me 혁신적인 RSI Kernel Optimized with Scanner를 소개합니다. 이 최첨단 도구는 강력한 커널 밀도 추정(KDE) 알고리즘을 통합하여 전통적인 RSI 분석을 재정의합니다. 이 고급 지표는 실시간으로 시장 트렌드에 대한 인사이트를 제공할 뿐만 아니라, 여러 통화쌍과 시간 프레임을 동시에 스캔할 수 있는 대시보드를 포함하고 있습니다. 이 도구가 당신의 거래 도구 상자에 필수적인 이유를 살펴보겠습니다. See more MT5 version at: RSI Kernel Optimized with
User Manual For more information pm me SL Currency28 Pair Dashboard is even used by the Banks to make profits. They take a strong currency and pitch against a weak currency This strategy i am made my other indicator SL Currency Strength Meter 28 Pair more improvement We can easily study the financial strength of multi-faceted trading SL Currency28 Pair Dashboard strength meter which creates multiple charts in a single window based on the price action of each currency in relation to

Effortless trading: non-repainting indicator for accurate price reversals This indicator detects price reversals in a zig-zag fashion, using only price action analysis and a donchian channel. It has been specifically designed for short-term trading, without repainting or backpainting at all. It is a fantastic tool for shrewd traders aiming to increase the timing of their operations. [ Installation Guide | Update Guide | Troubleshooting | FAQ | All Products ] Amazingly easy to trade It provides

Supply Demand Analyzer is an advanced trading indicator meticulously designed for the precise identification, analysis, and management of supply and demand zones. By integrating real-time data and advanced algorithms, this tool enables traders to recognize market phases, price movements, and structural patterns with unparalleled accuracy. It simplifies complex market dynamics into actionable insights, empowering traders to anticipate market behavior, identify trading opportunities, and make info

Binary Scalper 6 – MT4용 강력한 바이너리 옵션 지표
Binary Scalper 6은 MetaTrader 4 (MT4) 용 고급 트렌드 분석 및 바이너리 옵션 거래 도구입니다. 모든 수준의 트레이더에게 적합하며, 명확한 신호와 통계를 제공합니다. 주요 특징: 트렌드 탐지 : 트렌드 시장을 정확하게 식별. 모든 통화쌍 지원 : 선호 시장에서 유연한 거래 가능. 모든 시간 프레임에서 작동 : 1분에서 월간 차트까지. 1 캔들 만료 신호 : 빠르고 명확한 거래 기회 제공. 내장 통계 : 시장 성과에 대한 귀중한 데이터 제공. 버퍼 화살표 : 정확한 진입 신호 제공. 설치 방법:
MQL5 폴더를 다운로드하여 MetaTrader 4 디렉토리에 이동하세요. 여기에서 다운로드 。.........

Volume Bar POC 인디케이터 는 틱 거래량을 기반으로 주요 가격 수준(Point of Control, POC)을 정확하게 시각화할 수 있는 혁신적인 도구입니다. 이 인디케이터는 각 캔들 내의 모든 가격 포인트를 분석하여 가장 중요한 가격 수준을 표시하며, 강력한 지지 및 저항 영역으로 활용할 수 있습니다. 데이 트레이딩 및 장기 거래 전략에 이상적입니다. Volume Bar POC 인디케이터는 어떻게 작동합니까? 이 인디케이터는 각 캔들이 형성되는 동안 POC를 계산하기 위해 고급 프로세스를 사용합니다: 캔들이 열릴 때 테이블 생성 : 새 캔들이 열리면 인디케이터는 다음 데이터를 포함하는 내부 테이블을 생성합니다: 가격 : 캔들의 Low와 High 사이의 모든 가격 수준. 거래량 : 각 가격 수준에서 발생한 틱 수(틱 거래량). 테이블은 캔들 범위 내의 모든 가격 포인트를 동적으로 포함합니다. 캔들이 형성되는 동안 테이블 업데이트 : High와 Low 값이 변할 때마다 새로

Volume Footprint Analysis is a precision-engineered, volume-based indicator that transforms raw market volume into an intuitive, color-coded signal system. Built on concepts from Volume Spread Analysis (VSA) and Smart Money principles, this tool removes the guesswork from volume interpretation and gives traders clear, actionable insights on when to buy or sell — on any timeframe and across any trading instrument. MT5 Version - https://www.mql5.com/en/market/product/138565/ Join To Learn Mark

Supply and demand zones are at the heart of supply and demand trading . These zones are areas that show liquidity at a specific price. The supply zone is also called the distribution zone, while the demand zone is called the accumulation zone. Our indicator automatically draw supply and demand zones in Metatrader 5. It give opportunity to understand trading zone and avoiding risk.

EZZ Elite Zig Zag is an indicator for the MetaTrader 4 terminal. This indicator traces the peak of the trend based on the market reversal, thus showing various opportunities in the financial market. EZZ Elite Zig Zag is a visual tool, intuitive, and easy to understand and use.
Test it Yourself by Downloading it for Free.
Author Paulo Rocha all rights reserved
Professional Trade Arrow
Special offer! https://www.mql5.com/ru/users/bossik2810 Non-repaint MT4 technical indicator.
works on all timeframes 1 minute to the monthly timeframe
the trade vision buy and sell arrow is a multi currency and synthetic indicator
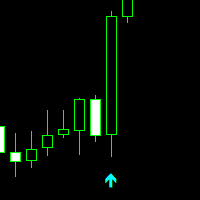
Aqua arrow look for selling opportunities
Crimson arrow look for buying opportunities.
wait for candle to close and arrow to appear before taking any trades.
Settings: Key value - 3.0 ( This parameter is adjusted for a better sig

Introduction to Chart Pattern MT Chart Pattern MT is a chart pattern scanner to detect the triangle pattern, falling wedge pattern, rising wedge pattern, channel pattern and so on. Chart Pattern MT uses highly sophisticated chart pattern detection algorithm. However, we have designed it in the easy to use with intuitive user interface. Chart Pattern MT will show all the patterns in your chart in the most efficient format for your trading. You do not have to do tedious manual pattern detection an

M1 EASY SCALPER is a scalping indicator specifically designed for the 1-minute (M1) timeframe, compatible with any currency pair or instrument available on your MT4 terminal. Of course, it can also be used on any other timeframe, but it works exceptionally well on M1 (which is challenging!) for scalping. Note: if you're going to scalp, make sure you have an account suitable for it. Do not use Cent or Standard accounts as they have too much spread! (use ECN, RAW, or Zero Spread accounts)
Robustn

SMC Venom Model BPR 지표는 Smart Money(SMC) 개념 내에서 일하는 트레이더를 위한 전문 도구입니다. 가격 차트에서 두 가지 주요 패턴을 자동으로 식별합니다. FVG (공정 가치 갭)는 3개의 캔들의 조합으로, 첫 번째와 세 번째 캔들 사이에 갭이 있습니다. 이는 볼륨 지원이 없는 레벨 사이에 구역을 형성하여 종종 가격 수정으로 이어집니다. BPR (균형 가격 범위)은 두 개의 FVG 패턴의 조합으로, "브리지"를 형성합니다. 이는 가격이 낮은 볼륨 활동으로 움직일 때 브레이크아웃과 레벨로의 복귀 구역으로, 캔들 사이에 갭을 생성합니다.
이러한 패턴은 거래자가 차트에서 거래량과 가격 역학을 분석하여 주요 지지/저항 수준, 돌파 구역 및 진입 지점을 식별하는 데 도움이 되며, 여기서 대형 시장 참여자와 일반 참여자 간의 상호 작용이 발생합니다. 이 지표는 사각형과 화살표 형태로 패턴을 시각화하며 유연한 경고 설정도 지원합니다.
주요 특징:
패턴 표시 모드:

Visit our all-new Stein Investments Welcome Page to get the latest information, updates and trading strategies. Do you want to become a constantly profitable 5-star forex trader? Then get our Stein Investments trading tools and send us a screenshot to get your personal invitation to our exclusive trading chat with 500+ members.
FX Trend displays the trend direction, duration, intensity and the resulting trend rating for all time frames in real time.
You'll see at a glance at which dire
How To Determine If The Market is Strong Or Weak?
Strength Meter uses an Adaptive Algorithm That Detect Price Action Strength In 4 Important Levels! This powerful filter gives you the ability to determine setups with the best probability.
Features Universal compatibility to different trading systems Advance analysis categorized in 4 levels Level 1 (Weak) - Indicates us to WAIT. This will help avoid false moves Weak Bullish - Early signs bullish pressure Weak Bearish - Early signs bearish press

REMINDER: Early buyers hot price discount: Price subject to rise after first 20 copies. Starting price $65 and final price will be $1275. Secure your discounted copy Now!
Smart Money Analyser Indicator User Manual
1. Introduction Welcome to the Smart Money Analyser Indicator This powerful tool provides traders with comprehensive market analysis by combining various technical indicators to generate actionable trading signals. Designed to be user-friendly, this indicator helps traders of all

The All-in-One Trade Indicator (AOTI) determines daily targets for EURUSD, EURJPY, GBPUSD, USDCHF, EURGBP, EURCAD, EURAUD, AUDJPY, GBPAUD, GBPCAD, GBPCHF, GBPJPY, AUDUSD, and USDJPY. All other modules work with any trading instruments. The indicator includes various features, such as Double Channel trend direction, Price channel, MA Bands, Fibo levels, Climax Bar detection, and others. The AOTI indicator is based on several trading strategies, and created to simplify market analysis. All-in-One

Special offer : ALL TOOLS , just $35 each! New tools will be $30 for the first week or the first 3 purchases ! Trading Tools Channel on MQL5 : Join my MQL5 channel to update the latest news from me 다중 시간 프레임의 체적 주문 블록 지표는 주요 시장 참가자들이 주문을 축적하는 중요한 가격 영역을 식별하여 시장 행동에 대한 더 깊은 통찰을 원하는 트레이더들을 위해 설계된 강력한 도구입니다. 이 영역들은 체적 주문 블록으로 알려져 있으며, 잠재적 지지 및 저항 구역으로 작용해 정보에 입각한 거래 결정에 중요한 이점을 제공합니다. MT5 버전 보기: Volumetric Order Blocks MT5 Multi Timeframe See more products at: https://www.mql5.com

Order block hunter indicator is the best indicator for hunt the order blocks that area where there has been a large concentration of limit orders waiting to be executed Order blocks are identified on a chart by observing previous price action and looking for areas where the price experienced significant movement or sudden changes in direction .This indicator does that for you by using very complicated codes and helps you to take the best areas To buy and sell because it make marks at the best a

우선, 이 트레이딩 인디케이터는 재탐색되지 않으며, 다시 그려지지 않고, 지연이 없는 점을 강조할 가치가 있습니다. 이는 수동 트레이딩과 알고리즘 트레이딩 모두에 이상적입니다. 사용자 매뉴얼, 프리셋 및 온라인 지원이 포함됩니다. AI Trend Pro Max는 정밀도, 강력함, 단순함을 추구하는 트레이더를 위해 설계된 정교한 올인원 트레이딩 시스템입니다. 이전 지표들의 개발을 바탕으로 만들어졌으며, 현재까지 가장 진화된 버전으로, 여러 신호 층, 전문 필터 및 스마트한 사용자 인터페이스가 장착되어 있습니다. 초보자든 전문가든 상관없이, AI Trend Pro Max는 어떤 시장 상황에서도 자신감을 가지고 거래할 수 있도록 필요한 모든 것을 제공합니다. 주요 전략 및 시스템 로직: 다층 신호 엔진: 트렌드 모멘텀, 가격 강도, 거래량, RSI, 볼린저 밴드 및 캔들 색상 논리를 결합하여 고확률의 진입 신호를 제공합니다. 트렌드 모멘텀: 트렌드가 강화되고 있는지 약화되고 있는지
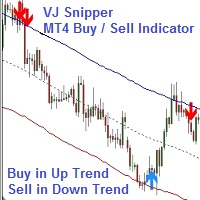
VJ Sniper - MT4 Buy / Sell Indicator: This Indicator is as simple as Buy in Up Trend & Sell in Down Trend. There are 2 Support / Resistance lines for choosing the best Entries. Background: Any in-built indicator of MT4 does not work as stand alone such as Stochastic, CCI or DeMarker etc. But combination of them with trend projection work & give the best results for Trading entries. So this Indicator is blended to give the best results whi

MT5 Version Available Here: https://www.mql5.com/en/market/product/50048
Telegram Channel & Group : https://t.me/bluedigitsfx
V.I.P Group Access: Send Payment Proof to our Inbox
Recommended Broker: https://eb4.app/BDFXOsprey *All In One System Indicator, Breakthrough solution for any Newbie or Expert Trader! The BlueDigitsFx Easy 123 System makes it easy to identify important areas of market structure. It alerts you to changes in market structure which typically occur when a reversa

MonsterDash Harmonic Indicator is a harmonic pattern dashboard. It recognizes all major patterns. MonsterDash is a dashboard that displays all detected patterns for all symbols and (almost) all timeframes in sortable and scrollable format. Users can add their own user defined patterns . MonsterDash can open and update charts with the pattern found.
Settings MonsterDash's default settings are good enough most of the time. Feel free to fine tune them to your needs. The color settings are for thos

이 지표는 매수 또는 매도 압력에 대한 모든 막대를 선별하고 볼륨이 가장 높은 4가지 유형의 캔들 패턴을 식별합니다. 이 양초는 여러 선형 필터를 사용하여 필터링되어 매수 또는 매도 신호를 표시합니다. 신호는 더 높은 시간 프레임 방향과 함께 거래량이 많은 시간에 거래될 때 가장 잘 작동합니다. 모든 필터는 사용자 정의가 가능하며 독립적으로 작동합니다. 버튼 클릭으로 단일 방향의 신호를 볼 수 있습니다. 또한 이 지표에는 의사 결정 과정을 지원할 수 있는 가장 중요한 가격 조치 및 스마트 머니 개념이 포함되어 있습니다. 하나의 도구에서 신호 및 거래 교육을 모두 제공합니다.
특징: 신호는 다시 칠하지 않습니다. Engulfing candles, Rejection candles, Expanded range candles 및 Pinbars를 식별합니다. 각 유효한 신호에 대해 여러 항목, 손절매 및 여러 이익 실현 수준을 표시합니다. 대량 세션으로 필터링합니다. 지원/저항 수준 및

폭탄 은행 신호: MetaTrader 4의 신뢰도 지표
Bomb Bank Signal은 금융 시장에서 가장 관련성이 높은 추세를 식별하도록 설계된 MetaTrader 4의 강력한 지표입니다. 움직임을 정확하게 예측하는 도구를 찾고 있다면 Bomb Bank가 바로 여러분에게 필요한 동맹입니다.
작동 방식:
이 지표는 거래량 분석, 양초 종가, 대칭 추세 등 세 가지 방법을 결합하여 매수 및 매도 기회를 감지하고 신호를 보냅니다. Bomb Bank는 매수 기회를 포착할 때는 '폭탄'과 같고, 매도 신호를 감지할 때에는 '해골'과 같습니다.
폭탄 은행은 왜 다른가요?
완전한 신뢰성: 폭탄 은행 신호는 신호를 제거하지 않습니다. 일단 신호가 발행되면 그 신호는 계속 유지되므로 기회를 절대 놓치지 않습니다. 극도의 정확성: Bomb Bank는 잘못된 신호를 보내지 않습니다. 시장이 발전함에 따라 조정하면서 실시간으로 업데이트하지만 이전 신호의 투명성은 유지합니다. 실시간 업데이트:

Smart Set up leve l is a very powerful indicator based on the concept of order blocks and set up entries with proper fvg and breakouts to make a very nice level to enter like a pro trader. Very easy to use interface and friendly to enter on buy and sell signals. Works Best on M15 Time frame on Gold, Bitcoin and Fx pairs. Daily 4-5 trades on each pair Works great on gold like a pro on M15 It is non repainting nor lagging It is very powerful indicator giving precise entries and prop acts can be c
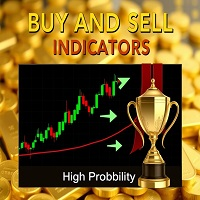
The Rejection Confirmation Indicator identifies high-probability reversal points using price rejection patterns (pin bars). Key features:
- Works on all timeframes (optimized for 5min/30min) - Clear visual signals with arrows and text labels - Built-in risk management guidelines - Best performance on Gold/XAUUSD and EURUSD
Trading Strategy: 5-minute charts: - Ideal for scalping 10-20 pips (EURUSD) - Gold requires wider stops (15-20 pips) - Best during London/New York overlap (8AM-12PM EST)
3

BUY INDICATOR AND GET EA FOR FREE AS A BONUS + SOME OTHER GIFTS! ITALO VOLUME INDICATOR is the best volume indicator ever created, and why is that? The Indicator works on all time-frames and assets, indicator built after 7 years of experience on forex and many other markets. You know many volume indicators around the internet are not complete, does not help, and it's difficult to trade, but the Italo Volume Indicator is different , the Italo Volume Indicator shows the wave volume, when market

Emergency trend technical indicator is used to analyze price movements in the Forex market. It is included in the so-called arrow indicators. And it is very practical in that it forms arrows in places where buy signals appear, or, conversely, sell signals.
Naturally, do not forget that any indicator is just an assistant, not a magical tool, by the will of which you will become fabulously rich.
Unfortunately, many novice traders forget about this, they see a potential grail in each indicator,
오프닝 레인지 브레이크아웃 지표는 ICT(Inner Circle Trader), 스마트 머니 컨셉트(SMC), 거래량 또는 주문 흐름 기반 전략과 같은 기관 거래 개념을 따르는 트레이더를 위해 설계된 세션 기반 거래 도구입니다. 이 지표는 주요 세션의 오프닝 레인지를 표시하여 트레이더가 주요 글로벌 외환 거래 세션에서 잠재적인 유동성 스윕, 브레이크아웃 존, 페이크아웃, 그리고 주요 일중 가격을 파악할 수 있도록 지원합니다. 이 전략은 각 세션 개장 후 미리 정의된 시간 단위인 ' 개장 범위' 개념에 기반을 두고 있습니다. 이는 트레이더가 마켓메이커의 의도, 단기 편향, 그리고 일중 방향성 움직임을 파악하는 데 도움을 줍니다. 이 지표는 해당 범위의 고점과 저점을 표시하고 이를 확장함으로써 스마트 머니 돌파 , 세션 스윕 , 허위 돌파 , 공정가치 갭(FVG) , 그리고 범위 확장을 시각적으로 모니터링하는 데
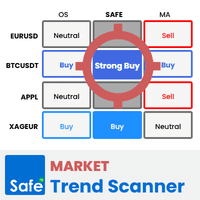
Market Trend Scanner is a trend analyzer or trend screener indicator that helps you know the trend in selected timeframe of all symbols you're watching .
This indicator provides clear & detailed analysis results on a beautiful dashboard, let you able to use this result right away without need to do any additional analysis. How it works
Step 1: Calculate values of 23 selected & trusted technical indicators (Oscillator & Moving Average indicators)
Step 2: Analyze all indicators using best pr
Ghost Entry Signal 은 고정밀 거래 진입을 위해 설계된 리페인팅 없는 추세 추적 인디케이터입니다. 이 인디케이터는 동적 모멘텀 탐지, 가격 액션 필터 및 고유의 교차 논리를 결합하여 잘못된 긍정 신호를 피하고 깨끗한 매수/매도 신호를 제공합니다. EURUSD, USDJPY, GBPUSD 에서 M1, M5, M15, M30 시간대에 최적의 성능을 보입니다.
최신 정보를 확인하세요: https://www.mql5.com/en/channels/forexnewadvisor
신호 엔진에 포함된 기능: 적응형 추세 추적: 두 개의 EMA 구조(Fast 13, Slow 21)를 사용하여 실시간으로 추세 모멘텀을 식별합니다. 모멘텀 필터: 평활화된 RSI는 50레벨 기준선을 바탕으로 방향 강도를 확인합니다. 가격 액션 검증: 신호는 캔들 구조에 의해 필터링됩니다. 거부 도깨비, 돌파 캔들 또는 세션 반전 시 발생하는 신호를 우선시합니다. 교차 논리: 노이즈와 과도한 거래를 줄이기

Special offer! https://www.mql5.com/ru/users/bossik2810 Quantum Entry is a powerful price action trading system built on one of the most popular and widely known strategies among traders: the Breakout Strategy! This indicator produces crystal clear buy and sell signals based on breakouts of key support and resistance zones. Unlike typical breakout indicators, it uses advanced calculations to accurately confirm the breakout! When a breakout occurs, you receive instant alerts. No lag and no repa

QuickPivora is a ready-made trading system for scalping. It shows when to open a deal, in which direction to open, when to close a deal. All a trader needs to do is follow the signals and instructions. QuickPivora is a comprehensive trading system that replaces many indicators on the chart, as its signals already take into account the readings of trend indicators, oscillators and channel indicators. The advantage of the QuickPivora trading system is that it is suitable for both beginners and pr

Available for MT4 and MT5 . Join the Market Structure Patterns channel to download materials available for study and/or additional informations.
Related posts: Market Structure Patterns - Introduction Market Structure Patterns is an indicator based on smart money concepts that displays SMC/ICT elements that can take your trading decisions to the next level. Take advantage of the alerts , push notifications and email messages to keep informed from when an element is fo
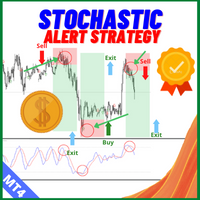
Description: For a comprehensive understanding of our indicators, we invite you to explore the entire Q&A section within this MQL5 blog post here . The Stochastic Cross Alert Indicator is a valuable technical analysis tool that helps traders with better signals for identifying potential trend reversals and momentum shifts. Designed to work seamlessly on various financial instruments, this indicator provides real-time alerts and customizable parameters, making it a versatile addition to your

** All Symbols x All Timeframes scan just by pressing scanner button ** *** Contact me to send you instruction and add you in "RSI scanner group" for sharing or seeing experiences with other users.
Introduction RSI divergence is a main technique used to determine trend reversing when it’s time to sell or buy because prices are likely to drop or pick in the charts. The RSI Divergence indicator can help you locate the top and bottom of the market. This indicator finds Regular divergence for pul

GS trendS is a trend indicator that can be used for any Forex financial instrument.
The indicator does not redraw and does not lag. Recommended timeframe H1.
It is possible to select the trend algorithm settings {Only Open, Average Open/Close, Average High/Low}
The color indicates the direction of the trend: yellow - direction can be SELL or BUY (S_B)
blue - uptrend (BUY)
red - downward trend (SELL) The indicator panel displays trend values of 5 timeframes for the current price level. The va

- 50% OFF -
Telegram group : https://t.me/+5RIceImV_OJmNDA0 MT5 version : https://www.mql5.com/en/market/product/85917?source=Site+Market+Product+Page
Master Pullback is a complete system that gives unique trading opportunities and a clear indication of the market: trend, signals as well as stop loss and take profit levels. This system has been designed to be as simple as possible and detects extreme overbought and oversold zones, support and resistance levels, as well as the major trend. You p
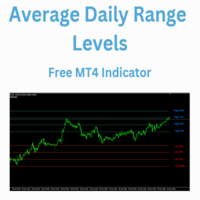
The Average Daily Range Levels indicator shows the ADR levels on the chart as if they were supports and resistances and is updated daily.
By default the indicator uses the 5-day average of the daily range. There are several strategies that suggest that these levels can be used to determine where the price can bounce and it is often said that the price can typically move 75% of the ADR.
In future versions I may add alerts at each level
Can you suggest any changes?
Greetings!
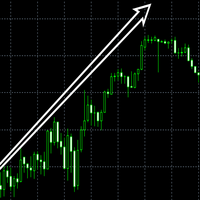
Absolute High Low indicator is a discretionary tool for assessing extremes in the price. It is very self-explanatory, and you can test against other default oscillators to see the difference. Combine with your trend following systems to master entry and exit at extremes. Back test and study the indicator to see the results up against a system or indicator. The indicator calculates a number of max bars so a gap will appear at the end, and it will restart. MT5 Version: https://www.mql5.com/en

on demo mode use date to work. indicator is no repaint trend indicator. when red stars up to line that is probably end of long trades. when blue stars up to line that is probably end of down trades. indicator can use all pairs and lower than weekly charts, to use weekly chart need to at least 500 bars data on back.and lowering processing value 500. it is also suitable for 1m charts. indicator hold long way to go. there is not too many signals.
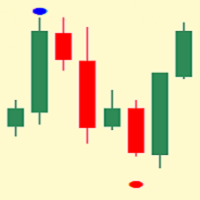
Indicator that shows two bars cluster bot and top. It will show you the forming top/bot based on the close prices. You can see the actual support and resistance.
The indicator accepts three arguments: Start bar - from which bar to start calculating Size of the dot on the chart (in font size) Distance from the top/bot Note: the indicator works on the timeframe you are currently on This indicator is very simple, does not distract you and will help you define better the trends and the channels.
S

This is based on short term strength or weakness and not on moving averages. Moving averages are used for filter only. Trade supply and demand with arrows. Supply and demand breakouts and strength of the buyers or sellers . Don't trade buy arrow to sell arrow. Trade the strength with trendlines or moving averages and use stops. The arrow can have some strong moves. Trade on all time frames. Try it out in the back tester. The pips can be made with this indicator, follow the arrows and make
The indicator measures the buying and selling force between the buyers and sellers in the form of a histogram/oscillator by using a BOP equation:
BOP = Moving Average of [close – open)/(high – low)]
Igor Levshin first introduced the Balance of power in the August 2001 issue of Technical Analysis of Stocks & Commodities magazine.
Features
Quickly find the buying and selling pressure among the traders. It comes with simple inputs and an interface. All Metatrader alerts included.
Applications

KT Momentum Arrows 인디케이터는 순간적인 돌파 신호에 기반한 도구로, 밴드의 이탈 범위와 특정 방향으로 나타나는 변동성을 계산하여 신호를 생성합니다. 이 도구는 가격의 강한 움직임이 시작되는 시점을 빠르게 감지할 수 있도록 설계되었습니다. 가격이 상단 밴드를 상향 돌파하여 마감되면 매수 신호가 생성되며, 하단 밴드를 하향 돌파하여 마감되면 매도 신호가 생성됩니다. 밴드의 이탈과 변동성에 동시에 영향을 주는 '계수' 입력값이 있으며, 이는 거래 종목 및 시간 프레임에 따라 신중하게 분석 및 선택해야 합니다.
주요 특징
재도색 없음! 모멘텀 트레이더를 위한 훌륭한 진입 도구입니다. 승률, 손익비, 평균 수익 등 성과 분석 기능 포함. 단타, 스윙, 스캘핑 모든 스타일에 적합합니다.
입력 파라미터 히스토리 바: 지표 계산에 사용할 바의 수. 모멘텀 계수: 밴드 이탈 및 변동성 측정에 사용하는 계수. 성과 분석: 수익 추세선을 포함한 성과 분석 표시 여부. 알림
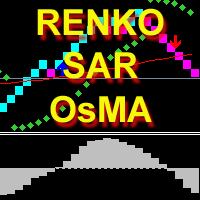
The indicator calculates and displays renko bars using Moving Average, Parabolic SAR and OsMA data as well as provides buy/sell signals. Renko is a non-trivial price display method. Instead of displaying each bar within a time interval, only the bars where the price moved a certain number of points are shown. Renko bars do not depend on a time interval, therefore the indicator works on any timeframe without losing its efficiency. The buy signal is generated when the OsMA indicator crosses the ze

Special offer! https://www.mql5.com/ru/users/bossik2810
This is a powerful system for binary options and intraday trading. The indicator neither repaints, nor changes its readings. Binary Reverse is designed to determine the points where the price reverses. The indicator fixes both reversals and roll-backs considerably expanding your analytical capabilities. It not only clearly shows correction and reversal points, but also tracks the overall trend dynamics. Trading recommendations Coincidenc

The Forex Master Pattern is an alternative form of technical analysis that provides a framework which will help you to find and follow the hidden price pattern that reveals the true intentions of financial markets. This algorithm here does a good job detecting the Phase 1 of the Forex Master Pattern cycle, which is the contraction point (or Value).
On Phase 2 we get higher timeframe activation (also called Expansion), which is where price oscillates above and below the average price defined

Gold Flux Signal – XAUUSD 전용 노리페인트 신호 지표
명확한 신호 실행을 위한 설계
– Gold Flux Signal은 XAUUSD 에서 명확하고 안정적인 진입 신호를 제공하도록 설계되었습니다. 리페인트나 백페인트 없이 작동합니다
– 트렌드 추종 및 돌파 전략에 맞게 설계되었으며, 차트를 복잡하게 만들지 않습니다
– 지표는 반드시 종가 기준(닫힌 캔들) 으로만 신호를 생성합니다
– M1, M5, H1 타임프레임에 최적화되어 있습니다
안정적인 시각적 신호
– 신호가 한 번 생성되면 고정되어 사라지지 않으며, 깜빡이거나 수정되지 않습니다
– 화살표는 차트에 직접 표시됩니다:
• 마젠타 화살표 = 매수 신호
• 시안 화살표 = 매도 신호
– 모든 화살표는 리페인트 없음 이며, 예측이 아닌 확인된 가격 행동에 기반합니다
적응형 가격 행동 기반 로직
– 신호는 다음 요소를 기반으로 생성됩니다:
• 실시간 변동성 범위 측정
• 수정된

추세선은 외환 거래에서 기술적 분석의 가장 필수적인 도구입니다. 불행히도, 대부분의 거래자는 올바르게 그리지 않습니다. 자동 추세선 표시기는 시장의 추세 움직임을 시각화하는 데 도움이 되는 진지한 거래자를 위한 전문 도구입니다.
추세선 강세 추세선과 약세 추세선에는 두 가지 유형이 있습니다.
상승 추세에서 Forex 추세선은 가격 움직임의 가장 낮은 스윙 포인트를 통해 그려집니다.
최소 두 개의 "최저 저점"을 연결하면 추세선이 생성됩니다.
하락 추세에서 추세선은 가격 움직임의 가장 높은 스윙 포인트를 통해 그려집니다.
최소 두 개의 "최고 최고점"을 연결하면 추세선이 생성됩니다.
추세선이 깨질 때?
강세 추세선은 약세 양초가 강세 추세선 아래에서 닫히고 양초의 고점이 추세선 위에 있을 때 깨집니다.
약세 추세선은 강세 양초가 약세 추세선 위로 마감되고 양초 저점이 추세선 아래에 있을 때 깨집니다.
추세선이 삭제되면?
강세 추세선은 전체 양초가 강세 추세선 아래에

Divergence and Convergence are important harbingers of reversals in stock markets.
The Divergence Sync indicator is designed to automatically search for divergences on a large number of indicators with different parameters.
The search for divergences is carried out on these indicators: (CCI, CHO, DeMarker, MACD, MFI, Momentum, OBV, OsMA, RSI, Stochastic, WPR, Awesome Oscillator ).
To search for divergences, you can use one technical indicator or search simultaneously on any number of indicator

The ZUP is based on two ideas. Idea 1 - combine a variety of methods for identifying extremums (minimums and maximums) on the market price charts in a single indicator. Idea 2 - make it possible to easily bind various graphical tools, which allow to analyze the market behavior, to the identified extremums. To implement the first idea , the following has been made in the indicator. Included multiple ZigZag algorithms. Standard ZIGZAG algorithm. The basis of this algorithm is taken from the ZigZag

The Laguerre VIX Trend Extrema (LVTE) indicator detects market tops and bottoms. As its name suggests, LVTE is a percentage price oscillator that identifies extreme ranges in market price. How to use: Buy when the indicator was in the lower "blue" range for more than 2 candles, and then moves up into grey. Sell when the indicator was in the upper "red" range, and then moves down into orange. Please see screenshots for examples! To make it simple, the indicator can show this by paint

Reversals is a trading tool designed to help traders identify potential trend reversals. Suitable for all experience levels, it provides instant alerts across multiple channels, with customizable settings . Whether you’re a scalper or swing trader, Reversal Pro can be integrated into your existing strategy.
Key Features of Reversals
Real-Time Alerts: Receive buy and sell signals directly via email, mobile, or desktop notifications. Non-Repaint Design: Once a signal is generated, it remains

Dashboard uses Ichimoku Strategy to find best trades.
Get extra Indicators/Template: And read more about detailed Product Description and usage here: https://www.mql5.com/en/blogs/post/747457
Please note: I won’t be able to add new settings. It already has 72 settings :) Some people are using it with their EAs. And iCustom function can only take Max 64 settings. So, I cannot let it grow any further.
I’ll definitely be maintaining the code and solving issues. Don’t worry. Please check all set

마를리 인디케이터: MT4 및 MT5에서의 정밀 트레이딩 MT4 및 MT5에서 뛰어난 신호 정확성을 제공하는 마를리 인디케이터로 트레이딩을 향상시키세요. 이 다재다능한 도구는 암호화폐와 외환 시장에 최적화되어 있으며, 귀하의 트레이딩 전략에 정밀함과 유연성을 제공합니다. MT5와의 원활한 통합: MT5 플랫폼 사용자를 위해, 마를리 인디케이터는 완벽하게 호환되며 여기 에서 접근할 수 있습니다. 암호화폐 및 외환 시장 최적화: 암호화폐 우수성 : 마를리 인디케이터는 동적인 암호화폐 시장에 맞춰 특별히 조정되어, 암호화폐 트레이딩을 탐색하는 데 필수적인 정확하고 시기적절한 신호를 제공합니다. 외환 친화적 기본 설정 : 외환 시장에서도 마찬가지로 효과적이며, 다양한 시장 조건에서의 다용도성과 신뢰성을 위해 조정되어 있습니다. 주요 기능: 유연한 표시 옵션 : 시각적으로 두드러지는 화살표 또는 정보가 풍부한 텍스트 라벨 중에서 선호하는 신호 표시 방법을 선택하세요. 조절 가능한 감도 :

Multicurrency and multitimeframe modification of the ZigZag indicator. Displays the current direction of the market, the height of the last movement, the number of bars in this movement and the breaking of the previous point of the ZigZag (horizontal line). This is MTF Scanner, you can actually see the supply and demand levels.
You can specify any desired currencies and timeframes in the parameters. Also, the panel can send notifications when the ZigZag changes direction or when there was a br
* All Symbols x All Timeframes scan just by pressing scanner button ** *** Contact me to send you instructions and add you in "Candle Scanner group" for sharing or seeing experiences with other users. Introduction: Candles tell their story. When looking at a candle, it’s best viewed as a contest between buyers and sellers. Candlestick patterns are used to predict the future direction of price movement. Candlesticks are an easy way to understand the price action. You can use candlesticks to decid

BUY INDICATOR AND GET EA FOR FREE AS A BONUS + SOME OTHER GIFTS! ITALO TREND INDICATOR is the best trend indicator on the market, the Indicator works on all time-frames and assets, indicator built after 7 years of experience on forex and many other markets. You know many trend indicators around the internet are not complete, does not help, and it's difficult to trade, but the Italo Trend Indicator is different , the Italo Trend Indicator shows the signal to buy or sell, to confirm the signal t
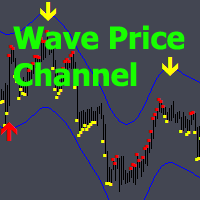
Wave Price Channel - 충동과 수정을 검색하도록 설계된 거래 분석 시스템입니다.
이 지표를 사용하면 변동성을 기반으로 구축된 가격 채널 방향으로 작업할 수 있습니다.
채널에 위쪽 또는 아래쪽 화살표가 그려지면 이 방향으로의 신호가 가격 변화에 민감한 점 표시로 확인됩니다.
같은 색의 점이 계속되는 한 신호는 계속됩니다. 화살표는 있지만 같은 색상의 점이 없으면 신호는 거짓이므로 점이 나타나면 이를 따라가야 합니다.
표시기에는 다양한 기간에 대해 변경할 수 있는 유일한 변경 가능한 매개변수인 "가격 채널 길이"가 있습니다. Time Frames M15 이상에서 사용하는 것이 좋습니다. 모든 거래 상품에 사용할 수 있습니다. 화살표에는 여러 유형의 경고가 있습니다. 작동 중에 신호 화살표를 1개의 캔들로 변경할 수 있습니다.
빨간색 위쪽 화살표가 나타나면 구매하라는 신호이고 빨간색 점은 화살표 궤적의 연속입니다. 노란색 아래쪽 화살표가 나타나면 판매하라는 신호이고 노란
MetaTrader 플랫폼 어플리케이션 스토어에서 MetaTrader 마켓에서 트레이딩 로봇을 구매하는 방법에 대해 알아 보십시오.
MQL5.community 결제 시스템은 페이팔, 은행 카드 및 인기 결제 시스템을 통한 거래를 지원합니다. 더 나은 고객 경험을 위해 구입하시기 전에 거래 로봇을 테스트하시는 것을 권장합니다.
트레이딩 기회를 놓치고 있어요:
- 무료 트레이딩 앱
- 복사용 8,000 이상의 시그널
- 금융 시장 개척을 위한 경제 뉴스
등록
로그인
계정이 없으시면, 가입하십시오
MQL5.com 웹사이트에 로그인을 하기 위해 쿠키를 허용하십시오.
브라우저에서 필요한 설정을 활성화하시지 않으면, 로그인할 수 없습니다.