MetaTrader 4용 유료 기술 지표 - 7
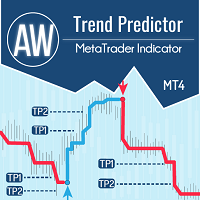
하나의 시스템에서 추세와 고장 수준의 조합입니다. 고급 지표 알고리즘은 시장 노이즈를 필터링하고 추세, 진입점 및 가능한 출구 수준을 결정합니다. 표시기 신호는 통계 모듈에 기록되어 가장 적합한 도구를 선택하여 신호 기록의 효율성을 보여줍니다. 이 표시기는 이익 실현 및 손절매 표시를 계산합니다. 매뉴얼 및 설명 -> 여기 / MT5 버전 -> 여기 지표로 거래하는 방법: Trend Predictor로 거래하는 것은 3단계로 간단합니다. 1단계 - 포지션 열기 70% 이상의 성공률로 매수 신호를 받았습니다. 2단계 - StopLoss 결정 반대 신호로 트렁크 선택 3단계 - 이익 실현 전략 정의 전략 1: TP1 도달 시 전체 포지션 청산 전략 2: TP1 도달 시 포지션의 50% 청산 및 TP2 도달 시 나머지 50% 청산 전략 3: 추세 반전 시 전체 포지션 청산 이익: 결과를 다시 그리지 않음, 신호는 엄격하게 양초가 닫힐 때 어드바이저에서 사용할 수 있습니다. 이
The MarketPrice Indicator is designed to provide a quick, one-glance visualization of the trend direction for a currency pair across all time frames (Time Frames), streamlining decision-making. MarketPrice Indicator is based on daily levels and trading signals derived from moving average crossovers and market strength according to various technical indicators. It comes fully configured, though you can, of course, modify any parameters as desired. Indicator Logic The indicator uses a combination

Vondereich MTF Strength Indicator Description: Overview: The Vondereich MTF Strength Indicator is a powerful yet user-friendly multi-timeframe analysis tool designed to simplify market insights for traders of all experience levels. By evaluating currency pairs across various timeframes using a combination of technical indicators such as the Stochastic Oscillator, Relative Strength Index (RSI), Exponential Moving Average (EMA), and Average True Range (ATR), this indicator delivers clear buy, sell

KDJ Index 4 交易实用必备工具指标 波浪自动计算指标,通道趋势交易 完美的趋势-波浪自动计算通道计算 , MT4版本 完美的趋势-波浪自动计算通道计算 , MT5版本 本地跟单复制交易 Easy And Fast Copy , MT4版本 Easy And Fast Copy , MT5版本 本地跟单复制交易 模拟试用 Easy And Fast Copy , MT4 模拟账号运行 Easy And Fast Copy , MT5 模拟账号运行 "Cooperative QQ:556024 " "Cooperation wechat:556024" "Cooperative email:556024@qq.com" 强烈推荐趋势指标, 波浪的标准自动计算 和 波浪的标准自动计算MT5版本
KDJ指标又叫 随机指标 ,是一种相当新颖、实用的技术分析指标,它起先用于期货市场的分析,后被广泛用于股市的中短期趋势分析,是期货和股票市场上最常用的技术分析工具。 随机指标KDJ一般是用于股票分析的统计体系,根据统计学原理,通过一个特定的周期(常为9日、9周等)
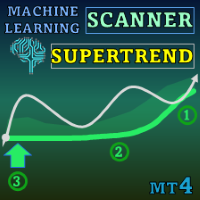
Special offer : ALL TOOLS , just $35 each! New tools will be $30 for the first week or the first 3 purchases ! Trading Tools Channel on MQL5 : Join my MQL5 channel to update the latest news from me 시장 변화에 원활하게 적응하도록 설계된 첨단 지표 Machine Learning Adaptive SuperTrend 로 고급 머신러닝의 강력한 기능을 활용해 보세요. k-평균 군집화를 SuperTrend 방법론과 결합하여, 이 지표는 정확한 트렌드 식별과 변동성 평가를 가능하게 하며, 역동적인 시장에서 트레이더에게 소중한 이점을 제공합니다. MT5 버전 더 보기: Machine Learning Adaptive SuperTrend MT5 다른 제품 보기: 모든 제품 머신러닝과 적응형 SuperTrend의 정밀
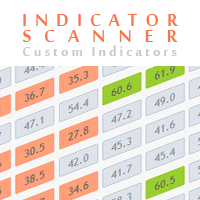
Advanced Indicator Scanner is a multi-symbol multi-timeframe scanner that works with hundreds of custom indicators available across the web including mql5 website market and codebase indicators.
Advanced Indicator Scanner features:
Scans your indicator in 28 customizable instruments and 9 timeframes. Monitors up to 2 lines(buffers) of an indicator. Showing of indicator value on buttons. You can choose between 3 alert modes: Single symbol and timeframe Multiple timeframes of a symbol Multiple

프리시전 트레이딩 시스템의 로저 메드칼프에 의한 프리시전 인덱스 오실레이터 (Pi-Osc)
버전 2는 차트에 신속하게 로드되도록 주의 깊게 다시 코딩되었으며 경험을 향상시키기 위해 몇 가지 다른 기술적 개선 사항이 통합되었습니다.
Pi-Osc는 정확한 거래 타이밍 신호를 제공하도록 개발되었으며 시장이 모든 사람의 스톱을 청산하기 위해 가야 하는 극도의 고갈 지점을 찾는 데 목적이 있습니다.
이 제품은 극단적인 지점이 어디에 있는지 알고 있는 고전적인 문제를 해결하며 트레이더로서의 삶을 훨씬 간단하게 만듭니다.
이것은 업계 표준 오실레이터와는 상당히 다른 강력한 차이점을 가지고 있는 고도로 복잡한 합의 지표입니다.
사용하는 기능 중 일부는 수요 지수, 자금 흐름, RSI, 스토캐스틱, 패턴 인식, 거래량 분석, 표준 편차 극단점 및 다양한 길이에서 위와 유사한 변형을 갖습니다.
미숙한 눈에는 다른 오실레이터와 비슷해 보일 수 있지만 RSI 또는 모멘텀과 같은 다른 오실레이

True Choppiness Direction determines if the market is choppy (trading sideways) or if it is trending, as well as the trend direction and strength (green=up, red=down, grey=no trend) . The underlying algorithm is designed to detect trend movements even in the presence of noisy market data, please see screenshots. Trend strength is indicated by taller or shorter red/green fill. Choppiness index is range-bound between -50 (very trendy) and +50 (very choppy). This is a custom algorithm designed by u
G-Labs Market Maker Dashboard - Exclusive Seasonal Offer Elevate your trading with the original G-Labs Market Maker Dashboard, available for a limited time at just $70 USD. Ideal for starter traders, this dashboard has been enhanced with new features and now includes a comprehensive training video. This indicator is for people trading the market makers method and is the entry level dashboard for that strategy is available for both mt4 and mt5. its a market scanner in real time showing peak

Special offer! https://www.mql5.com/ru/users/bossik2810
Smart Level Pro is a very powerful indicator based on the concept of order blocks and set entries with the right fvg and breakouts to create a very good entry level like a professional trader. Very easy to use interface and easy to enter on buy and sell signals. The indicator does not repaint and does not change its data! Works best on M5-M15 timeframe for gold, bitcoin and currency pairs. 4-5 deals daily for each pair. Trading with this

Please send me Direct message on MQL5 CHAT after purchasing the Indicator for Training and Installation Support There are some additional files that is important to use with the Indicator . So be sure to contact me after purchasing the Indicator So that I can add you for training and support .
If you find any difficulty with installation then send me Direct message here So that I can connect with you via Anydesk or Teamview for the product installation. " Smart Order Block Indicator " to find m
이 강력한 도구는 자동으로 추세 라인을 식별하여 거래 전략을 간소화하고보다 정보에 근거한 결정을 내릴 수 있도록 도와줍니다. MT5 버전
주요 기능 자동 추세 라인 감지 : "기본 추세선"표시기는 잠재적 인 추세 라인에 대한 시장을 스캔하고 차트에 즉시 표시합니다.이것은 귀중한 시간을 절약하고 중요한 트렌드를 놓치지 않도록합니다. 사용자 친화적 인 패널 : 우리의 지표에는 다양한 트렌드 라인을 쉽게 그릴 수있는 아름답고 직관적 인 패널이 제공됩니다.이 패널은 모든 경험 수준의 거래자를 위해 설계되어 몇 번의 클릭만으로 추세선을 추가, 편집 또는 제거 할 수 있습니다. 좋아하는 트렌드 라인을 저장하고 관리하십시오. : 가장 중요한 트렌드 라인을 추적하십시오.우리의 지표는 선호하는 추세선을 저장하여 차트를 다시 방문 할 때마다 항상 사용할 수 있도록합니다. 다목적 응용 프로그램 : 당신이 외환, 주식 또는 암호 화폐 거래에 관계없이 "기본 추세선"지표는 다양한 시장에 적응하여 거래 전
이것은 바이너리 옵션 거래를 위한 신호 지표입니다. 신호는 현재 촛불이 열릴 때 발생하며 닫힐 때까지 유효합니다. 신호는 차트에서 바로 화살표와 신호 메시지를 동반합니다. 권장 옵션 만기 시간은 캔들 1개입니다. 즉, 차트가 H1이면 만료 시간은 1시간이 됩니다. 차트가 M5인 경우 옵션 만료 시간은 5분이 됩니다. 그러나 실제로 원하는 대로 신호를 자유롭게 사용할 수 있으며 원하는 경우 자신의 거래 규칙을 자유롭게 따를 수 있습니다. 필터 역할을 하는 다른 지표와 함께 이 지표를 사용하는 것이 좋습니다. 나는 모든 구매자에게 두 번째 지표를 절대적으로 무료로 제공합니다. 또한 지표를 사용하여 최상의 결과를 얻는 방법에 대한 권장 사항을 공유할 것입니다. 이 시스템은 바이너리 옵션 거래자와 외환 거래자 모두에게 적합합니다. 구매 후 메일 주세요! 추가 지표를 무료로 보내드립니다! 또한 이 시스템과의 거래에 대한 권장 사항을 공유할 것입니다.
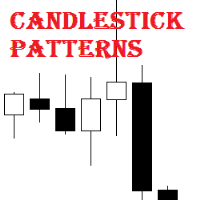
Candlestick Patterns MT4 is a simple and convenient indicator able to define 29 candle patterns.
Advantages Defines and highlights 29 candle patterns; Estimated trading direction is shown as an arrow; Each candlestick pattern can be disabled in the settings; The indicator can be used as an arrow indicator in EAs.
Parameters TextSize - chart text size; TextColor - chart text color; Alert - enable/disable alerts; ---------- Candlestick Patterns ------------- - settings separator; AdvanceBlock ;
Special offer : ALL TOOLS , just $35 each! New tools will be $30 for the first week or the first 3 purchases ! Trading Tools Channel on MQL5 : Join my MQL5 channel to update the latest news from me Supply Demand Retest and Break Multi Timeframe , 이 도구는 강한 모멘텀 캔들에 기반하여 공급 및 수요 영역을 그리며, timeframe selector 기능을 사용하여 여러 시간대에서 이러한 영역을 식별할 수 있게 합니다. 재테스트 및 브레이크 라벨과 맞춤형 검증 및 스타일링 옵션을 통해 이 도구는 효과적인 거래 분석을 지원합니다. MT5 버전 자세히 보기: Supply Demand Retest and Break MT5 Multi Timeframe 더 많은 제품

Scalping Indicator Pro is a powerful indicator that works in trend as well as non trending market conditions. This indicator is perfect for scalp trades as well as swing trades. Scalping Indicator Pro is not just an indicator, but a trading strategy itself. It doesn't requires any additional indicators for the trading setup.
Check out the indicator in action. [Video demonstration below]
Why use Scalping Indicator Pro? Great for novice traders as well as experienced traders. Low risk entries.
This is Multiple Timeframe of Malaysia SNR Levels and Storyline. The single timeframe version here Features: + Display level on multiple timeframe (higher or lower) + Turn on/off level on timeframe + Alert when price touch level 1. if high > resistance level but close of candle < resistance level , this level become unfresh - Name of level will have "(m)" meaning mitigated if close of candle > resistance level , this level become invalid and can be removed in chart (there is setting for keep

Universal Swing Arrows 는 스윙 거래 신호를 제공하도록 설계된 화살표 기반 지표입니다. 모든 거래 쌍 및 거래 시간 프레임에 사용할 수 있습니다. 화살표는 현재 (0) 캔들에 나타납니다. 신호는 다시 칠하지 마십시오! 지표는 독립형 거래 시스템 또는 개인 거래 전략의 일부로 사용할 수 있습니다. 표시기의 화살표는 신호일 뿐만 아니라 가능한 손절매 수준이기도 합니다. 표시기는 최적의 손절매 수준을 자동으로 계산하고 손절매가 있어야 하는 지점에 정확히 화살표를 그립니다. 그것은 잘못된 손절매 트리거링을 피하기 위해 가격에 약간의 공간을 제공하는 보호 유형의 손절매를 사용합니다. 구매 후 연락주세요. 내 거래 권장 사항을 귀하와 공유하고 무료로 훌륭한 보너스 지표를 제공합니다! 나는 당신에게 행복하고 유익한 거래를 기원합니다!

MetaForecast는 가격 데이터의 조화를 기반으로 모든 시장의 미래를 예측하고 시각화합니다. 시장이 항상 예측 가능한 것은 아니지만 가격에 패턴이 있다면 MetaForecast는 가능한 정확하게 미래를 예측할 수 있습니다. 다른 유사한 제품과 비교했을 때, MetaForecast는 시장 동향을 분석하여 더 정확한 결과를 생성할 수 있습니다.
입력 매개변수 Past size (과거 크기) MetaForecast가 미래 예측을 생성하기 위한 모델을 만드는 데 사용하는 막대의 수를 지정합니다. 모델은 선택한 막대 위에 그려진 노란색 선으로 표시됩니다. Future size (미래 크기) 예측해야 할 미래 막대의 수를 지정합니다. 예측된 미래는 핑크색 선으로 표시되며 그 위에 파란색 회귀선이 그려집니다. Degree (차수) 이 입력은 MetaForecast가 시장에서 수행할 분석 수준을 결정합니다. Degree 설명 0 차수 0의 경우, "Past size" 입력에 모든 봉우리와

또는 (TDO) "순수 모멘텀 "의 원리를 사용하여 가격 변화율을 측정하는 지수입니다.
유가 증권 가격이 10에서 15로 상승하면 가격 변동률은 150%이지만 15에서 10으로 다시 하락하면 가격 변동률은 33.3%에 불과합니다. 이것이 "가격 변화율"(ROC) 또는 "모멘텀"과 같은 기술적 분석 지표가 내림차순에 제공된 것보다 상승하는 가격 움직임에 대해 더 높은 수치를 제공하는 이유입니다. TDO는 트레이더가 모멘텀을 올바르게 읽을 수 있도록 이 문제를 수정합니다.
중요한 정보
TDO 사용자 매뉴얼: https://www.mql5.com/en/blogs/post/717970 TDO FAQ : https://www.mql5.com/en/blogs/post/722015 TDO 비디오 라이브러리: https://www.mql5.com/en/blogs/post/722018 TDO 전문가 고문 예: https://www.mql5.com/en/blogs/post/731141
TDO

외환 거래자로서 기술 분석에서 피보나치 거래 전략의 가치를 이해합니다. 그러나 수동으로 피보나치 수준을 그리고 조정하는 것은 시간이 많이 걸릴 수 있습니다. 여기에서 Fibonacci Of Yesterday Ultimate 지표가 등장합니다. 전일의 가격 조치를 기반으로 하는 피보나치 전략을 사용하는 트레이더를 위해 특별히 설계되어 시간과 노력을 절약할 수 있습니다. 이 혁신적인 지표는 피보나치 수준을 기반으로 진입, 손실 중지 및 이익 실현 수준을 자동으로 식별합니다. 또한 기본 설정에 맞게 쉽게 사용자 지정할 수 있는 사용자 친화적인 피보나치 도구가 포함되어 있습니다. 이를 차별화하는 것은 차트에서 실제 추세 채널을 식별하는 기능으로 반전, 되돌림 및 추세 기회를 쉽게 찾을 수 있도록 도와줍니다. Fibonacci Of Yesterday Ultimate 지표를 사용하는 것은 간단합니다. 주요 보도 자료를 기다렸다가 추세를 파악하고 그에 따라 피보나치 수준을 그립니다
스페셜 오퍼 : ALL TOOLS , 각 $35 에 구매 가능! New tools will be $30 for the first week or the first 3 purchases ! Trading Tools Channel on MQL5 : Join my MQL5 channel to update the latest news from me 변동성이 큰 트레이딩 환경에서 강력하고 직관적인 분석 도구는 신속하게 기회를 포착하는 데 도움이 됩니다. Fibonacci Trend Scanner는 전통적인 피보나치(Fibonacci) 지표 기능과 SuperTrend를 통합할 뿐만 아니라, 통화쌍 스캔, 멀티 타임프레임 모니터링, 그리고 추세가 상승세에서 하락세로(또는 반대로) 전환될 때 인텔리전트 알림을 제공하도록 기능을 확장하였습니다. See more MT5 version at: Fibonacci Trend MT5 Scanner See more products a

This indicator presents an alternative approach to identify Market Structure. The logic used is derived from learning material created by DaveTeaches (on X) Upgrade v1.10: add option to put protected high/low value to buffer (figure 11, 12)
When quantifying Market Structure, it is common to use fractal highs and lows to identify "significant" swing pivots. When price closes through these pivots, we may identify a Market Structure Shift (MSS) for reversals or a Break of Structure (BOS) for co

트렌드 오실레이터: 부드럽고 신뢰할 수 있는 시장 트렌드 식별 트렌드 오실레이터는 트레이더가 트렌드 방향과 잠재적 반전 포인트를 정확하게 식별하는 데 도움을 주기 위해 설계된 MT4의 고급 지표입니다. 직관적인 시각적 표현을 통해 시장이 상승 추세인지 하락 추세인지를 명확하게 보여주어 분석을 단순화하고 차트 가독성을 높입니다. 다양한 시장 및 시간 프레임에 적합하여 여러 트레이딩 요구에 유연하게 대응할 수 있습니다. 트렌드 오실레이터의 주요 특징과 장점 단순화된 트렌드 시각화 : 트렌드 오실레이터는 라인의 색상을 변경하여 트렌드 움직임을 그래픽으로 나타냅니다. 파란색은 상승 추세를, 노란색은 하락 추세를 나타내어 트렌드를 즉시 명확하게 파악할 수 있습니다. 신뢰할 수 있는 반전 신호 : 고급 알고리즘을 통해 지표는 잠재적인 반전 포인트를 나타내는 색상의 화살표를 생성합니다. 녹색 화살표는 매수 포인트를, 빨간색 화살표는 매도 포인트를 나타내어 트레이더가 진입 또는 청산을 평가할 수
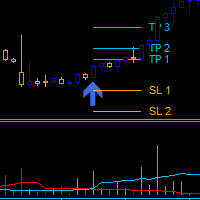
Dark Power is an Indicator for intraday trading. This Indicator is based on Trend Following strategy, also adopting the use of an histogram to determine the right power . We can enter in good price with this Indicator, in order to follow the strong trend on the current instrument. The histogram is calculated based on the size of the bars and two moving averages calculated on the histogram determine the direction of the signal
Key benefits
Easily visible take profit/stop loss lines Intui
이 표시기는 지정된 계수를 기반으로 낮은,높은,극단적 인 볼륨을 찾아 지정된 색상으로 페인트합니다. 그것은 메타 트레이더 터미널의 표준 볼륨 그리기 기능을 대체합니다. 양초는 또한 볼륨의 색상으로 착색 될 수 있습니다. 극단적 인 볼륨을 가진 촛대에서는 최대 수평 볼륨(클러스터/포치)이 결정됩니다. 위치(밀기,중립,정지)에 따라 클러스터는 자체 색상을 갖습니다. 클러스터가 그림자에,그리고 촛불 극단적 인 볼륨을 가지고 있다면,우리는 반전에 대한 화살표를 얻을. 당신은 설정에서 경고를 활성화 할 수 있습니다. 또한 표시기에는 클러스터를 그림자로 표시하는 별도의 옵션이 있습니다.
입력 매개 변수. (색상 및 시각적 설정과 관련된 일부는 건너 뜁니다).
기본 설정. Bars Count – 표시기가 작동하는 기록 막대의 수. Data Source - 견적 기간 선택. 이 응용 프로그램은 당신이 당신의 자신의 음악을 만들 수 있습니다. Vertical Step - 밀도 및 수직 정확도에

Capture every opportunity: your go-to indicator for profitable trend trading Trend Trading is an indicator designed to profit as much as possible from trends taking place in the market, by timing pullbacks and breakouts. It finds trading opportunities by analyzing what the price is doing during established trends. [ Installation Guide | Update Guide | Troubleshooting | FAQ | All Products ]
Trade financial markets with confidence and efficiency Profit from established trends without getting whip

Binary Chronos – MT4용 바이너리 옵션 지표 버퍼 신호 : 화살표로 진입이 쉬우며 자동 매매 EA도 사용 가능. ️ 만료 시간 : 기본값 — 1개의 캔들. 트렌드 기반 전략 : 추세 방향을 감지하고 최적의 진입점을 제시. 현재 캔들에 진입 : 즉시 진입 신호 제공. ️ 마틴게일 : 첫 거래 실패 시 다음 캔들에 한 번만 마틴게일 사용 . LevelEn : 값이 높을수록 신호 품질과 정확도가 향상됩니다. 모든 시간대 지원 . 리페인트 없음 : 안정적이고 신뢰성 있는 신호. 알림 제공 : 팝업 및 소리 알림. Binary Chronos — 리스크를 줄인 정확한 트렌드 진입 지표!
***************************************************************************

소개 Quantum Heiken Ashi PRO 차트 시장 동향에 대한 명확한 통찰력을 제공하도록 설계된 Heiken Ashi 양초는 노이즈를 필터링하고 잘못된 신호를 제거하는 기능으로 유명합니다. 혼란스러운 가격 변동에 작별을 고하고 더 매끄럽고 신뢰할 수 있는 차트 표현을 만나보세요. Quantum Heiken Ashi PRO를 정말 독특하게 만드는 것은 전통적인 촛대 데이터를 읽기 쉬운 색상 막대로 변환하는 혁신적인 공식입니다. 빨간색과 녹색 막대는 각각 약세와 강세 추세를 우아하게 강조하여 잠재적 진입점과 퇴장점을 매우 정확하게 파악할 수 있습니다.
Quantum EA 채널: 여기를 클릭하세요
MT5 버전: 여기를 클릭하세요
이 놀라운 지표는 다음과 같은 몇 가지 주요 이점을 제공합니다. 선명도 향상: Heiken Ashi 바는 가격 변동을 완화하여 시장 추세를 보다 명확하게 나타내므로 유리한 거래 기회를 쉽게 식별할 수 있습니다.

현재 20% 할인!
초보자 또는 전문가 상인을위한 최상의 솔루션!
이 지표는 새로운 공식과 함께 여러 독점적 인 기능을 통합했기 때문에 저렴한 거래 도구입니다.
고급 누적 통화 볼륨 표시기는 메인 28 외환 쌍에 특화되어 있으며 모든 시간 프레임에서 작동합니다. 단일 차트에서 AUD, CAD, CHF, EUR, GBP, JPY, NZD 및 USD의 모든 통화 볼륨 (C-Volume)을 추출하는 새로운 공식입니다. 이것은 거래에서 큰 이점입니다. 볼륨 트레이더는 사용 방법을 알게 될 것입니다. 당신이 새로운 경우, 극단적 인 값을 읽고 거래 무기고에 추가하는 방법을 배우십시오.
C- 볼륨을 총이 아니라 방패로 생각하십시오.
기본 차트에 경고 표시가 표시됩니다.
이것은 일반적으로 사용되는 단순한 쌍의 부피가 아닙니다. 외환 시장은 스캔되며 각 통화에 대한 볼륨은 추출되어 C- 볼륨으로 축적됩니다. 이제 어떤 통화가 가장 높거나 가장 낮은 볼륨을 확인할 수 있습니다. 우리는

Trade Invest Pro - Boss in the world of cryptocurrency!
This indicator is ideal for cryptocurrency trading!
Work on Trade Invest Pro took us half a year!
But not in vain! Now only accurate signals near support - resistance levels!
He showed himself well on timeframes m5 m15 for binary options!
Optionally, it can be configured for forex for timeframes m30 and more!
Reacts well to news!
Doesn't paint! and does not disappear from the schedule!
As soon as a red arrow appears, open a deal fo

The Volume Spread Analysis indicator is based on the original Volume Spread Analysis method. It was designed for quick and easy recognition of VSA patterns. Even though this indicator looks very simple, it is the most sophisticated tool we've ever made. It is a really powerful analytical tool that generates very reliable trading signals. Because it is very user-friendly and understandable, it is suitable for every type of trader, regardless of his experience.
What is VSA? VSA - Volume Spre

Did You Have A Profitable Trade But Suddenly Reversed? Exiting a trade is equally important as entering! Exit Scope helps maximize your current trade profit and avoid turning winning trades to losers.
Attention Exit Signals are NOT to be used in entering a trade! Exit means closing your trades to avoid correction/reversal which can wipe out existing profit or haunt break-even orders. Please watch presentation (Click Here)
Features Generates instant exit signals based on price action, volatili
KT Candlestick Patterns는 실시간으로 24가지 가장 신뢰할 수 있는 일본 캔들 패턴을 찾아 차트에 표시합니다. 일본 트레이더들은 18세기부터 이러한 패턴을 사용해 가격 방향을 예측해왔습니다. 모든 캔들 패턴이 동일한 신뢰도를 가지는 것은 아니지만, 지지/저항 같은 다른 기술적 분석과 결합하면 시장 상황을 명확하게 보여줍니다.
이 지표는 Steve Nison의 책 "Japanese Candlestick Charting Techniques"에 소개된 많은 패턴을 포함하고 있습니다. 책에서 다루지 않는 복잡한 패턴들도 감지할 수 있어 더욱 강력한 기능을 제공합니다.
기능
각 신호에서 고정된 핍 수익을 목표로 설정하면, 지표가 해당 목표에 대한 성공률을 실시간으로 계산합니다. 일본의 유명한 24가지 캔들 패턴을 높은 정확도로 식별합니다. 각 패턴의 성능을 분석하고 정확도를 실시간으로 보여주는 모듈이 내장되어 있습니다. 패턴 간 최소 바 수를 설정할 수 있어 차트를 깔
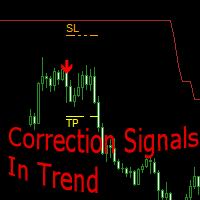
Correction Signals In Trend - 시장 역학을 분석하고, 트레이더가 추세의 방향을 결정하고 주문을 시작할 시점을 찾는 데 도움이 되는 기술 지표입니다.
지지선과 저항선 형태의 추세 추종 지표는 상승 또는 하락 추세를 보여줍니다.
추세 방향에서는 수정이 끝난 후 신호를 검색합니다. 화살표는 거래가 이루어질 수 있는 잠재적인 순간을 나타냅니다.
각 신호에 대해 권장되는 SL 및 TP 설정이 표시됩니다.
표시기 기능
신호 화살표는 현재 캔들에 나타나며 다시 그려지지 않습니다. 신호가 발생하면 여러 유형의 알림을 받을 수 있습니다. 추세 방향으로 작동합니다. 이는 보편적이며 모든 거래 수단 및 시간 범위에 적용될 수 있습니다. SL과 TP 수준 매개변수는 시장 상황에 따라 자동으로 계산됩니다. 스캘핑을 포함한 단기 거래에 적합합니다. 해당 지표의 작동에 대한 시각적 설명이 스크린샷에 나와 있습니다.
입력 매개변수 설정
Trend line length - 지지선

또는 M oving verage S upport를 R의 esistance 밴드.
MASR 밴드 표시기는 지지 및 저항 수준으로 함께 작동하는 두 밴드로 둘러싸인 이동 평균입니다. 통계적으로 MASR 밴드는 시간의 93%에 가격 캔들을 포함합니다. 단계별로 계산하는 방법은 다음과 같습니다. 1. 첫 번째 단계는 X 기간 동안 최고 고가(HHV)와 최저 저가(LLV)를 계산하는 것입니다.
2. 두 번째 단계는 HHV를 LLV로 나누어 그들 사이의 거리가 얼마나 넓은지 백분율로 구하는 것입니다. 나는 이 단계의 결과를 MASR Filter라고 부른다.
3. MASR 필터 = 합계((HHV / LLV)-1) / 막대 수
4. 나는 이동 평균 저항의 지름길인 상위 밴드를 MAR이라고 부릅니다. 저는 이동 평균 지원의 지름길인 하단 밴드 MAS라고 부릅니다. 밴드 사이의 이동 평균을 중앙선이라고 합니다.
5. MAR = MASR 센터 + (75% x MASR 필터 x MASR 센터

Quarterly Cycles
Quarterly Cycles is based on the Quarterly Theory developed by Daye ( traderdaye on X ) T his is an aid to the user to find Cycles and it is NOT automatic detected, user can select AMDX or XAMD in each Cycle and it will be visually draw on the chart. Quarterly Cycles: Yearly, Monthly, Weekly, Daily, 6 Hour (90 minutes)
Yearly Cycle: The year is divided in four sections of three months each Q1 - January, February, March Q2 - April, May, June Q3 - July, August, September Q4 -

Bitcoin Predictor는 가격 반전을 예측하도록 설계된 화살표 기반 지표입니다. 이 도구는 BTC 및 기타 암호화폐와 함께 사용할 수 있습니다. 화폐로도 사용할 수 있습니다. 그러나 먼저 어떤 쌍이 가장 잘 작동하는지 확인해야 합니다. 일부 쌍과 시간 프레임은 정말 훌륭하게 작동할 수 있습니다. 직접 테스트하고 볼 수 있습니다. 표시기는 사용하기가 매우 쉽습니다. 화살표를 따라가기만 하면 됩니다. 표시기는 독립 실행형 시스템으로 작동하거나 이미 사용 중인 시스템의 일부일 수 있습니다. 표시기는 모든 암호화 통화와 함께 쉽게 사용할 수 있습니다. 또한 사용 중인 시간 프레임 및 쌍에 신호를 적용할 수 있습니다. 표시기에서 사용 가능한 하나의 입력 매개변수만 조정하면 됩니다. 정말 쉬워요. 신호를 다시 칠하지 마십시오! 구매 후 연락주세요! 내 거래 권장 사항 및 보너스를 공유하겠습니다!
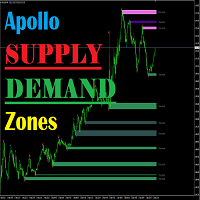
Apollo 공급 수요 구역은 지지와 저항 수준을 계산하는 지표입니다. 지표는 사용하는 전략에 관계없이 절대적으로 모든 거래자에게 유용합니다. 이 지표는 거래 시스템의 주요 요소 중 하나가 될 수 있습니다. 표시기는 현재 시간 프레임의 레벨을 모두 계산하고 MTF 모드에서 작동하여 더 높은 시간 프레임의 레벨을 표시합니다. 이 지표는 모든 시간 프레임 및 모든 거래 수단에 절대적으로 사용할 수 있습니다. 표시기는 다양한 유형의 수준을 보여주며 실제로 시장의 그림을 표시합니다. 표시기는 소리 경고를 제공하므로 이 표시기로 작업하는 것이 매우 편리합니다. 구매 후 반드시 저에게 편지를 써주세요! 지표 사용에 대한 권장 사항을 알려 드리겠습니다. 당신을 기다리고있는 큰 보너스도 있습니다! 성공적인 거래를 기원합니다!

ICT Silver Bullet
If you are searching for a reliable indicator to trade the ICT Silver Bullet concept, or ICT concepts, Smart Money Concepts, or SMC, this indicator will respond to your need! This indicator will help you identify the following: FVG - fair value gaps Market structure: BOS and CHOCH. It is based on ZIGZAG as it is the most subjective way to do it. ICT Silver Bullet windows and related notifications when it starts and when an FVG appears Swing High and low that are potential bu

Important!! ZO Trend can't work on MN timeframe. /*--------------------------------------------------------------------------------------------------------------------------------------------------------------------------------------------- ZO Trend an indicator used to search for entry point. With the session candle algorithm on many timeframe, ZO Trend creates an area for traders find good Entry Point. ZO SYSTEM BASIC SETUP : https://www.youtube.com/watch?v=qdNOXHWozNw ZO TREND User guide :

MT5 Version
Gaussian Channel MT4 Gaussian Channel MT4 is the first indicator in the market that uses Ehlers Gaussian Filter methods to define trends. Nowadays, this Gaussian Channel is highly known as a method to support HOLD techniques in crypto. If the price is above the channel the trend is strong, if it comes back to the channel this can react as a resistance and indicate the beginning of a bear market (or Winter) if the price breaks below it. Eventhough the use of this channel focuses on h

Multicurrency and multitimeframe indicator of the Standard Deviation Channel. Displays the current direction of the market. On the panel, you can see breakouts and touches (by price) of the levels of the linear regression channel. In the parameters, you can specify any desired currencies and timeframes. Also, the indicator can send notifications when levels are touched. By clicking on a cell, this symbol and period will be opened. This is MTF Scanner. The key to hide the dashboard from the char

지진계 Marketquake Detector. Description in English :
https://www.mql5.com/en/market/product/113869?source=Site+Market+Product+Page#description How to use the Seismograph :
https://www.mql5.com/en/market/product/113869#!tab=comments&page=2&comment=52806941
Create an EA :
https://www.mql5.com/en/market/product/113869#!tab=comments&page=3&comment=52816509
어떤 방식으로 거래하든 유동성이 낮은 시장에 진입하는 것을 피하고 싶을 것입니다.- 지진계는 시장 랠리 전에 시장에 진입할 수 있는 적절한 시기를 도와줄 것입니다. 그러나 바쁠 시장 시간에 진입을 확인했음에도 불구하고 많은 사람들이 유동성이 부족한 시
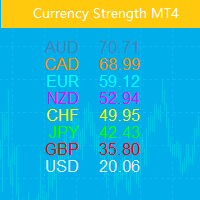
이 지표는 8개 주요 통화(USD, EUR, GBP, AUD, NZD, CAD, CHF, JPY)의 상대적 강세를 보여줍니다. 힘 값은 0~100 범위에서 정규화됩니다. 60 이상의 값은 강함을 의미합니다. 40 미만의 수치는 약점을 나타냅니다.
기본 원리 USD,EUR,GBP,AUD,NZD,CAD,CHF,JPY의 8개 통화가 주어지고 각 통화 쌍을 결합하여 총 28개 통화 쌍이 생성되며 역알고리즘을 사용하여 8개 통화의 강도를 추출합니다. 이 28쌍 중에서 EURUSD,GBPUSD,AUDUSD,NZDUSD, USDCAD,USDCHF,USDJPY,EURGBP, EURAUD,EURNZD,EURCAD,EURCHF, EURJPY,GBPAUD,GBPNZD,GBPCAD, GBPCHF,GBPJPY,AUDNZD,AUDCAD, AUDCHF,AUDJPY,NZDCAD,NZDCHF, NZDJPY,CADCHF,CADJPY,CHFJPY 주요 용도 강도 값이 60 이상이면 강함을 의미하고, 40 미만은 약

Unlock key market insights with automated support and resistance lines Tired of plotting support and resistance lines? This is a multi-timeframe indicator that detects and plots supports and resistance lines in the chart with the same precision as a human eye would. As price levels are tested over time and its importance increases, the lines become thicker and darker, making price leves easy to glance and evaluate. [ Installation Guide | Update Guide | Troubleshooting | FAQ | All Products ] Boos
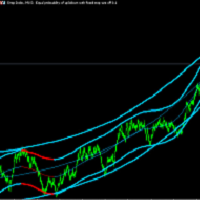
This indicator obeys the popular maxim that: "THE TREND IS YOUR FRIEND" It paints a Blue line for BUY and also paints a RED line for SELL. (you can change the colors). It gives alarms and alerts of all kinds. can be used for all currency pairs and timeframes. Yes, as easy and simple as that. Even a newbie can use it to make great and reliable trades. MetaTrader 5 version
GANN의 정확한 목표는 그의 오랜 방법론에 따라 계산되어 눈앞에 제시됩니다. 이 도구는 거래를 더욱 쉽고 직관적으로 만들어줍니다. 흰 선을 위로 또는 녹색 선을 아래로 움직이면 GANN의 기법이 여전히 거래 세계에서 영향력 있는 이유를 즉시 알 수 있습니다. GANN의 전략은 시장 움직임을 높은 정확도로 예측하는 데 중점을 두며, 이 도구는 그 힘을 여러분의 손끝에 전달합니다. 숙련된 트레이더든 초보자든, 선을 조작하면 그의 접근 방식이 왜 오랜 세월 동안 신뢰받았는지 깊이 이해할 수 있게 될 것입니다. GANN의 정확한 목표는 그의 오랜 방법론에 따라 계산되어 눈앞에 제시됩니다. 이 도구는 거래를 더욱 쉽고 직관적으로 만들어줍니다. 흰 선을 위로 또는 녹색 선을 아래로 움직이면 GANN의 기법이 여전히 거래 세계에서 영향력 있는 이유를 즉시 알 수 있습니다. GANN의 전략은 시장 움직임을 높은 정확도로 예측하는 데 중점을 두며, 이 도구는 그 힘을 여러분의 손끝에 전달합니다.

Gann 이론에 기반한 교정 구역의 수동 구성을 위한 지표입니다. 이러한 구역은 M1에서 시작하여 D1로 끝나는 다양한 시간대에 대한 특수 계수를 사용한 수학적 계산을 통해 결정됩니다. 이 지표는 통화 쌍과 금속, 암호화폐 및 주식에도 적용됩니다.
이 지표를 사용하면 시장 주기를 기반으로 매수/매도에 대한 지원 구역을 쉽게 구축하고, 이러한 구역에 접근할 때 거래 결정을 내릴 수 있습니다.
이를 통해 매수/매도 지원 구역에서 가격 움직임의 방향을 이해할 수 있습니다.
또한, 이 지표의 도움으로 상승/하락 사이클의 중단 시점을 파악하고 진입 시점을 결정할 수 있습니다.
스캘핑, 단기, 중기 거래에 적합합니다. 모든 것은 귀하의 거래 스타일에 달려 있습니다.
사용하기 매우 쉽습니다. 구역을 구축하는 데는 4개의 열쇠만 사용됩니다.
차트에서 눈에 띄는 최고/최저점을 기준으로 수동으로 존을 구축합니다.
구매를 위한 지지 구역을 구축하려면 마우스 커서를 명확하게 정의된 높은 곳
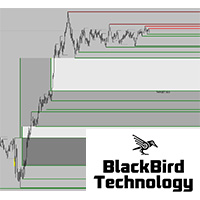
New market liquidity indicator, more accurate with two levels, will really unhide the "hidden agenda" of the price action in any timeframe. Forget all other indicator and use what professional traders are using ! For more information about market liquidity, a manual on how to use this indicator please send me a message.
A lot of information can be found on the net. (search liquidity trading/ inner circle trader)
https://www.youtube.com/watch?v=yUpDZCbNBRI
https://www.youtube.com/watch?v=2LIad2
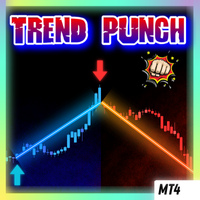
This indicator is unstoppable when combined with our other indicator called Support & Resistance . After purchase, send us a message and you will get it for FREE as a BONUS! Introducing Trend Punch , the revolutionary forex trend indicator that will transform the way you trade! Trend Punch is uniquely designed to provide precise buy and sell arrows during strong market trends, making your trading decisions clearer and more confident. Whether you're trading major currency pairs or exotic sym

Please follow the "How To Trade" instructions exactly for best results Wycoff theory is vastly used by institutional traders but when it comes to retail traders the concept isn't well understood by most. It is even more difficult to implement in intraday & swing trading. This No REPAINT indicator helps you in analyzing the market cycles and plots buy/sell signals at the start of trending phase. It studies the market strength of bulls and bears and does a effort Vs reward matrix calculation befor

이 지표는 테스트용이 아닌 실시간 차트용입니다. PRO Trend Divergence 지표는 추세 지속 다이버전스 를 감지하는 고급 기술 분석 도구입니다. 이는 현재 추세가 계속될 가능성이 높다는 신호를 제공합니다. 일반적인 지표가 추세 반전에 중점을 두는 반면, 이 도구는 일시적인 조정이나 되돌림이 발생하더라도 추세가 여전히 강한 상황을 파악하는 데 도움을 줍니다. 추세 지속 다이버전스 는 가격이 추세에 따라 움직일 때(상승 추세에서는 더 높은 저점, 하락 추세에서는 더 낮은 고점) 발생하지만 선택된 지표는 반대 방향을 가리킵니다. 이는 추세가 계속될 가능성이 높음을 확인해줍니다. PRO Trend Divergence 지표는 트레이더가 자신 있게 추세를 따라가고, 조기 청산 위험을 줄이는 데 유용합니다. 주요 기능 및 장점 다중 지표 지원
MACD, RSI, Stochastic, CCI, Momentum, OBV, VW-MACD, CMF, MFI와 함께 작동합니다. 차트에 시각적
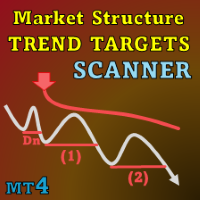
Special offer : ALL TOOLS , just $35 each! New tools will be $30 for the first week or the first 3 purchases ! Trading Tools Channel on MQL5 : Join my MQL5 channel to update the latest news from me I. 소개
Market Structure Trend Targets Scanner 는 시장 동향을 분석하고, 돌파 지점을 식별하며, 동적 스톱로스를 통해 위험을 관리하는 강력한 도구입니다. 이전 고점과 저점을 추적하여 돌파를 포착함으로써 이 도구는 트레이더가 직관적으로 시장 동향과 잠재적인 반전을 신속하게 인식하도록 도와줍니다. 더 많은 MT5 버전을 보려면: Market Structure Trend Targets MT5 Scanner 더 많은 제품을 보려면: 모든 제품 II. 주요 특징 순차 번호 매김을

Dark Oscillator is an Indicator for intraday trading. This Indicator is based on Counter Trend strategy, trying to intercept changes in direction, in advance compared trend following indicators. We can enter in good price with this Indicator, in order to follow the inversion of the trend on the current instrument. It is advised to use low spread ECN brokers. This Indicator does Not repaint and N ot lag . Recommended timeframes are M5, M15 and H1. Recommended working pairs: All. I nst
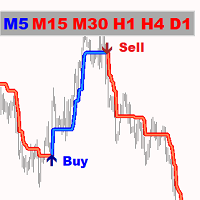
골드 포인터는 최고의 추세 지표입니다. 지표의 고유한 알고리즘은 기술적 및 수학적 분석 요소를 고려하여 자산 가격의 움직임을 분석하고 가장 수익성이 높은 진입 지점을 결정하고 매수 또는 매도 주문을 개시하라는 신호를 제공합니다.
최고의 보조지표 신호:
- 매도 = 빨간색 추세선 + 빨간색 TF 표시기 + 같은 방향의 노란색 신호 화살표. - 매수 = 파란색 추세선 + 파란색 TF 인디케이터 + 같은 방향의 아쿠아 신호 화살표.
인디케이터의 장점:
1. 표시기는 높은 정확도로 신호를 생성합니다. 2. 표시기의 확인 된 신호는 오디오 경고 (경고 및 메시지)로 신호 (화살표)를 확인한 후에도 사라지지 않고 다시 그려지지 않습니다. 3. 모든 브로커의 메타트레이더 4 거래 플랫폼에서 거래할 수 있습니다. 4. 모든 자산(통화, 금속, 암호화폐, 주식, 지수 등)을 거래할 수 있습니다. 5. 모든 차트주기(M5-M15 스캘핑 및 트레이딩/M30-N1 중기 트레이딩/H4-D1 장기

WaveTrend Momentum Oscillator is an upgrade to the popular and easy-to-use WaveTrend Oscillator. The WaveTrend Momentum Oscillator adds a momentum component to the original WaveTrend calculation, in order to provide faster and more accurate entry points during trendy market conditions. Do you prefer the original WaveTrend Oscillator? The WaveTrend Momentum Oscillator allows you to switch between momentum and original WT versions. Both provide valuable information depending on the market conditio

Noise filtering: the key to mastering trends
This indicator tracks the market trend with an unmatched reliability, by ignoring sudden fluctuations and market noise. It has been designed to trend-trade intraday charts and small timeframes. Its winning ratio is around 85%.
[ Installation Guide | Update Guide | Troubleshooting | FAQ | All Products ] Amazingly easy to trade Find oversold/overbought situations Enjoy noise-free trading at all times Avoid being whipsawed in intraday charts The indi
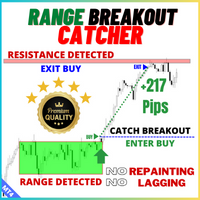
Description: The Range Breakout Catcher Indicator is a powerful tool known for its non-repainting, non-redrawing, and non-lagging capabilities, making it suitable for both manual and robot trading. This indicator utilizes a smart algorithm to calculate ranges and generate early signals for Buy and Sell positions at the breakout of these ranges, facilitating the capture of trends during ranging consolidations. The range calculation involves a comprehensive system based on various elements, prov

Take Your Trading Experience To the Next Level ! and get the exclusive TFSR-Analyzer for free ! So you have all these outstanding features on up to 20 symbols and all timeframes in a smart and clear Design.
Correct identification of the trends in stock investments are pivotal and TrendFollowerSR ensures this perspective while displaying the correct trend on multiply timeframes to help you go long way as much as possible. The latest technology of the Indicator enables to track whether if a
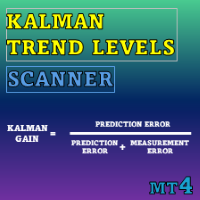
Special offer : ALL TOOLS , just $35 each! New tools will be $30 for the first week or the first 3 purchases ! Trading Tools Channel on MQL5 : Join my MQL5 channel to update the latest news from me Kalman Trend Levels 는 최첨단 칼만 필터 기술을 활용하여 강력한 분석 신호를 제공하는 고급 추세 추적 지표입니다. 정확성과 적응성을 위해 설계된 이 도구는 중요한 지지 및 저항 영역을 식별할 뿐만 아니라 시장의 모멘텀 및 추세 변화를 분석하는 종합적인 접근 방식을 제공합니다. MT5 버전 보기: Kalman Trend Levels MT5 다른 제품 보기: All Products See more detailed explanation of Kalman Filter logic in this in

Pipfinite creates unique, high quality and affordable trading tools. Our tools may or may not work for you, so we strongly suggest to try the Demo Version for MT4 first. Please test the indicator prior to purchasing to determine if it works for you. We want your good reviews, so hurry up and test it for free...we hope you will find it useful.
Combo Energy Beam with Swing Control Strategy: Confirm swing pullback signals Watch Video: (Click Here) Energy Beam with Trend Laser Strategy: Confirm Tre

Reversal Pattern AI is a groundbreaking advancement in indicator development, combining artificial intelligence algorithms, multi-level market analysis, and classical technical analysis methods. It not only detects reversal patterns but also evaluates market inefficiencies, generating highly accurate trading signals.Thanks to its hybrid model, which utilizes price action analysis, volume, volatility, VWAP, and Volume AVG %, the indicator easily adapts to any market conditions. Reversal Pattern A

The "Nostradamix" indicator is designed to analyze short-term market movements on lower timeframes (e.g., M1), while simultaneously considering trend direction on higher timeframes (e.g., M30). This tool identifies key trend reversal points, displays volatility levels, and generates buy/sell signals based on market dynamics. The indicator automatically plots: Current trend lines. Volatility bands to assess movement strength. Visual markers (arrows) for entry signals. Forecast Accuracy and Mathem

** All Symbols x All Timeframes scan just by pressing scanner button ** *** Contact me to send you instruction and add you in "ABCD scanner group" for sharing or seeing experiences with other users. Introduction This indicator scans AB=CD retracement patterns in all charts. The ABCD is the basic foundation for all harmonic patterns and highly repetitive with a high success rate . The ABCD Scanner indicator is a scanner reversal ABCD pattern that helps you identify when the price is about to ch

The NASDAQ 100 Power Indicator serves with TREND and trend reversals indication using automated arrows that indicates buy or sell at that price and has built-in signal provider across all time frames with alerts and provides also the automated support and resistance that can draw technical analysis patterns like double bottom, double top, head and shoulders etc. using closing and open prices, in assistance for if a trader did not see the pattern sooner for their technical analysis. The indicator

Market Heartbeat in your hand! Introduction The Market Heartbeat indicator with a special enhanced algorithm (volume, money flow, cycle of market and a secret value) is a very repetitive trend finder with a high success rate . Interestingly, this Winner indicator indicates that the trend has changed its direction or the end of a trend retracement or even appears at the range market. The Market Heartbeat can use in scalping trading or trend trading. It finds immediately with alarm, notification a

이 표시기의 아이디어는 모든 시간 프레임에서 Murray 레벨을 찾아 강력한 Murray 레벨(+2, +1, 8, 4, 0, -1, -2)을 기반으로 하는 신호 레벨을 포함하는 콤보 레벨로 결합하는 것입니다. 기간이 짧을수록 콤보 레벨을 즉시 볼 수 있는 기회가 많아집니다. 색상으로 강조 표시됩니다. 숫자 위에 커서를 올리면 레벨이 속한 기간에 대한 힌트가 나타납니다. 그러나 항상 현재 시간대가 가장 왼쪽으로 표시됩니다. 스마트 경고는 신호 콤보 레벨과 관련된 가격을 전달하는 데 도움이 됩니다.
비디오의 대시보드는 선언된 기능이 아니며 여기에 포함되지 않습니다! 아직 개발 중입니다.
트레이딩 추천. 추가 기술적 분석 없이 콤보 레벨에서 반등을 거래하는 것은 권장하지 않습니다. 파란색과 빨간색 레벨에서 반등할 확률이 더 높습니다. 가격은 아직 가격에 의해 테스트되지 않은 (128 캔들 전) 콤보 레벨에 자화됩니다. 이 경우 레벨 테이킹(한 레벨 상승/하락)이 있는 추세 전략을 사
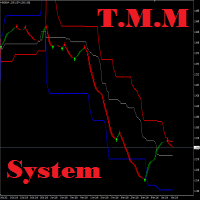
T.M.M 채널 시스템은 특별한 추세 필터 가격 채널 지표를 사용하여 추세로 매수 및 매도 신호를 제공하는 외환 거래 시스템입니다. 이 지표는 단 두 개의 매개변수만 사용하여 모든 시장에 쉽게 적응할 수 있습니다. 이 채널 표시기는 다시 그려지지 않습니다! 채널 표시기는 H4 차트 거래에 권장되지만 모든 기간에 사용할 수 있습니다. 구매 후 채널 표시기를 다운로드하게 됩니다. 화살표 표시기는 구매 후 무료로 제공됩니다. 구매 후 저에게 연락만 주시면 됩니다. 여기 이 마켓플레이스에서 TMM 채널 표시기(이 페이지에 제시된 것)를 구입할 수 있습니다. 이 표시기를 구매하시면 화살표 표시기를 무료로 받으실 수 있습니다! 간단히 이 제품을 구매하시고 화살표 도구를 요청하는 메시지를 보내주세요. 두 번째 지표를 무료로 보내드립니다. 구매 후 꼭 연락주세요! 시스템의 다른 지표를 무료로 보내드리겠습니다! 게다가 나는 또한 당신과 함께 큰 보너스를 공유할 것입니다!

외환 거래를 한다면, 통화 강도와 통화쌍 상관관계에 대한 상세한 정보를 아는 것은 거래 실력을 한 단계 끌어올리는 데 큰 도움이 됩니다. 상관관계를 분석하면 리스크를 절반으로 줄일 수 있고, 강도 분석을 통해 수익을 극대화할 수 있습니다. 이 지표는 통화 강도 분석과 통화쌍 상관관계를 결합하여 가장 적합한 통화쌍을 선택할 수 있도록 도와주는 하이브리드 접근 방식을 제공합니다.
통화 강도 분석 활용 방법
예를 들어, 당신의 거래 전략이 AUD/JPY 매수 기회를 제공한다고 가정해 봅시다. 하지만 KT 통화 강도 분석을 통해 JPY가 AUD보다 강해지고 있다는 것을 발견했다면, 이 거래는 손실로 끝날 가능성이 높습니다. 이 지표를 사용하면 이러한 손실을 쉽게 피할 수 있습니다.
통화쌍 상관관계 활용 방법 또 다른 예로, 거래 전략이 NZD/USD와 GBP/JPY 두 통화쌍 모두에 대해 매도 기회를 제공한다고 가정해 봅시다. KT 통화쌍 상관관계 분석을 사용하면 이 두 통화쌍 간 상관
MetaTrader 마켓은 거래로봇과 기술지표를 판매하기에 최적의 장소입니다.
오직 어플리케이션만 개발하면 됩니다. 수백만 명의 MetaTrader 사용자에게 제품을 제공하기 위해 마켓에 제품을 게시하는 방법에 대해 설명해 드리겠습니다.
트레이딩 기회를 놓치고 있어요:
- 무료 트레이딩 앱
- 복사용 8,000 이상의 시그널
- 금융 시장 개척을 위한 경제 뉴스
등록
로그인
계정이 없으시면, 가입하십시오
MQL5.com 웹사이트에 로그인을 하기 위해 쿠키를 허용하십시오.
브라우저에서 필요한 설정을 활성화하시지 않으면, 로그인할 수 없습니다.