PZ Double Top Bottom
- 지표
- 버전: 5.0
- 업데이트됨: 16 4월 2019
- 활성화: 20

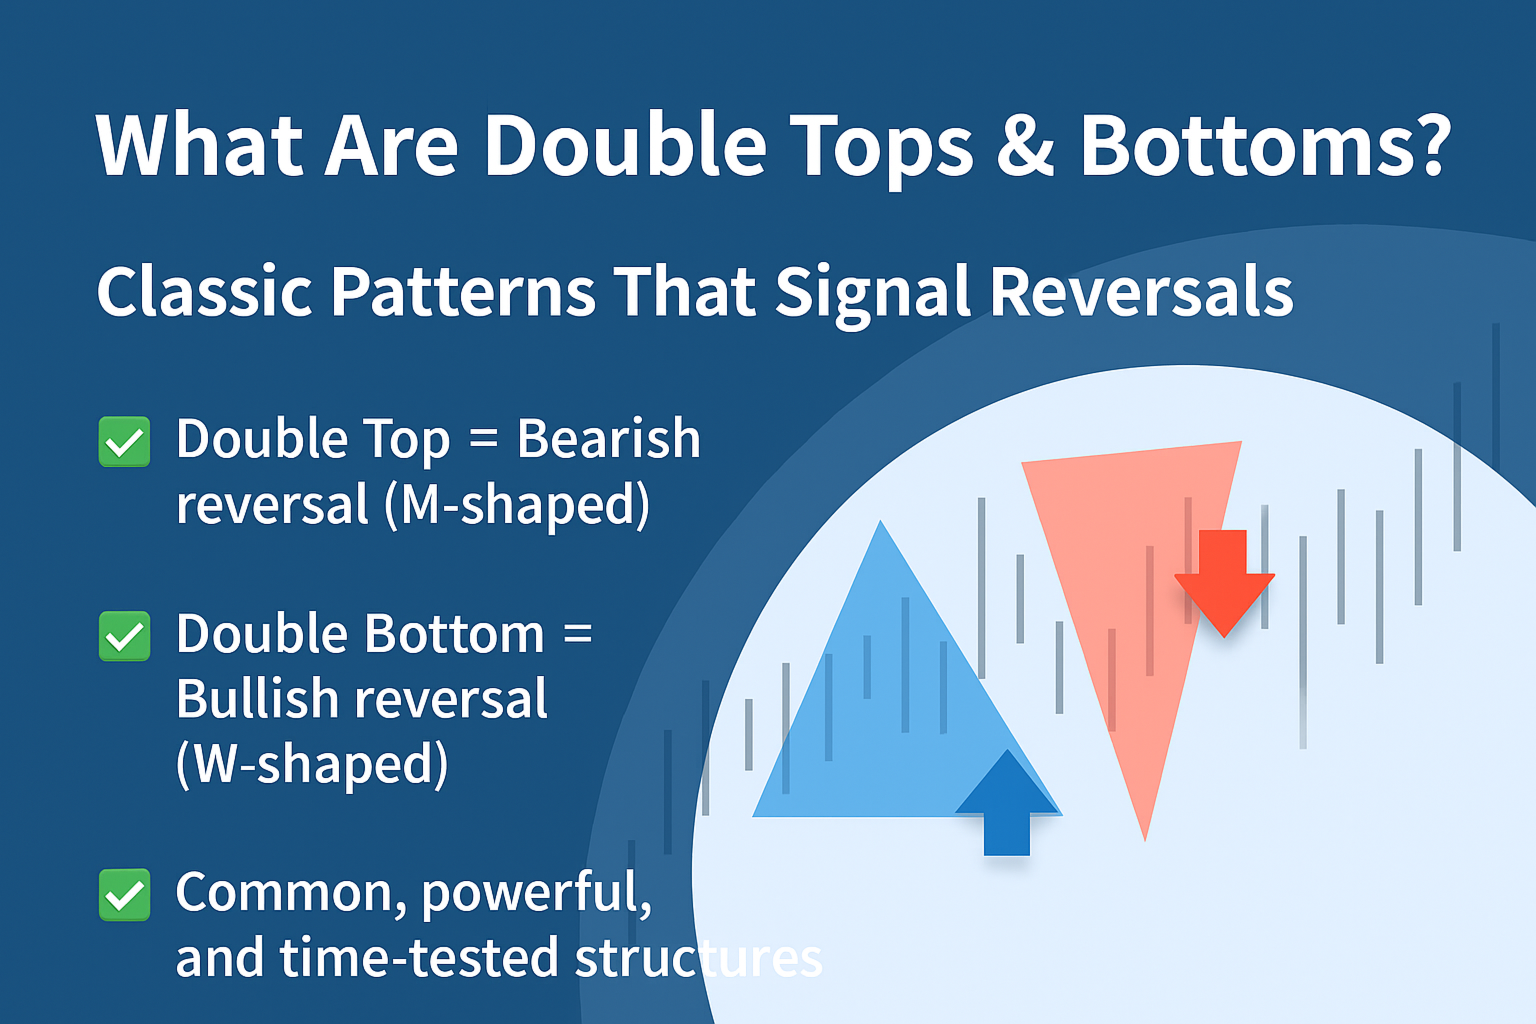
Trade double tops and bottoms effectively
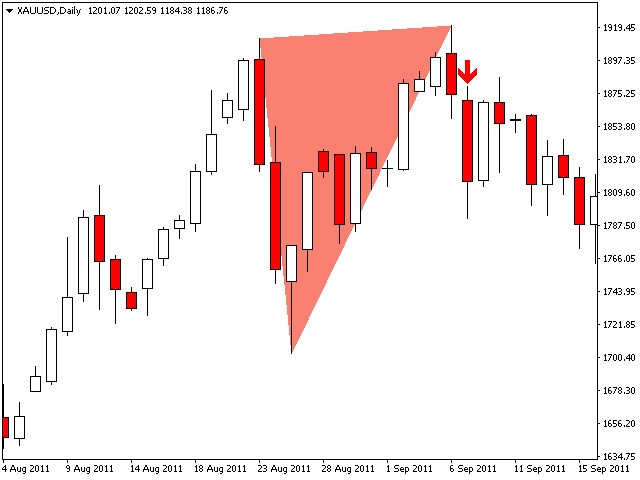
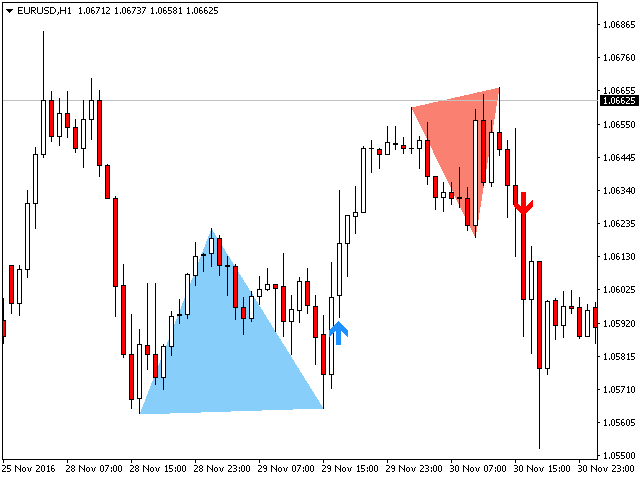
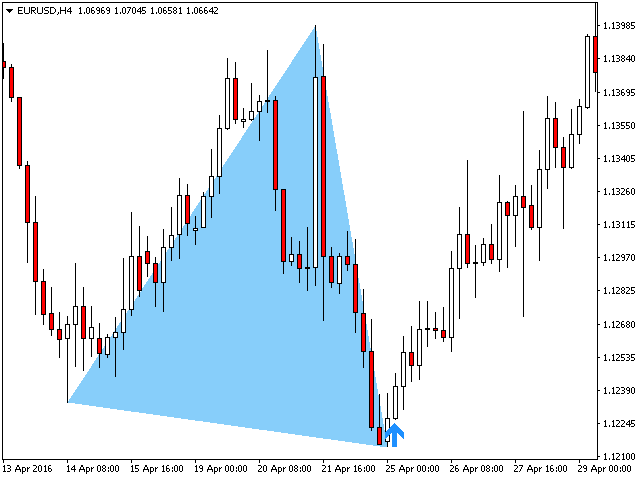
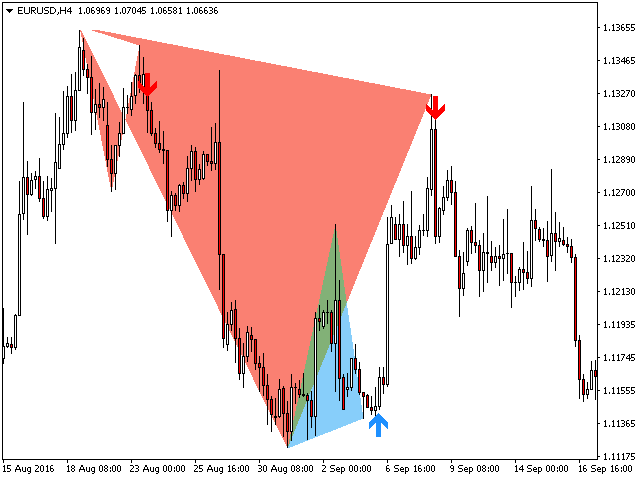
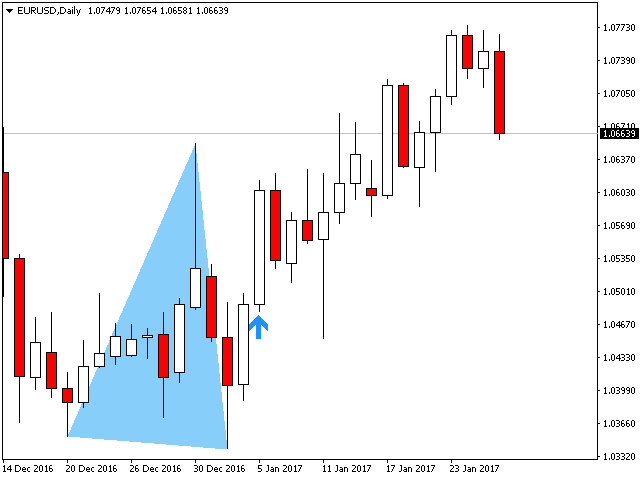
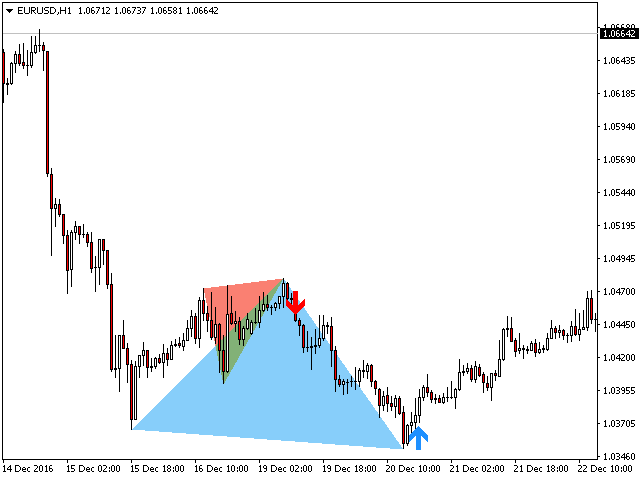
The PZ Double Top/Bottom Indicator is a technical analysis tool that helps traders identify potential price reversal patterns in the market. These patterns, known as double tops and bottoms, are characterized by two consecutive peaks or valleys in the price of an asset. Double tops and bottoms are often seen as potential reversal patterns because they can signal a change in the direction of the current trend.
[ Installation Guide | Update Guide | Troubleshooting | FAQ | All Products ]
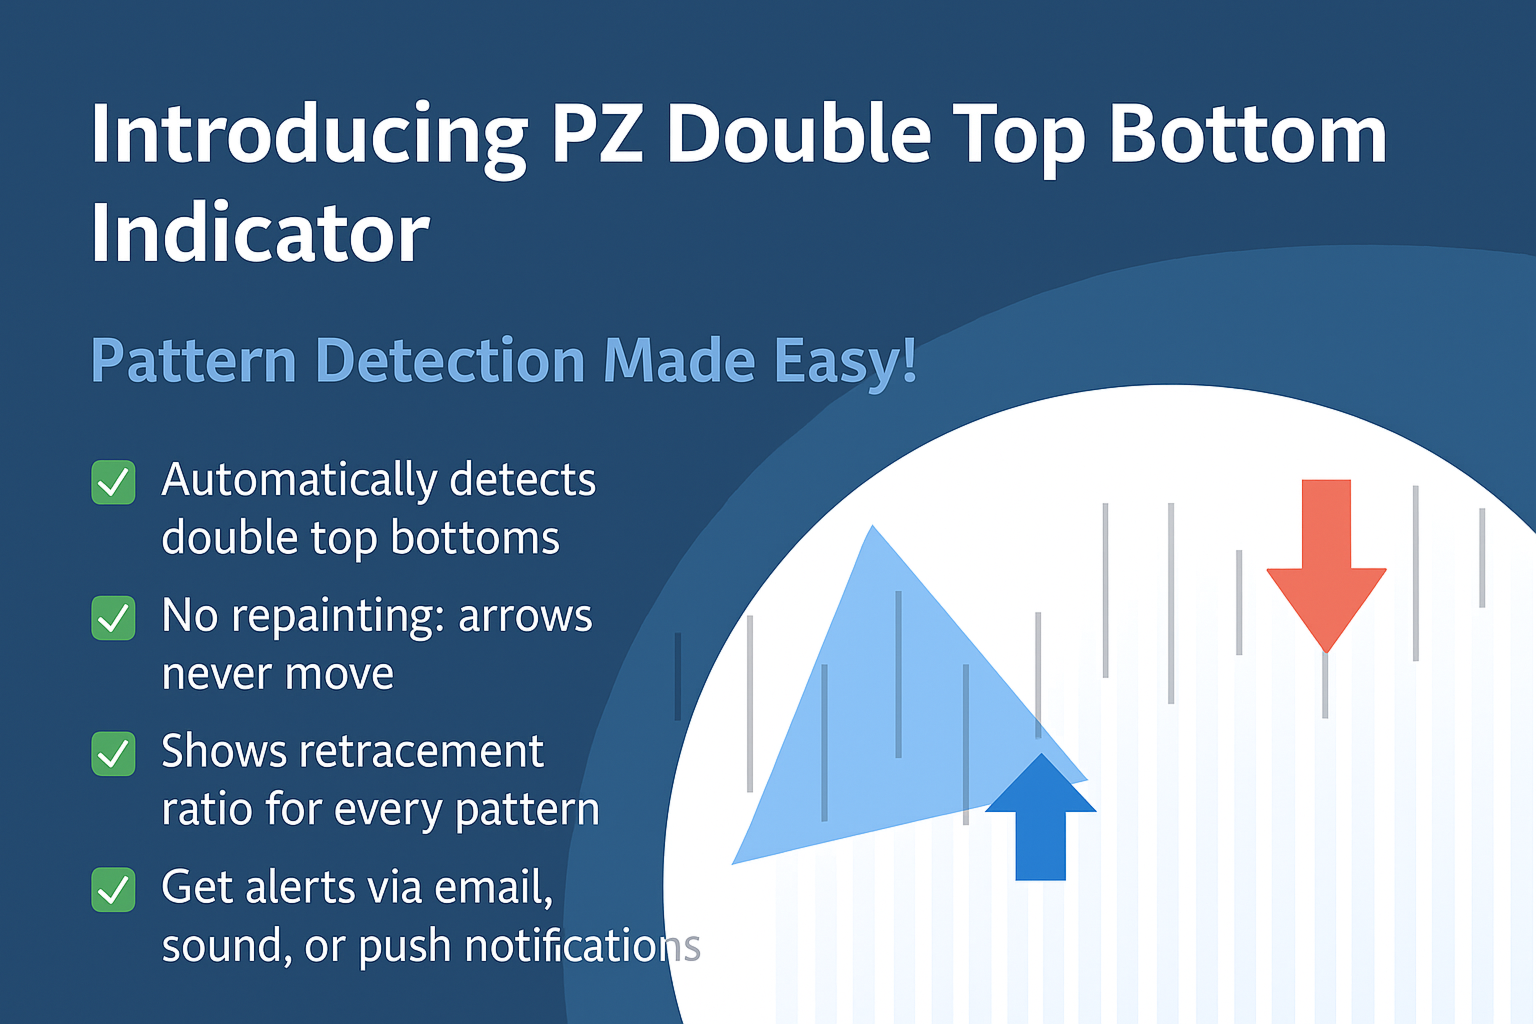
- Clear trading signals
- Customizable colors and sizes
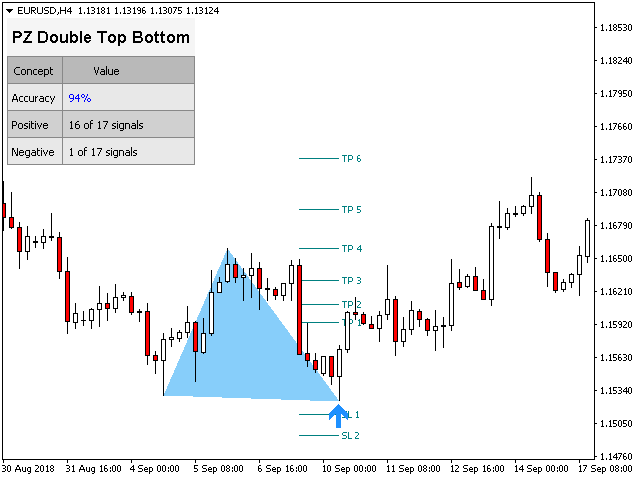
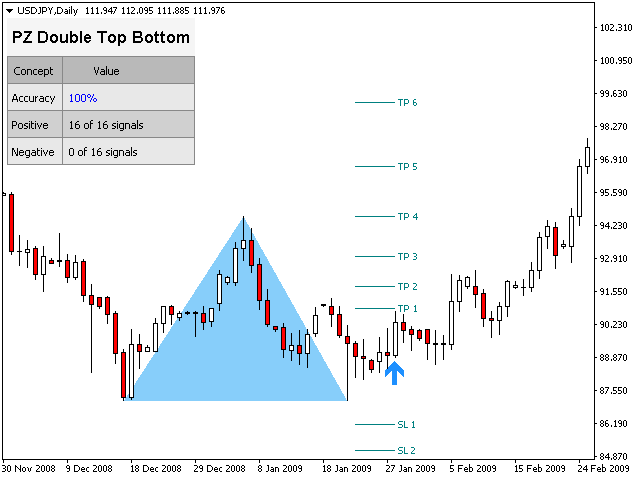
- Implements performance statistics
- Customizable fibonacci retracement levels
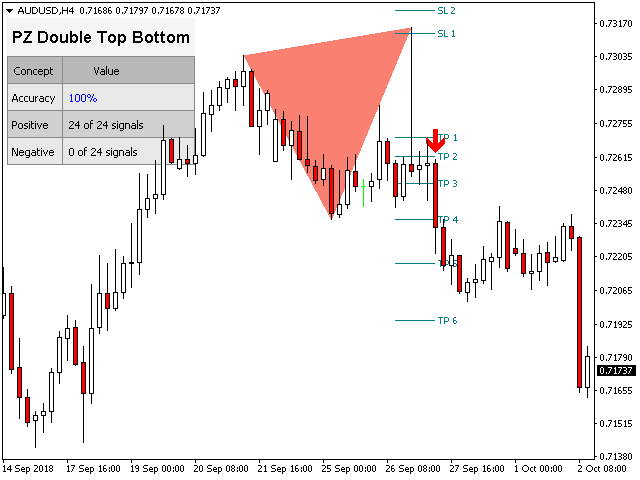
- It displays suitable stop-loss and take-profit levels
- It implements email/sound/visual alerts
These patterns can expand, and the indicator follows the pattern by repainting. However, the indicator implements a twist to make it easier to trade: it waits for a Donchian breakout in the right direction before signaling the trade, making its signals very reliable and mostly non repainting.
Input Parameters
- Amplitude: The amplitude represents the minimum amount of bars between alternative price points. To find big patterns, increase the amplitude parameter. To find smaller patterns, decrease the amplitude parameter.
- Min. Retracement: The minimum fibonacci retracement needed in a pattern.
- Max. Retracement: The maximum fibonacci retracement possible in a pattern.
- Max History Bars: Amount of past bars to evaluate when the indicator loads in the chart.
- Display Stats: Show or hide the statistics dashboard and performance data.
- Display SL/TP Levels: Show or hide the suitable stop-loss and take-profit levels for each signal.
- Drawing Options: Colors and sizes for bullish or bearish lines and labels, as well as font sizes.
- Breakouts: Colors and sizes for breakout arrows.
- Alerts: Enable or disable alerts of all kinds.
Author
Arturo López Pérez, private investor and speculator, software engineer and founder of Point Zero Trading Solutions.

It's worth the money and is 100% better than the other one that I paid for.