 MetaTrader 5
 Experts
 지표
지표
 라이브러리
라이브러리
 유틸리티
유틸리티
 위젯
위젯
 규칙
규칙
MetaTrader 4용 유료 기술 지표 - 6
 아래 나열된 기술 지표의 시그널은 MetaTrader 4 플랫폼의 거래를 열고 종료하는 데 중요한 역할을 합니다.
지표의 본질은 가격 변화를 예측하기 위한 금융 시그널 값의 수학적 변형입니다.
아래 나열된 기술 지표의 시그널은 MetaTrader 4 플랫폼의 거래를 열고 종료하는 데 중요한 역할을 합니다.
지표의 본질은 가격 변화를 예측하기 위한 금융 시그널 값의 수학적 변형입니다. 
The Trend PA indicator uses Price Action and its own filtering algorithm to determine the trend. This approach helps to accurately determine entry points and the current trend on any timeframe. The indicator uses its own algorithm for analyzing price changes and Price Action. Which gives you the advantage of recognizing, without delay, a new nascent trend with fewer false positives. Trend filtering conditions can be selected in the settings individually for your trading style. The indicator

화면을 보는 스트레스 없이 확률 높은 거래를 원하는 분들을 위해 제작된 매우 효과적인 차트 도구인 Repeat Order Block에 오신 것을 환영합니다. 이 지표의 핵심 철학은 매우 간단하고 논리적입니다. 우리는 pullback (풀백/되돌림)만 거래합니다. Higher Timeframe (상위 시간 프레임)에서 주요 시장 구조가 무너질 때까지 기다렸다가 가격이 새로 형성된 영역으로 되돌아오게 한 다음, 거래를 실행하기 전에 Lower Timeframe (하위 시간 프레임)에서 추세 지속 확인을 엄격하게 기다립니다. 주요 기능 및 장점 Proven Multi Timeframe Logic: 이것은 표준 독립 실행형 지표가 아닙니다. 두 가지 시간 프레임을 완벽하게 혼합합니다. Higher Timeframe은 로드맵 역할을 하는 반면 Lower Timeframe은 스나이퍼 트리거 역할을 합니다. 이는 가짜 breakout (돌파) 및 함정을 걸러냅니다. Clean Visual Dis

KT Auto Support Resistance Levels: MetaTrader 4/5용 멀티 타임프레임 S&R, Smart Zones 및 레벨 대시보드 스윙 고점. 피벗. 오더블록. 이전 고점과 저점. 트레이더마다 시장을 표시하는 방식은 조금씩 다르고, 그 대가는 결국 차트가 치르게 됩니다. 한 화면에 너무 많은 방법을 쌓아 올리면 차트는 더 이상 지도가 아닙니다. 그냥 소음이 됩니다. KT Auto Support Resistance Levels 는 이 문제를 해결합니다. 월간, 주간, 일간, 그리고 현재 타임프레임을 동시에 스캔한 뒤, 실제로 중요한 레벨을 MetaTrader 차트 위에 자동으로 그려 줍니다. 차트가 복잡해지면 한 번의 클릭으로 모든 레벨을 깔끔한 Smart Zones로 병합할 수 있습니다. 또한 실시간 패널이 항상 현재 가격 위와 아래의 가장 가까운 레벨을 보여 주기 때문에, 차트에서 계속 찾아다닐 필요가 없습니다. 지치지 않고 계속해서 중요 레벨을 표시해 주

RSI indicator with signal lines, at the intersection of which a corresponding notification will be issued, which can be in the form of a normal alert, or in the form of a user sound file.
The indicator also has the function of sending push-notifications and email notifications at the intersection of these levels.
The values of the levels can be set independently in the indicator settings, and, if desired, they can be changed and configured directly in the indicator window. To check the oper
This indicator is the mql4 version of the SSLHybrid indicator. MT5 Version Find out more here: https://www.mql5.com/en/users/rashedsamir/seller
Description of TradingView version: This script is designed for the NNFX Method, so it is recommended for Daily charts only.
Tried to implement a few VP NNFX Rules
This script has a SSL / Baseline (you can choose between the SSL or MA), a secondary SSL for continiuation trades and a third SSL for exit trades.
Alerts added for Baseline entries, SSL2
Binary Trader Master 는 촛불 종가를 예측하는 화살표 기반 지표입니다. 하나의 캔들 내에서만 분석을 수행합니다. 양초가 열리면 분석을 수행하고 양초 종가를 예측하는 데 약간의 시간이 필요합니다. 그런 다음 신호를 생성합니다. 이 지표를 사용하면 분석에 사용할 수 있는 시간 제한을 적용할 수 있습니다. 즉, 캔들 내 분석에 허용되는 시간을 지표에 실제로 알릴 수 있습니다. 표시기는 양초의 특수 볼륨 패턴을 모니터링합니다. 이 분석은 실제로 현재(0) 캔들의 종가를 예측합니다. 이러한 양초는 일반적으로 거래량이 많기 때문에 이러한 신호는 잠재적인 수익도 좋고 외환 거래에도 사용할 수 있습니다. 바이너리 및 외환 거래자 모두 이 표시기의 혜택을 받을 수 있습니다. 인디케이터가 개별 캔들 본체와 함께 작동하기 때문에 인디케이터는 실시간 또는 시각적 전략 테스트 모드에서만 신호를 제공합니다! 신호는 다시 칠하지 마십시오! 구매 후 연락주세요! 나는 당신에게 거래 지침을 제공하

Institutional Blueprint (MT4) — Market Structure, Order Blocks & Risk/Reward Zones
Institutional Blueprint reads the chart the way professional price-action traders do. On every closed bar it maps live market structure, marks the Order Block behind each move, and turns the most relevant block into a ready-to-read trade plan with a clear Entry, Stop Loss and three Take-Profit targets — drawn as a green reward zone and a red risk zone, so the trade geometry is obvious at a glance.
Based on Sm

Apollo Striker 는 가격 움직임의 방향을 예측하는 효과적인 BUY/SELL 화살표 지표입니다. 이 지표는 선호하는 전략이나 통화 쌍, 기간에 관계없이 절대적으로 모든 거래자에게 적합합니다. 이 화살표 표시기는 통화, 금속, 지수, 주식 또는 암호화폐 등 모든 거래 수단과 함께 사용할 수 있습니다. 또한, 거래자는 표시기 설정의 특수 매개변수를 사용하여 모든 거래 쌍 및 시간 프레임에 대해 표시기 신호를 쉽게 조정할 수 있습니다. 표시기는 PUSH를 포함하여 소리 경고를 제공합니다. 표시기 신호는 다시 그리지 마십시오! 구매 후 반드시 저에게 편지를 보내주세요! 이 표시기로 작업하기 위한 권장 사항을 알려 드리겠습니다. 당신을 기다리고있는 큰 보너스도 있습니다! 성공적인 거래를 기원합니다!
Advanced Indicator Scanner is a multi-symbol multi-timeframe scanner that works with hundreds of custom indicators available across the web including mql5 website market and codebase indicators.
Advanced Indicator Scanner features:
Scans your indicator in 28 customizable instruments and 9 timeframes. Monitors up to 2 lines(buffers) of an indicator. Showing of indicator value on buttons. You can choose between 3 alert modes: Single symbol and timeframe Multiple timeframes of a symbol Multiple

Breakthrough Solution For Trend Trading And Filtering With All Important Features Built Inside One Tool! Trend PRO's smart algorithm detects the trend, filters out market noise and gives entry signals with exit levels. The new features with enhanced rules for statistical calculation improved the overall performance of this indicator.
Important Information Revealed Maximize the potential of Trend Pro, please visit www.mql5.com/en/blogs/post/713938
The Powerful Expert Advisor Version
Automatin

Advanced Market Maker Dashboard by G-Labs — Beat The Market Maker multi-pair scanner for MetaTrader 4. Seventeen-column ADR dashboard with price formation, breaker blocks, TDI SharkFin, RSI divergence, stop hunt, daily candle confirmation, currency strength, and chart overlays from one panel.
The full BTMM workflow dashboard for traders who have outgrown a basic scanner. Monitor 28 or more pairs in real time: trend direction, peak formation side (PFH/PFL), ADR expansion in MAX and real-time col

MFI Pulse Pro – 머니 플로우 인덱스 기반 모멘텀 지표 최신 정보를 받으려면 채널을 구독하세요: https://www.mql5.com/en/channels/forexnewadvisor
MFI Pulse Pro 는 Money Flow Index (MFI)를 기반으로 한 모멘텀 지표로, 과매수 및 과매도 상태를 시각적으로 식별하고 잠재적인 반전 포인트를 조기에 포착하도록 설계되었습니다. 이 지표는 모든 거래 자산에 적합하며 M1에서 M30 까지의 타임프레임에 최적화되어 있습니다.
주요 기능: 사용자 정의 가능한 MFI 주기: 기본값은 14 이며 전략에 맞게 조정할 수 있습니다. 과매수/과매도 영역 설정: 기본값 70 (과매수), 30 (과매도)로 극단적인 시장 상태를 포착합니다. 컬러 기반 표시: 파란색 은 과매도, 빨간색 은 과매수를 나타냅니다. 멀티 타임프레임 지원: 현재 또는 상위 타임프레임을 선택해 MFI를 계산할 수 있습니다. 경고 시스템 내장: 팝업, 사운드,

- Real price is 80$ - 50% Discount (It is 39$ now) - It is enabled for 1 purchases. Contact me for extra bonus (Gann Trend indicator), instruction or any questions! - Non-repaint, No lag - I just sell my products in Elif Kaya Profile, any other websites are stolen old versions, So no any new updates or support. - Lifetime update free Gann Gold EA MT5 Introduction W.D. Gann’s theories in technical analysis have fascinated traders for decades. It offers a unique approach beyond traditional char
Scalping Explorer is a complete trading system. Our traders have tested and optimized its work for maximum effect. Trading with Scalping Explorer is easy. Open in Metatrader4 windows with currency pairs: EURUSD, GBPJPY, GBPUSD, AUDUSD, USDCHF. We include D1 timeframe on all currency pairs. Add the Scalping Explorer indicator to each window with a currency pair. In the indicator settings, we find the "Signal" parameter and set it to TRUE. Now, as soon as a signal appears on any of the currency p
이 지표는 여러 통화쌍과 시간대를 동시에 모니터링할 수 있는 효율적인 방법을 제공합니다. 가격과 MACD 간 다이버전스를 명확하고 읽기 쉬운 표 형태로 시각화하여, 트레이더들이 차트를 계속 전환할 필요 없이 잠재적인 시장 전환점을 파악할 수 있습니다. 다이버전스는 상승(강세) 또는 하락(약세) 추세 전환 신호로 작용할 수 있습니다. 예를 들어, 가격이 새 고점을 기록했지만 MACD가 이를 더 높은 고점으로 확인하지 못한다면 이는 약세 다이버전스입니다. 반대로, 가격이 더 낮은 저점을 형성하는 동안 MACD가 더 높은 저점을 형성한다면 이는 강세 다이버전스입니다. 지표의 표에서 각 종목(예: EURUSD, GBPUSD)은 왼쪽에 세로로 나열되고, 선택한 시간대(M5, H1, D1 등)는 상단에 가로로 배치됩니다. 단순한 점은 다이버전스가 감지되지 않았음을 의미하며, “UP” 또는 “DN”(하락) 표시가 나타나면 잠재적 거래 신호를 강조합니다. 녹색 “UP”은 매수 기회를, 빨간색 “D

Binary Options Trading Indicator: A Reliable Tool for Your Trades This indicator is specifically designed for binary options trading and has proven its high quality, reliability, and adequate accuracy, depending on the dynamics of the chart. Key Points: Signal Interpretation: When a blue cross signal appears, it indicates a potential entry into a trade, though it is considered a weak signal on its own. However, if the blue cross is accompanied by an arrow, it is considered a more reliable buy s

The arrow indicator for Forex and Binary options is based on tick volumes. Unlike many volume indicators, the "Super volumes" indicator calculates bullish and bearish volumes and gives signals based on the predominance of any of them. If, say, there was an advantage of bullish volumes in this range at the moment, then the signal will be on Buy. Or if the predominance was bearish volumes, then, accordingly, the signal will be on Sell.
In the indicator settings in the "volumes" variable, you can
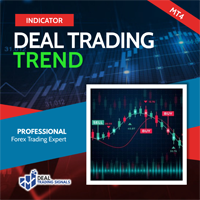
Simple Trading System Update !!! Follow this link to see our 2024 Strategy !!! ( Download the EAs scanner ) Deal Trading Trend All-in-One Professional Trend System Trend Trading, Dynamic Support and Resistance, and Pullback Signals with Alerts Deal Trading Trend is a technical indicator developed for MetaTrader 4. It combines trend direction analysis, dynamic support and resistance levels, and Stochastic momentum pullback signals into a structured chart layout. The indicator is suitable for s

MT4용 Crypto_Forex 지표 "Micro M 및 Micro W 패턴", 리페인트 및 지연 없음. - "Micro M 및 Micro W 패턴" 지표는 가격 변동 거래에 매우 강력한 지표입니다. - 이 지표는 차트에서 Micro M 패턴과 Micro W 패턴을 감지합니다. - 상승 Micro W - 차트에 파란색 화살표 신호(그림 참조). - 하락 Micro M - 차트에 빨간색 화살표 신호(그림 참조). - PC 및 모바일 알림 기능 내장. - "Micro M 및 Micro W 패턴" 지표는 지지/저항 레벨과 함께 사용하기에도 매우 좋습니다. - 모든 시간대에서 사용 가능합니다. - 추세 변화 또는 조정 종료 시점을 감지하는 데 매우 유용한 지표입니다. Click here to see high quality Trading Robots and Indicators! MQL5 웹사이트에서만 제공되는 오리지널 제품입니다.

Complete SMC/ICT Indicator MT5 — Smart Money Concepts 도구
Complete SMC/ICT Indicator 는 차트 창에서 직접 실행되는 독립형 Smart Money Concepts 분석 도구입니다. 시장 구조, 불균형, 유동성 영역을 기관급 수준으로 탐지하며, 완전한 사용자 맞춤 설정과 알림 기능을 제공합니다.
기능 이 인디케이터는 10가지 핵심 SMC 요소를 탐지합니다: 스윙 고점과 저점, 공정 가치 갭(FVG), 오더 블록(OB), 구조 붕괴(BOS), 성격 변화(ChoCH), 시장 구조 전환(MSS), 동일 고점과 저점, 유동성 스윕, 디스플레이스먼트 캔들, 프리미엄/디스카운트 존. 각 기능은 드래그 가능한 패널에서 개별적으로 켜거나 끌 수 있으며, 영역은 설정에 따라 차트 앞으로 확장됩니다.
멀티 타임프레임 분석 최대 3개의 타임프레임에서 동시에 실행할 수 있으며, TF1, TF2, TF3 각각을 독립적으로 설
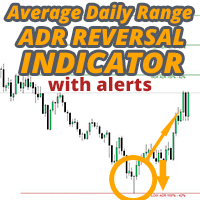
ADR 반전 표시기는 가격이 정상적인 일일 평균 범위와 관련하여 현재 거래되고 있는 위치를 한 눈에 보여줍니다. 가격이 평균 범위를 초과하고 선택한 수준보다 높을 때 팝업, 이메일 또는 푸시를 통해 즉각적인 알림을 받을 수 있으므로 신속하게 철회 및 반전에 뛰어들 수 있습니다. 지표는 평균 일일 범위 극단에서 차트에 수평선을 그리고 가격이 초과하는 수학적 확률이 첨부된 수준 위의 확장을 그립니다. 자세한 내용은 아래에서... 표시기를 보완하고 모든 쌍을 모니터링하기 위한 ADR 경고 대시보드: https://www.mql5.com/en/market/product/62756
MT5 버전도 여기에서 사용 가능: https://www.mql5.com/en/market/product/64477/
시간의 약 60%는 가격이 정상적인 일일 평균 범위(ADR) 내에서 거래되고 이 수준 이상으로 상승하면 일반적으로 급격한 가격 변동의 지표이며 일반적으로 이에 따라 후퇴(이익 차감) 움직임이

ADR 경보 대시보드는 가격이 일반적인 일일 평균 범위와 관련하여 현재 거래되고 있는 위치를 한 눈에 보여줍니다. 가격이 평균 범위를 초과하고 선택한 수준보다 높을 때 팝업, 이메일 또는 푸시를 통해 즉각적인 알림을 받을 수 있으므로 신속하게 철회 및 반전에 뛰어들 수 있습니다. 대시는 빈 차트에 배치되도록 설계되었으며 배경에 앉아서 레벨에 도달하면 경고하므로 앉아서 보거나 전혀 볼 필요가 없습니다! MT5 버전은 여기에서 사용 가능: https://www.mql5.com/en/market/product/66316
새로운 기능: 이제 평균 WEEKLY 및 MONTHLY 범위와 경고도 표시됩니다!
여기에서 차트의 수준을 나타내는 ADR 반전 표시기를 얻으십시오. https://www.mql5.com/en/market/product/62757
시간의 약 60%는 가격이 정상적인 일일 평균 범위(ADR) 내에서 거래되고 이 수준 이상으로 상승하면 일반적으로 급격한 가격 변동의 지표

Malaysian SNR은 말레이시아 트레이더들이 사용하는 지지선 및 저항선 시스템으로, 스캘퍼와 데이 트레이더가 빠르게 레벨을 찾을 수 있는 방법입니다. 이 인디케이터의 기능: 지지/저항 표시 및 숨기기 패널 윅 리젝션 필터를 통해 검증된 SNR만 표시 레벨 가격 표시/숨기기 차트의 보이는 영역에서만 작동하며, 창 크기를 조절하여 실시간 분석 가능 차트 이동 시 자동으로 업데이트 Malaysian SNR은 말레이시아 트레이더들이 사용하는 지지선 및 저항선 시스템으로, 스캘퍼와 데이 트레이더가 빠르게 레벨을 찾을 수 있는 방법입니다. 이 인디케이터의 기능: 지지/저항 표시 및 숨기기 패널 윅 리젝션 필터를 통해 검증된 SNR만 표시 레벨 가격 표시/숨기기 차트의 보이는 영역에서만 작동하며, 창 크기를 조절하여 실시간 분석 가능 차트 이동 시 자동으로 업데이트
** All Symbols x All Timeframes scan just by pressing scanner button ** After 18 years of experience in the markets and programming, Winner indicator is ready. I would like to share with you! *** Contact me to send you instruction and add you in "123 scanner group" for sharing or seeing experiences with other users. Big Update: 2026/10/15
Introduction The 123 Pattern Scanner indicator with a special enhanced algorithm is a very repetitive common pattern finder with a high success rate . Inter
Brilliant Reversals MultiCurrency Scanner MT4는 여러 통화 쌍에서 잠재적인 반전 포인트를 식별하려는 트레이더를 위해 설계된 최첨단 거래 지표입니다. 고급 알고리즘을 활용하여 이 도구는 즉각적인 통찰력을 제공하여 거래 전략을 최적화하려는 초보자와 숙련된 트레이더 모두에게 매우 유용합니다. 이 지표는 시장 상황에 따라 실시간 매수 및 매도 신호를 제공하여 트레이더의 의사 결정을 향상시키고 거래 성과를 개선합니다. 포괄적인 대시보드와 알림 기능을 통해 주요 통화 쌍을 쉽게 모니터링하고 시장 기회에 신속하게 대응할 수 있습니다. MQL 제품 설치 가이드 | 구매한 MQL 제품 업데이트 MT4/MT5 | 일반 문제 해결 가이드 | 지표 설정 / 가이드 주요 기능 버퍼 통합: 지표 값을 접근 가능한 버퍼로 노출하여 Expert Advisor가 신호 기반 거래를 효과적으로 활용할 수 있도록 합니다. 시각적 화살표 신호: 차트에 직접 매수/매도 화살표를 명확하게

Binary Options Support Resistance Indicator This indicator is designed for binary options trading and effectively shows retracements from support and resistance levels. Signals appear on the current candle. A red arrow pointing downwards indicates a potential selling opportunity, while a blue arrow pointing upwards suggests buying opportunities. All that needs adjustment is the color of the signal arrows. It is recommended to use it on the M1-M5 timeframes as signals are frequent on these timef
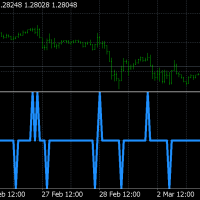
Pulse Scalping Line - an indicator for identifying potential pivot points. Based on this indicator, you can build an effective Martingale system. According to our statistics, the indicator gives a maximum of 4 erroneous pivot points in a series. On average, these are 2 pivot points. That is, the indicator shows a reversal, it is erroneous. This means that the second signal of the indicator will be highly accurate. Based on this information, you can build a trading system based on the Martingale
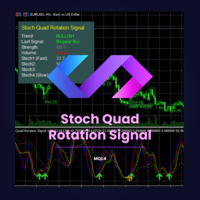
Stoch Quad Rotation Signal (MQL4)은 MetaTrader 4용 고급 기술적 지표로, 여러 스토캐스틱 오실레이터와 강력한 추세 필터, 볼륨 필터, 패턴 필터를 통합하고 신호 점수 시스템 및 다중 시간대 분석을 제공합니다. 높은 확률의 거래 기회를 명확하고 정확하게 식별하기 위해 설계되었습니다.
주요 특징:
사양 스토캐스틱 분석: 4가지 다른 스토캐스틱 오실레이터 설정(개인화 가능한 K, D 및 스무딩 기간 포함)을 동시에 사용하여 과매수/과매도 조건에 대한 세부적이고 다중 감도의 관점을 제공합니다. 이는 시장의 다양한 "속도"에서 움직임을 포착할 수 있게 합니다. 스마트 추세 필터: 빠른, 중간, 느린 지수 이동 평균선(EMA)을 기반으로 하는 견고한 시스템을 포함합니다. 주요 추세에 반하는 신호를 필터링하거나 EMA 경사를 확인하고 가격이 중요한 EMA와의 위치를 검증할 수 있습니다. 다양한 거래 신호: 다양한 유형의 신호를 생성합니다: 일반 신호: 주

SMT (Smart Money Technique) Divergence refers to the price divergence between correlated assets or their relationship to inversely correlated assets. By analyzing SMT Divergence, traders can gain insights into the market's institutional structure and identify whether smart money is accumulating or distributing assets. Every price fluctuation should be confirmed by market symmetry, and any price asymmetry indicates an SMT Divergence, suggesting a potential trend reversal. MT5 Version - https:/

Alpha Trend sign has been a very popular trading tool in our company for a long time. It can verify our trading system and clearly indicate trading signals, and the signals will not drift.
Main functions:
Based on the market display of active areas, indicators can be used to intuitively determine whether the current market trend belongs to a trend market or a volatile market.
And enter the market according to the indicator arrows, with green arrows indicating buy and red arrows indicating se

BlueDigitsFx 공식 생태계 액세스 인프라 업데이트, 트레이딩 리소스, 제품 출시 정보 및 BlueDigitsFx 공식 생태계에 대한 액세스를 받아보세요. Telegram 생태계
웹사이트
MT5 버전
BlueDigitsFx OBV Divergence MT4 — 시장 반전을 식별하기 위한 거래량 다이버전스 지표 BlueDigitsFx OBV Divergence는 가격 움직임과 On-Balance Volume(OBV) 지표 간의 강세 및 약세 다이버전스를 식별하도록 설계된 MT4 지표입니다. 가격 움직임과 거래량 행동을 비교함으로써 이 지표는 다양한 시장 환경에서 잠재적인 추세 소진, 반전 조건 및 모멘텀 변화를 식별하는 데 도움을 줍니다. 이 지표는 차트에 다이버전스 패턴을 직접 표시하여 거래량 기반의 추가 확인과 함께 시장 구조를 분석할 수 있도록 지원합니다.
주요 기능 자동 다이버전스 감지 — 차트에서 강세 및 약세 OBV 다이버전스를 자동으로 식별합니다. 거래량

Pinpoint 는 금에 대한 정확한 구매 및 판매 신호를 위해 설계된 다시 그리기 및 지연없이 매우 효율적인 거래 지표입니다. 표시기는 빠르게 변화하는 시장에서 실시간으로,빠르고 정확하고 시각적 인 솔루션을 원하는 상인을 위해 설계되었습니다. 이 지표는 기성품 거래 전략으로 작동합니다. 그것은 내장 된 알고리즘에 따라 자산의 가격의 동작을 분석하고 이상적인 진입 점을 결정뿐만 아니라,이익을 잠글 위치를 보여줍니다.
잠재적 인 변화를보다 정확하게 식별하기 위해 표시기에는 현재 시장 상황에 따라 동적으로 조정되는 지능형 추세선 도구가 내장되어 있습니다. 라인의 표준 설정에 따라: 녹색-구매 이니셔티브. 빨간색은 판매 이니셔티브입니다. 오렌지-이전 이니셔티브를 가로 챌 수 있습니다.
Pinpoint mt5
Pinpoint Blog
Pinpoint 에는 잘못된 신호를 줄이고 입력 품질을 향상시키는 데 도움이되는 다양한 필터가 포함되어 있습니다. 기본 구성은 5 년 동안 15,30

표시기는 지정된 막대 수에 대한 작업 히스토그램에서 최대 및 최소 가격 볼륨(시장 프로필)의 수준을 찾습니다. 복합 프로파일. 히스토그램의 높이는 완전 자동이며 모든 기기 및 기간에 맞게 조정됩니다. 저자의 알고리즘이 사용되며 잘 알려진 아날로그를 반복하지 않습니다. 두 히스토그램의 높이는 촛불의 평균 높이와 거의 같습니다. 스마트 경고는 볼륨 레벨에 관한 가격에 대해 알려 도움이 될 것입니다.
개념Smart Money. Low Volume - Imbalance. ,좋은 시장 상황을 찾아 시장의 구조를 결정하고 바이너리 옵션에 대한 필터로 사용됩니다. 그것은 가격에 대한 자석입니다. High Volume - Liquidity. 는 시험을 위해 축적을 나갈 때 사용됩니다.
입력 매개 변수.
기본. Bars Count - 계산 및 표시 할 막대 수. Signal Fractal = 5 (색상 신호 레벨). 수준은 다음과 같은 조건에서 신호가 될 것입니다:그것을 초과하지 않는 상
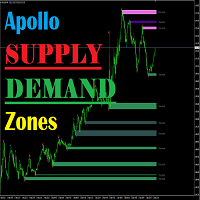
Apollo 공급 수요 구역은 지지와 저항 수준을 계산하는 지표입니다. 지표는 사용하는 전략에 관계없이 절대적으로 모든 거래자에게 유용합니다. 이 지표는 거래 시스템의 주요 요소 중 하나가 될 수 있습니다. 표시기는 현재 시간 프레임의 레벨을 모두 계산하고 MTF 모드에서 작동하여 더 높은 시간 프레임의 레벨을 표시합니다. 이 지표는 모든 시간 프레임 및 모든 거래 수단에 절대적으로 사용할 수 있습니다. 표시기는 다양한 유형의 수준을 보여주며 실제로 시장의 그림을 표시합니다. 표시기는 소리 경고를 제공하므로 이 표시기로 작업하는 것이 매우 편리합니다. 구매 후 반드시 저에게 편지를 써주세요! 지표 사용에 대한 권장 사항을 알려 드리겠습니다. 당신을 기다리고있는 큰 보너스도 있습니다! 성공적인 거래를 기원합니다!
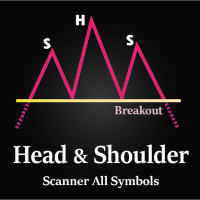
This is the Full Version, to get the free version please contact me.
The free version works on “AUDNZD” and “XAUUSD” charts.
All symbols and time frames scanner
Head and Shoulder
One of the most popular Price Action patterns is the Head and Shoulders pattern. The pattern has three local tops that resemble the left shoulder, head, and right shoulder. The head and shoulders chart pattern appears in all kinds of markets, including Forex, cryptocurrency, commodities, stocks, and bonds. The head

Product Overview Bottom Picker Pro is a bull/bear wave sub-window indicator designed specifically for both MT4 and MT5 platforms. By integrating multi-period extreme value algorithms with multiple smoothing techniques, it constructs a highly responsive bull/bear trend line and wave tracking system. This indicator precisely identifies momentum reversals in extremely overbought and oversold zones, providing clear bottom-picking, top-escaping, and trend-pullback signals, helping traders accura

새로운 시장의 왕이 등장했습니다 – 인디케이터 + 주문 관리 시스템(TP1 + TP2 + TP3) (완전한 트레이딩 시스템) 이 인디케이터는 고급 매매 전략, 사용자 지정이 가능한 주문 관리 시스템, 그리고 Envelopes 확장 기법을 활용한 평균회귀(Mean Reversion) 시스템을 결합한 완전한 트레이딩 솔루션입니다. 또한 RSI를 비롯한 다양한 지능형 확인 필터를 통해 높은 확률의 반전 구간을 포착하며, 명확한 BUY(매수) 및 SELL(매도) 신호를 제공합니다. 이 인디케이터는 리페인트(Repaint)를 하지 않습니다. 단순히 매매 타이밍을 찾는 방법뿐만 아니라, 여러 포지션을 효과적으로 관리하고 이미 수익 중인 포지션을 활용하여 손실 거래를 상쇄하는 실전 자금 관리 기법까지 배울 수 있습니다. M5(5분 차트)에 맞춰 개발 및 최적화되었으며, 거의 모든 통화쌍과 거래 상품에서 우수한 성능을 발휘합니다. 또한 백테스트를 지원하여 다양한 시장 환경에서 시스템의 성과를 검증

SMC Larry Williams Structure PRO Larry Williams의 계층형 스윙 방법을 기반으로 제작된 MetaTrader 4용 고급 시장 구조 지표를 소개합니다. PRO 버전은 하나의 국지적 고점과 저점 흐름만 표시하지 않습니다. 단기, 중기, 장기의 세 가지 연결된 시장 구조 단계 를 구성하고, inside bar와 outside bar를 처리하며, Breakout, BoS, ChoCH 및 Reversal을 식별합니다. 또한 iCustom 을 통해 EA에 확정 데이터를 제공합니다. 일반적인 ZigZag 이상의 구조 분석. 사후적으로 완성된 차트 형상과 당시 실제로 이용 가능했던 확정 이벤트를 구분합니다. 세 단계의 시장 구조 STH / STL — Short-Term High / Low
단기 구조 고점과 저점. ITH / ITL — Intermediate-Term High / Low
확정 단기 포인트에서 형성된 중기 피벗. LTH / LTL — Long-Te

As traders, we know that identifying price contractions and consolidations is crucial for profitable trading. Fortunately, we have a powerful tool at our disposal. The indicator to trade price consolidation is designed to identify price contraction and alerts us on formation. It does this by analyzing historical price data and identifying price action patterns. The algorithm then uses this information to mark the zone , potential targets and liquidity lines, giving us valuable insights into mark
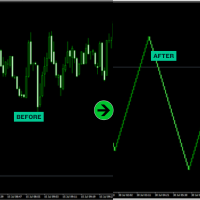
This indicator builds ultra-smooth Renko bricks directly from the 1-minute timeframe, giving scalpers a clean and reliable price structure without noise or lag. It’s designed for real-time trading , where timing and clarity are key. Each Renko brick reflects live market data, ensuring that every shift in price action is visible and tradable.
How It Works:
This Renko engine runs off live M1 price ticks , meaning your chart reflects true momentum and structure not lagging, aggregated price bars.

3 Level ZZ Semafor Scanner:
This is a Dashboard indicator which uses 3LZZ Indicator in the background to find semafors. It will give priority to the semafors3 because they specify a strong signal. So, even if there is a sem1 or 2 on current bar, and if Sem3 was within "Check Previous Bars for Sem 3". Then it will show Sem3 instead. Read about this in detailed post: https://www.mql5.com/en/blogs/post/758250
And get all extra Indicators/Template from above link.
Please note: Number of settings

After purchase, contact me in private to get 7 days of FREE testing with EA Forex Proton where the robot automatically takes the trade alerts from MBFX Timing! MBFX Timing is an indicator that was developed and created by Mostafa Belkhayate, one of the best traders in the world. We decided to create a modified version that takes inspiration from the Stochastic Oscillator and the Relative Strength Quality Index indicators to improve your trading.
One of the main reasons we released MBFX Timing

이 인디케이터는 선택한 기간 동안 상승과 하락 사이의 불균형을 측정하고 두 지점 사이의 직선을 표시합니다.
상승세가 하락세보다 거래량이 많으면 선이 녹색으로 바뀝니다. 하락세가 더 많으면 빨간색으로 표시됩니다. 이 선은 거래량의 백분율 차이도 표시합니다.
표시기는 별도의 창에 동일한 데이터를 표시합니다. 분할된 볼륨도 볼 수 있습니다.
표시기에는 두 가지 모드가 있습니다.
이를 위해 왼쪽 상단에 버튼이 있습니다,
- 누르지 않으면 시장의 임의의 지점과 현재 가격 사이의 불균형을 측정합니다. - 버튼을 누르면 선택한 시장의 두 지점 사이의 잔액을 측정할 수 있습니다.
이 인디케이터는 선택한 기간 동안 상승과 하락 사이의 불균형을 측정하고 두 지점 사이의 직선을 표시합니다.
상승세가 하락세보다 거래량이 많으면 선이 녹색으로 바뀝니다. 하락세가 더 많으면 빨간색으로 표시됩니다. 이 선은 거래량의 백분율 차이도 표시합니다.
표시기는 별도의 창에 동일한 데이터를 표

Master Manual: Complete Edition Aura HHLL Platinum V2.00 통합 매뉴얼 이 프로그램은 트레이더가 차트의 복잡한 움직임 속에서 "지금 시장이 어떤 상태인가?"를 가장 빠르게 판단할 수 있도록 돕는 도구입니다. 프라이스 액션의 정밀함과 박스권 매매의 직관성을 결합한 기술적 분석의 결정체이다.
SECTION 01 지표 핵심 구성 요소 시장의 구조(Structure)를 읽는 눈을 제공합니다.
1. 시스템의 3가지 핵심 축 HHLL 라벨 현재 가격의 위치를 이전 고점/저점과 비교하여 프라이스 액션 규칙에 따라 HH, HL, LH, LL로 자동 명명합니다. 이것만 보아도 현재가 상승 추세인지, 하락 추세인지, 아니면 힘이 빠지고 있는지를 알 수 있습니다. 지그재그 파동선 고점과 저점을 수직 연결하여 파동의 방향과 크기를 시각화합니다. 상승 시 Lime, 하락 시 Red 컬러가 적용됩니다. 스마트 S/R 라인 유의미한 가격대를 수평 점
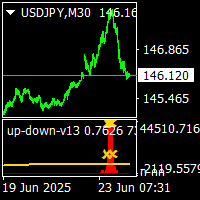
up-down v13 indicator is no repaint and works all pairs and all time frames charts. it consumes too much time need at least i5 cpu.pc. price chanel indicator is will be a BONUS.. it is suitable also 1 m charts for all pairs. and hold long way to signal. dont gives too many signals. when red histogram cross trigger line that is up signal.and price probably will down when blue histogram cross trigger line that is down signal.and price probably will go up. when the signals not seen press + button

SWING VOLUME PROFILE
Swing-Based Volume Profile + Fibonacci + RSI
--------------------------------------------------
Auto-detected swings. Volume profile. Fibonacci. RSI. All-in-one.
--------------------------------------------------
WHAT THIS INDICATOR DOES
Swing Volume Profile (SVP) automatically detects structural swings and displays a volume profile for the most recent completed swing — with Fibonacci retracement and RSI overlay.
No manual range selection needed. The indicator finds

피벗 수준은 모든 시장에서 인정되는 잘 확립된 기술 수준입니다. 이 표시기는 모든 기호에 대해 현재 분기별, 월별, 주별, 일별 및 4시간별 피벗을 차트에 그립니다. 또한 각 기간에 대한 지원 및 저항 수준을 표시하고 수준 1에서 4까지 표시할 항목을 선택할 수 있습니다. 다음에서 피벗 유형을 선택합니다. 기준 도당 데마크 우디 피보나치 DeMark 피벗에는 원래 사양에 따라 단일 지원 및 저항 수준이 있습니다. 표시기 벽은 선이 가격에 닿은 경우 선이 그려지는 방식을 변경합니다. 이것은 매우 도움이 될 수 있으며 라인 지원 또는 저항의 강도는 일단 만지면 상당히 감소합니다. 각 기간에 대해 예측 피벗 수준을 표시하도록 선택할 수 있습니다. 이것은 일반 피벗과 동일한 계산을 사용하지만 현재 불완전한 기간에서 작동합니다. 따라서 가격이 이미 범위의 대부분을 커버하는 해당 기간이 끝날 무렵에 가장 잘 사용됩니다.
설정
모든 설정에 대한 자세한 내용은 별도의 블로그 게시물에서 확
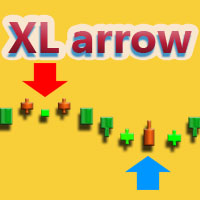
XL Arrow is a signal indicator that displays market entry points. The red arrow and the DOWN signal at the right corner indicate it is time to sell, while the blue arrow and the UP signal indicate it is time to buy.
Settings
PeriodSlower - indicator slowing period. PeriodFaster - indicator acceleration period.
Recommendations trading pairs: EURUSD, GBPUSD and USDJPY timeframes: M5 - H4
Aggressive intraday scalper is a mechanical system for intraday scalping, which displays trade opening and closing signals as arrows on the chart. When a signal emerges, the indicator sends email and push notifications. So, you don't have to stay by the monitor analyzing the market and waiting for a signal. Aggressive intraday scalper will do it for you. The system has been developed for those traders who do not have their own trading system and who would love to quickly start trading using the

CS ATR FIBO CHANNELS MULTI TIMEFRAME
Additional tool to trade with Cycle Sniper Indicator.
Cycle Sniper : https://www.mql5.com/en/market/product/51950 Indicator Draws Channels based on: - Cycle Sniper Price and Moving Averages - ATR Deviations - Fibonacci Retracement and Extensions
Features: - Multi TimeFrame - Full alert and Notification options. - Simple Settings - Finds the trend change or extreme reversals.
Inputs: - Arrow Mode: ATR Levels or Median Line If Median Line is selected ind

This indicator is a conventional analytical tool for tick volumes changes. It calculates tick volumes for buys and sells separately, and their delta on every bar, and displays volumes by price clusters (cells) within a specified bar (usually the latest one). The algorithm used internally is the same as in the indicator VolumeDelta , but results are shown as cumulative volume delta bars (candlesticks). Analogous indicator for MetaTrader 5 exists - VolumeDeltaBars . This is a limited substitution

IX Power: 지수, 원자재, 암호화폐 및 외환 시장 통찰력을 발견하세요 개요
IX Power 는 지수, 원자재, 암호화폐 및 외환 시장의 강도를 분석할 수 있는 다목적 도구입니다. FX Power 는 모든 가용 통화 쌍 데이터를 사용하여 외환 쌍에 대해 가장 높은 정확도를 제공하는 반면, IX Power 는 기초 자산 시장 데이터에만 초점을 맞춥니다. 이로 인해 IX Power 는 비외환 시장에 이상적이며, 다중 쌍 분석이 필요하지 않은 간단한 외환 분석에도 신뢰할 수 있는 도구입니다. 모든 차트에서 매끄럽게 작동하며, 거래 결정을 향상시키기 위한 명확하고 실행 가능한 통찰력을 제공합니다.
1. IX Power가 트레이더에게 유용한 이유 다양한 시장 강도 분석
• IX Power 는 지수, 원자재, 암호화폐 및 외환 심볼의 강도를 계산하여 각 시장에 맞는 통찰력을 제공합니다.
• US30, WTI, 금, 비트코인 또는 통화 쌍과 같은 자산을 모니터링하여 거래 기회를 발견
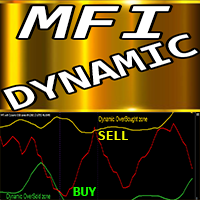
MT4용 Crypto_Forex 지표 "동적 과매수/과매수 구간을 포함하는 MFI" (재도색 불필요) - Money_Flow_Index(MFI)는 가격 및 거래량 데이터를 사용하여 과매도 및 과매수 구간을 식별하는 기술적 오실레이터입니다. - 동적인 과매수 구간에서는 매도 거래를, 동적인 과매도 구간에서는 매수 거래를 하는 데 유용합니다. - MFI는 다이버전스 감지에 매우 유용하며, 가격 움직임과 결합하기에도 좋습니다. - 동적인 과매수 구간 - 노란색 선 위 - 동적인 과매도 구간 - 녹색 선 아래 - MFI 오실레이터는 강세 및 약세 가격 모멘텀에 대한 정보를 제공합니다. - PC 및 모바일 알림 기능 제공 여기를 클릭하여 고품질 트레이딩 로봇과 지표를 확인하세요! 본 제품은 MQL5 웹사이트에서만 제공되는 오리지널 제품입니다.

MonsterDash Harmonic Indicator is a harmonic pattern dashboard. It recognizes all major patterns. MonsterDash is a dashboard that displays all detected patterns for all symbols and (almost) all timeframes in sortable and scrollable format. Users can add their own user defined patterns . MonsterDash can open and update charts with the pattern found.
Settings MonsterDash's default settings are good enough most of the time. Feel free to fine tune them to your needs. The color settings are for thos

TMA Currency Meter is the ultimate currency meter. Based on the Triangular Moving Average of all available symbols, this indicator shows which currencies are strong, strengthening, weak or weakening. Experienced as well as novice traders will see the strong and weak currencies in the blink of an eye, and know which trade possibilities to explore further. TMA Currency Meter is a true Multi Timeframe indicator. It is easy to show the currency strengths for a higher timeframe than the chart timefra

고급 맞춤형 Crypto_Forex 지표 "적응형 플로우 오실레이터" - MT4를 위한 효율적인 보조 트레이딩 도구! - 이 지표는 차세대 오실레이터입니다. - "적응형 플로우 오실레이터"는 조정 가능한 적응형 과매도/과매수 영역을 제공합니다. - 이 지표는 가격 및 거래량 데이터를 모두 사용하여 계산합니다. - 오실레이터는 과매도/과매수 영역에서 정확한 진입 시점을 찾는 보조 도구입니다. - 적응형 과매도 영역: 녹색선 아래 - 적응형 과매수 영역: 빨간색선 위 - 이 지표는 추세 전략 및 지지/저항선과 함께 사용하기에 좋습니다. - 표준 오실레이터보다 정확도가 높습니다. - 모든 시간대에서 사용할 수 있습니다. - PC 및 모바일 알림 기능이 내장되어 있습니다. Click here to see high quality Trading Robots and Indicators! MQL5 웹사이트에서만 제공되는 정품 제품입니다.

Scalping Lines System - 은 M1-H1 시간 프레임에서 금(XAUUSD) 자산을 거래하기 위해 특별히 설계된 스캘핑 트레이딩 시스템입니다.
추세, 변동성, 과매수/과매도 시장 분석 지표를 하나의 오실레이터로 통합하여 단기 신호를 식별합니다.
신호선의 주요 내부 매개변수는 사전 설정되어 있습니다.
"Trend Wave Duration"은 이동평균선 추세를 사용하여 추세 방향으로 일련의 신호 지속 시간을 조절하고, "Apply Smoothing to Signal Line"은 신호선 생성 방식을 조정하는 매개변수로, 수동으로 조정할 수 있습니다.
시가에서 신호선을 계산할 때는 차트가 다시 그려지지 않습니다. 다른 가격대에서는 신호 화살표가 깜빡일 수 있습니다.
신호는 캔들 마감 후에 나타나며, 다양한 알림 유형을 사용할 수 있습니다.
권장 시간 프레임: M1, M5, M15, M30, H1.
이 지표는 원래 금 거래를 위해 설계되었지만, 스프레드가 낮은 변동성이
이 표시기는 지정된 계수를 기반으로 낮은,높은,극단적 인 볼륨을 찾아 지정된 색상으로 페인트합니다. 그것은 메타 트레이더 터미널의 표준 볼륨 그리기 기능을 대체합니다. 양초는 또한 볼륨의 색상으로 착색 될 수 있습니다. 극단적 인 볼륨을 가진 촛대에서는 최대 수평 볼륨(클러스터/포치)이 결정됩니다. 위치(밀기,중립,정지)에 따라 클러스터는 자체 색상을 갖습니다. 클러스터가 그림자에,그리고 촛불 극단적 인 볼륨을 가지고 있다면,우리는 반전에 대한 화살표를 얻을. 당신은 설정에서 경고를 활성화 할 수 있습니다. 또한 표시기에는 클러스터를 그림자로 표시하는 별도의 옵션이 있습니다.
입력 매개 변수. (색상 및 시각적 설정과 관련된 일부는 건너 뜁니다).
기본 설정. Bars Count – 표시기가 작동하는 기록 막대의 수. Data Source - 견적 기간 선택. 이 응용 프로그램은 당신이 당신의 자신의 음악을 만들 수 있습니다. Vertical Step - 밀도 및 수직 정확도에

The Notorious OB — 유동성 스윕, order block, 그리고 차트 위의 확인.
오더 블록과 FVG 중간선을 통과하는 유동성 스윕을 차트에서 확인. 실계좌 패널.
The Notorious OB는 order block(OB) 또는 fair value gap을 통과하는 유동성 스윕을 기다린 뒤, 사용자의 차트가 이를 확인해야 화살표를 표시한다. 저희 지표는 진지하고 규율 있는 프롭 펌 트레이더를 위해 만들어졌습니다. 프롭 펌의 카피 트레이딩 규정 때문에, 사용자 수를 제한하기 위해 구매가 늘어날수록 가격이 인상됩니다. 구조를 판단할 타임프레임은 직접 고를 수 있으며, 예를 들어 M1 또는 M5 차트 뒤에서 M15를 쓸 수 있다. 지표는 그 타임프레임의 order block과 fair value gap을 중간선과 함께 그리고, 유동성을 쓸어가면서 이 존 중 하나의 중간선을 통과하는 캔들을 지켜본다. 그 캔들이 마감하면 셋업이 대기 상태가 된다. 매수 또는 매도 색상의 점

order block과 FVG의 중간선을 통과하는 A+ 유동성 스윕을 핵심 레벨 돌파로 확인합니다.
설명: Sweep Protocol — A+ 유동성 스윕(liquidity sweep)과 핵심 레벨 돌파. 저희 인디케이터는 진지하고 규율 있는 프랍 펌 트레이더를 위해 만들어졌습니다. 카피 트레이딩에 관한 프랍 펌 규정 때문에, 사용자 수를 제한하기 위해 판매가 늘어날수록 가격이 인상됩니다. Sweep Protocol은 A+ 유동성 스윕을 기다립니다. 구조 타임프레임의 캔들이 스윙 너머의 유동성을 가져가고, 상위 타임프레임 order block(OB) 또는 fair value gap(FVG)의 중간선(mid)을 통과하는 경우입니다. 이 캔들이 마감되면 셋업이 대기 상태가 되며, 매수 또는 매도 색상의 점선에 Buy armed 또는 Sell armed가 표시됩니다. 가격이 반전 방향으로 관심 지점을 넘어 마감하면 화살표가 표시됩니다. 전일 고가, 저가 및 50% 레벨 전주 고가와 저가

소프트웨어 설명 이 지표는 다양한 시간대와 설정에 따라 1개 또는 2개의 MACD 지표를 표시할 수 있습니다. 계산을 위해 EMA를 사용하는 무료 버전이 있습니다. 이 Pro 버전은 단순, 지수, 평활 및 선형 가중 등 4가지 이동 평균 유형을 모두 사용하여 계산합니다. 활성 표시기는 팝업, 소리, 푸시 또는 이메일 경고를 제공할 수 있습니다. 제로 레벨 교차에 대한 무료 버전 경고인 이 Pro 버전 경고는 사용자가 해당 옵션을 선택한 경우 제로 레벨 교차 또는 히스토그램 신호선 교차로 설정할 수 있습니다. 시간 프레임과 기간이 각각 다르더라도 하나 또는 두 활성 표시기에 경고를 설정할 수 있습니다. 2개의 MACD 지표를 사용하는 경우 각 지표에 대해 경고가 별도로 작동할 수 있습니다.
메인 차트에는 활성 지표와 해당 설정을 표시하는 버튼이 있는 디스플레이 패널이 있습니다. 이 패널을 숨기는 옵션이 있습니다. 임시 버튼을 사용하면 활성 MACD 중 하나를 숨길 수 있습니다.

This dashboard shows you the 3MA Cross Overs current status for Multi-currency multi-timeframes. Works for Metatrader 4 (MT4) platform. Detailed Post:
https://www.mql5.com/en/blogs/post/759238
How it Works:
MA Cross Signals It will show “S” Green/Red Strong Signals and “M” or “W” Green/Red Medium or Weak signals. We have 3 types of MA: Faster, Medium and Slower MA. A strong signal is when FasterMA and MediumMA are both above/below SlowerMA. A medium signal is when only FasterMA is above/below

Crypto_Forex 지표 "망치형 및 역망치형 패턴"은 MT4에서 사용 가능하며, 리페인트나 지연 없이 사용할 수 있습니다. 상승 추세 시장을 위해!
- "망치형 및 역망치형 패턴" 지표는 가격 변동 거래에 매우 강력한 지표입니다. - 이 지표는 차트에서 상승 망치형 및 역망치형 패턴을 감지합니다. - 상승 망치형 - 차트에 파란색 화살표 신호(그림 참조). - 상승 망치형 - 차트에 녹색 화살표 신호(그림 참조). - PC, 모바일 및 이메일 알림 기능을 제공합니다. - "망치형 및 역망치형 패턴" 지표는 지지/저항선과 함께 사용하기에 매우 좋습니다. ..................................................................... 여기를 클릭하여 고품질 트레이딩 로봇과 지표를 확인하세요! 이 제품은 MQL5 웹사이트에서만 제공되는 오리지널 상품입니다.

PrimeTrend Pro PrimeTrend Pro est un indicateur de suivi de tendance basé sur un moteur de canal ATR à cliquet. Il intègre un ensemble de filtres indépendants de qualité de signal ainsi qu'un tableau de bord multi-symbole et multi-période. L'indicateur est conçu pour afficher trois informations sur un seul écran : la direction actuelle de la tendance, la fiabilité du signal en cours et le degré de concordance avec les autres périodes et symboles. Il s'agit d'un indicateur. Il n'ouvre, ne modifi

Gold Scalper System is a multifunctional trading system that combines a breakout strategy for key liquidity levels with confirmation and a built-in Smart DOM Pro module for market depth analysis. The system identifies zones of limit order accumulation, tracks activity at support and resistance levels, and generates signals at the moment of their breakout. Smart DOM Pro visualizes Bid/Ask volumes, identifies liquidity clusters, and helps determine the intentions of major market participants. G
Get ALL my MT4 & MT5 indicators FREE — See how here
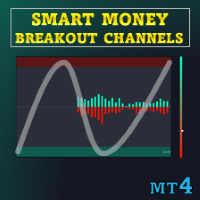
특별 제공 : ALL TOOLS , 개당 $35 ! 새로운 도구 는 첫 주 또는 처음 3회 구매 에 한해 $30 입니다! MQL5의 Trading Tools 채널 : 최신 소식을 받으려면 제 MQL5 채널에 참여하세요 이 지표는 변동성으로 정규화된 가격 움직임에 기반한 “Smart Breakout Channels”라 불리는 돌파 감지 구역을 표시합니다. 이 구역들은 거래량 오버레이가 포함된 동적 박스로 표시됩니다. 도구는 사용자 정의 정규화 변동성 계산을 사용하여 일시적인 매집 또는 분산 구간을 탐지하고, 가격이 해당 구간을 상향 또는 하향으로 벗어나는 순간을 표시합니다. 각 채널은 구조화된 범위를 나타내며, 거래량 델타, 상승/하락 거래량, 그리고 모멘텀 바이어스를 보여주는 그래디언트 시각 게이지로 추가 컨텍스트를 제공합니다. MT5 버전 더 보기: Smart

The indicator is a polyline (ZigZag segment) that tracks and connects the extreme points of the chart price that are at least a specified size apart from each other in points on the price scale.
The one and only setting is the minimum size (in points) of a ZigZag segment. The indicator displays levels to determine a possible trend reversal:
level "LevelForUp" - the breaking of this level determines the possible reversal of the trend up (to buy);
level " LevelForDown " - the breaking o
Get ALL my MT4 & MT5 indicators FREE — See how here
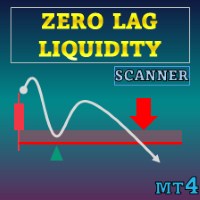
특별 할인 : ALL TOOLS , 개당 $35 ! 신규 도구 는 첫 주 또는 처음 3회 구매 까지 $30 ! MQL5의 Trading Tools 채널 : 최신 소식을 받기 위해 제 MQL5 채널에 가입하세요 Zero Lag Liquidity 는 하위 타임프레임의 꼬리 프로파일과 고거래량 꼬리를 이용해 유동성 구역을 표시합니다. 각 비정상 캔들에 대해, 지표는 꼬리 내부의 거래량 히스토그램을 구축하고 로컬 POC(Point of Control)를 찾아 그 가격을 레벨로 렌더링합니다. 이후의 상호작용은 가격이 이 레벨들에 어떻게 반응하는지에 따라 라벨, 돌파 신호, 그리고 단순한 추세 상태를 트리거할 수 있습니다.
MT5 버전 더 보기: Zero Lag Liquidity MT5 Scanner MT4 버전 더 보기: Zero Lag Liquidity MT4 Scann

Volume Profile은 전문 및 기관 트레이더가 사용하는 가장 강력한 분석 도구 중 하나입니다. 거래가 발생한 시간만 화면 하단에 표시하는 기존 거래량 지표와 달리 Volume Profile은 해당 거래가 발생한 정확한 가격 수준을 보여줍니다. 이를 통해 시장 구조에 대한 명확한 X-ray 뷰를 제공하여 스마트 머니(smart money)와 기관이 포지션을 축적하거나 분배하는 위치를 정확히 확인할 수 있습니다. Volume Profile이 기관 주문 및 Support/Resistance를 감지하는 방법 이 지표는 가격 척도에 대해 가로로 거래량을 플로팅하여 실제 과거 거래를 기반으로 진정한 수요 및 공급 영역을 자연스럽게 드러냅니다. 표준 Volume Profile 규칙을 기반으로 시장을 읽는 방법은 다음과 같습니다. Point of Control (POC): 선택한 기간 내에 거래량이 가장 많은 특정 가격 수준입니다. POC는 구매자와 판매자 모두가 수용하는 가장 공정한 가격

MT4용 Crypto_Forex 지표 "Major_Trend_Histogram", 리페인트 불필요 - 주요 추세 히스토그램 지표는 매우 큰 추세를 포착하도록 설계되었습니다. - 지표는 두 가지 색상으로 제공됩니다. 약세 추세는 분홍색, 강세 추세는 녹색(색상 변경 가능)입니다. - 초기 단계의 추세를 감지하여 일반적인 이동평균선(MA)보다 훨씬 효율적입니다. - 주요 추세 히스토그램은 가격 움직임, VSA, 기타 지표 등 다른 거래 방식과 결합할 수 있습니다. - 지표에는 모바일 및 PC 알림 기능이 내장되어 있습니다. Click here to see high quality Trading Robots and Indicators! MQL5 웹사이트에서만 제공되는 오리지널 제품입니다.
MetaTrader 마켓 - 트레이더를 위한 로봇 및 기술 지표는 거래 터미널에서 바로 사용할 수 있습니다.
The MQL5.community 결제 시스템은 MQL5.com 사이트의 모든 등록된 사용자가 MetaTrader 서비스에서 트랜잭션을 수행할 수 있습니다. 여러분께서는 WebMoney, 페이팔, 또는 은행 카드를 통해 자금을 예치하거나 인출하실 수 있습니다.
