MetaTrader 4용 유료 기술 지표 - 12
This is a multi timeframe version of the Supply and Demand indicator . It allows you to analyze a chart using the law of supply and demand on three different timeframes at a time. You will see zones of sales and purchases and determine the most profitable points to open positions. The indicator is based on the principle of market fractality. Supply and demand zones show places where a strong buyer or seller has made the price reverse and change its direction. The indicator has several types of

A new trend determination algorithm has been developed for this indicator. The algorithm with acceptable accuracy generates input signals and output levels. Strategy for trend trading, filtering and all the necessary functions built into one tool! The principle of the indicator’s operation is to automatically determine the current state of the market when placing it on a chart, analyze historical data based on historical data and display instructions for further actions on the screen to the trad

The market is unfair if only because 10% of participants manage 90% of funds. An ordinary trader has slim changes to stand against these "vultures". This problem can be solved. You just need to be among these 10%, learn to predict their intentions and move with them. Volume is the only preemptive factor that faultlessly works on any timeframe and symbol. First, the volume appears and is accumulated, and only then the price moves. The price moves from one volume to another. Areas of volume accumu
if you want more information please pm me
HI guys this my developing indicator 1st version alert logic work well.. this indicator using can you stronger currency and top weaker currency find well,this;s indicator multy MTF time frame strength work.very good for SL trend screener intraday trader and long time trader, very easily can you watch stronger and weaker index.I hope to more improve this future further,thank you
Please feel free to contact me if you need any further information.
Please let me know if you have any questions.
I hope the above is useful to you. MT Magical : is a swing trade and trend and supply&demand strategy through signal filtering with experience. We worked really hard on this project. But it's worth it for investors.
signals uses our secret formula to perform complex calculations to get good results.
TRADE: Forex
TIME FRAME: All Time Frame
SYMBOL PAIR: All Symbol, Rec

This Scanner Dashboard uses the Extreme TMA System Arrows Indicator to show good BUY/SELL signals. This Product contains dashboard only. It does not contain the Abiroid_Arrow_Extreme_TMA.ex4 indicator. Arrows indicator is not necessary for dashboard to work. To see arrows, you can buy the arrows indicator separately if you like: https://www.mql5.com/en/market/product/44822
Dash shows Slopes for current and Higher Timeframes. - 1st diamond is current TF. Next diamonds are higher TFs
(Please N

Mystic Arrow - уникальный авторский индикатор, отображающий сигналы в направлении основной тенденции, и против нее. Благодаря разнообразию настроек и фильтров индикатор можно настроить под свой стиль торговли. Mystic Arrow подходит для любого таймфрейма, валютной пары. Сигналы индикатора не пропадают ни при каких условиях. Отличительной особенностью является возможность настроить сигналы индикатора отдельно для тенденции и против нее. Имеет в качестве отключаемого фильтра показания ценового кан

BeST_ Elliot Wave Oscillator Strategies is an MT4 indicator which by default is the difference of two SMAs displayed as a histogram fluctuating around zero while a Signal Line generates Entry Signals either in a Reverse or in a Normal Mode and it is a very powerful tool that very often exploits huge market movements. Signal Line comes in 2 types: Advanced Get Type – like the corresponding one used in the homonym analysis package Mov. Average Type – as a Moving Average of the Elliot Oscillator I

Was: $49 Now: $34 Blahtech Better Volume provides an enhanced version of the vertical volume bars. Each bar is compared to the previous 20 bars. Depending on its volume, range and volume density it will be assigned a state and colour. Low Volume – Minimum volume High Churn – Significant volume with limited movement Climax Neutral – High volume with unclear direction
Climax Up – High volume with bullish direction Climax Dn – High volume with bearish direction Climax Churn – High vol

Discrete Trend determines the dominant trend. The innovative algorithm allows the indicator to automatically adapt to any timeframe and currency pair completely eliminating the need for manual adjustments. The indicator works on bar closings. Thus, it is advisable to consider signals on the already formed candles. The product can be used both as a filter and as a main indicator.

Indicator MT4 : RSI MA is Moving average of strength index
Objective : Find entry price for the good trade
How to set up indicators RSI MA : 1. RSI period 14. 2. MA you can set calculate price and method price. 3. MA period 9. 4. Arrow setting : 6 types. 5. Alert setting : Next bar or Instant bar. 6. Choose display for 1 or 2 calculation by formula.
How to trade for success : Entry point : Buy / Long position 1. When arrow up direction show 2. TP : RSI OVB
Entry point : Sell / Short posi

Lets dabble a bit into Elliot Waves.
This is a simple indicator which tries to identify Wave 1 and 2 of Elliot Impulese Wave and then projects for Wave 3.
Ratios are taken from below link: https://elliottwave-forecast.com/elliott-wave-theory/ - Section 3.1 Impulse
Wave 2 is 50%, 61.8%, 76.4%, or 85.4% of wave 1 - used for identifying the pattern. Wave 3 is 161.8%, 200%, 261.8%, or 323.6% of wave 1-2 - used for setting the targets
Important input parameters MaximumNumBars : To calculate

Calculate your account's consistency rule in one click! Works for all HFT Prop Firms: - Nova Funding - Infinity Forex Funds - KortanaFx - Next Step Funded - Quantec And many more! --------------------------------------------------- Settings: profitConsistencyPercentage = Max profit limit per order (%) according to your prop firm. lowerRangePercentage - Lowest range for lot size (%) according to your prop firm. upperRangePercentage - Upper range for lot size (%) according to your prop firm.
--
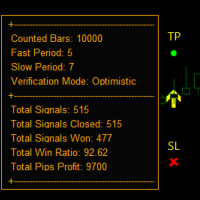
3개의 이동 평균 교차 전략을 기반으로 Statistic Arrow는 차트에 그려진 포인트의 tp 및 sl을 사용하여 매수 및 매도 신호를 제공하며, 승률과 종료된 거래 수, 승리한 수, 획득한 수를 보여주는 백 테스트 대시보드와 함께 제공됩니다. 손실, 최종 이익 창출, 표시기는 BAR OPEN의 tp 및 sl 측면을 따라 화살표를 인쇄하고 사전 경고를 제공합니다.
==========================================================================================================================
매개변수는 설정 스크린샷에 표시되고 설명됩니다.

The Signal Envelopes indicator uses the robust filtering method based on: (1) the moving median Buff0 = <Median> = (Max {x} + Min {x}) / 2 and (2) the averaging algorithm developed by the author Buff1 = <(<Median> ) ^ (- 3)> * (<Median>) ^ 4 based on the moving median. The Signal Envelopes indicator allows you to most accurately and with the minimum possible delay set the beginning of a new trend. The Signal Envelopes indicator can be used both for trading according to scalpe
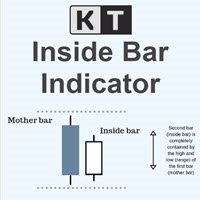
KT Inside Bar plots the famous inside bar pattern in which the bar carries a lower high and higher low compared to the previous bar. The last bar is also known as the mother bar. On smaller time-frames, the inside bar sometimes appears similar to a triangle pattern.
Features
Also plots entry, stop-loss, and take-profit levels with the inside bar pattern. No complex inputs and settings. Erase unwanted levels when the price reaches the entry line in either direction. All Metatrader alerts incl

Questo indicatore fractal ti invierà un messaggio telefonico (tramite app mt4) non è necessaria la configurazione dell'indicatore, basta impostare l'ID del tuo smartphone e potrai ricevere il messaggio BUY o SELL in tempo reale (affidabilità 80%)
per qualsiasi domanda o dubbio non esitate a contattarmi su mql5.com o telegram (link al gruppo disponibile in bio)

Iterative Moving Average – IMA. IMA is obtained by correcting the usual MA. The correction consists in addition to MA averaged difference between the time series (X) and its MA, i.e. IMA(X)=MA(X) + MA ( Х -MA(X)). Correction is done in several iterations (and, exactly, 2 iterations in this indicator) and with a change in the averaging period. As a result, the time-series points begin to cluster around (on all sides) of the getting IMA and with a smaller de
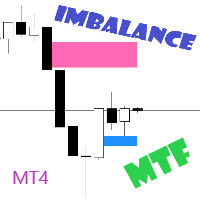
Imbalance / FVG MTF Mark Imbalance on chart of Selected Multi Time frames. Trend is Manually set to filter signals in the chosen direction by a button on the chart. .
Futures Auto Mark Imbalance / FVG on chart on selected time frames
Select time frames by buttons on chart
Popup Alert, Push Notification or email when New Imbalance Form
Popup Alert, Push Notification or email when Imbalance is Taken out
Select Alert Mode to be a single or multiple Imbalance ( OR / AND option ) when Imbalan

Contact me after payment to send you the user manual PDF file. Introduction The moving average indicator is the most well-known and one of the most popular indicators among traders. It is very simple to work with, but a basic question has always become a big challenge among traders: What is the most optimal setting of the moving average for each chart-time frame? The answer to this question is very difficult, you have to try different settings of the moving average indicator for different chart

This innovative technical indicator was created to detect quiet market period before the beginning of the high volatile market. Like many good technical indicators, this Market Activity Index is very stable and it is widely applicable to many financial and non financial instruments without too much restriction. The Market Activity Index can be used best to visualize the alternating form of low and high volatile market. It is very useful tool to pick up the quiet market but ironically this is the
DESCRIPTION:
Account Information Panel v1.1 is a MT4 (MetaTrader 4) indicator, and it is an excellent tool to track and analyze your investments monthly under an investor's view to help investors/traders understand their investment/trading quickly without spending hours to do manual calculation. FEATURES:
Display a basic information Balance Equity Margin Free margin Margin level Leverage Swap (long/short) Spead Current DD (drawdown) Active positions (long/short, lot, profit/loss) Display we
가격 조치 표시기 MT4는 지정된(기본적으로 8개) 과거 양초의 순수한 가격 조치 데이터를 기반으로 모든 기호/상품의 구매/판매력 수준 균형을 계산합니다. 이는 지표 패널에서 사용할 수 있는 32개 기호/상품의 가격 움직임을 모니터링하여 가장 가까운 시장 심리를 제공합니다. 60% 이상의 매수/매도 수준은 특정 기호(기본 설정 사용)를 매수/매도할 수 있는 매우 견고한 수준을 제공합니다. 가격 행동 표시기 MT4에는 가격 행동에 대한 표준, 빠르거나 느린 근접에 사용할 수 있는 3가지 계산 모드가 있으며 실시간 움직임에 더 날카롭거나 부드러운 적응을 위해 조정 가능한 가격 행동 초를 제공합니다.
가격 조치 표시기 MT4는 가장 눈여겨보고 거래하고 싶은 쌍을 추가하여 32개의 기호 버튼을 개인 취향에 맞게 구성할 수 있는 옵션을 제공합니다. 이렇게 하면 한 번의 보기로 차트의 현재 시장 심리를 전체적으로 볼 수 있기 때문에 기회를 절대 놓치지 않을 것입니다. 또한 현재 시간 프레

25% off. Original price: $40 RSI Scanner is a multi symbol multi timeframe RSI dashboard that monitors Relative Strength Index indicator for price entering and exiting overbought and oversold in up to 28 symbols and 9 timeframes.
Download Demo here (Scans only M1 and M5) Settings description here MT5 version here
RSI Scanner features: Signals RSI entering and exiting the overbought and oversold zones. Monitors 28 customizable instruments and 9 timeframes at the same time. You can choos
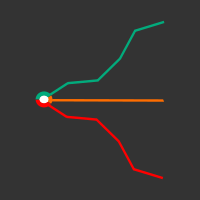
The Spread Ratio indicator allows you to view the ratio between the value of one instrument and another in order to operate with spread trading techniques.
In the image we can see an example of the Spread Ratio indicator on the Brent Oil and Crude Oil instruments. As we see from the image, the Spread Ratio indicator shows the trend of the ratio between these two instruments, allowing us to grasp the misalignments and realignments of the prices.
It is also possible to combine the Spread Rati
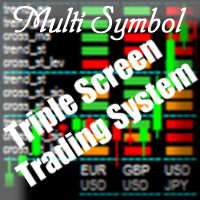
Purpose The indicator is intended for manual multi-currency trading based on the Triple Screen Strategy. It works with any symbols located in the Market Watch window of the MT4: currencies, metals, indexes, etc. The number of instruments can be limited by capacity of the МТ4's parameters. But if desired, you can create several windows with various set of instruments and parameters.
Operation Principle The indicator uses the modified Triple Screen Strategy for determining trend direction in the

This scanner shows the trend values of the well known indicator Parabolic SAR for up to 30 instruments and 8 time frames. You can get alerts via MT4, Email and Push-Notification as soon as the direction of the trend changes.
Important Information How you can maximize the potential of the scanner, please read here: www.mql5.com/en/blogs/post/718074
You have many possibilities to use the scanner. Here are two examples: With this scanner you can trade a top-down approach easily. If two higher t

With the SR Dashboard, you get a powerful tool to control some of the most important information in trading. Assemble a setup according to your strategy and get informed as soon as this setup is valid. Assign scores to defined conditions and let the Dashboard find them. Choose from Trend, Average Daily Range, RSI, Moving Averages, Pivot (Daily, Weekly, Monthly), Highs and Lows, Candlestick Patterns. Note: This indicator cannot be used in the Strategy Tester. The demo version here from the marke

Point Trend Indicator - An indicator of the upper and lower level of the trend, which can determine the trend direction and indicate its strengthening. The trend direction is determined by round dots; if the points are above the zero line, the trend is bullish; if below, the trend is bearish. The increase in directional movement is indicated by arrows. It has the only parameter for manual adjustment - Duration of the trend direction.
Possibilities
Works on all time frames Adapts to any fin

Up Down trend - determines the trend itself. Correct identification of the trend determines 95% of trading efficiency. And if a trader always accurately determines the direction of the trend, then he will only have to wait for corrections in the direction of the trend and open trades. In any trading strategy you need to correctly identify the trend. If the trend is not defined correctly, the trader will not be able to effectively enter the market and most likely the trading result will be negat

Currency RSI Scalper - is a professional indicator based on the popular Relative Strength Index (RSI) indicator. Although the RSI indicator works fine for an interval of the market, it fails to generate profitable signals when the market conditions change, and hence it produces wrong signals resulting in big losses. Have you ever thought about an adaptive RSI indicator that adapts its based on the market conditions? The presented indicator implements an optimization algorithm that finds the
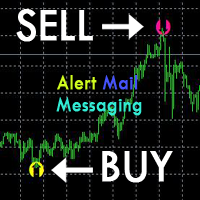
[ZhiBiZZD_MT4] The indicator is suitable for all cycles and is suitable for all market varieties.
[ZhiBiZZD_MT4] The downward arrow is the signal of (Sell).
[ZhiBiZZD_MT4] The upward arrow is the signal of (Buy).
[ZhiBiZZD_MT4] can be set in the parameters (Alert, Send mail, Send notification), set to (true) to send instant signals to the alarm window, email, instant messaging.
Parameter setting description:
[alert_NO_OFF]: This is the alarm switch, set to true, if the arrow appears, i
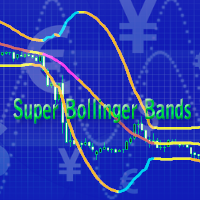
This is a forward-looking indicator for trading on all instruments. An advanced version of Bollinger Bands indicator created by outstanding analyst John Bollinger. One of the main differences of Super Bollinger Bands indicator from its predecessor consists in displaying upper and lower bands behavior on the middle line with some specific colors. Thus, the indicator gives a trader some visual information about trend development at the moment, and not in the past, as majority of other indicators d

MT4용 외환 표시기 PINBAR 패턴
지표 "PINBAR 패턴"은 가격 행동 거래에 대한 매우 강력한 지표입니다. 다시 칠하지 않고 지연도 없습니다. 표시기는 차트에서 PinBar를 감지합니다. Bullish PinBar - 차트의 파란색 화살표 신호(그림 참조) Bearish PinBar - 차트의 빨간색 화살표 신호(그림 참조) PC, 모바일 및 이메일 알림이 포함되어 있습니다. 지표 "PINBAR 패턴"은 지원/저항 수준과 결합하는 데 탁월합니다: https://www.mql5.com/en/market/product/100903
// 더 훌륭한 전문가 자문 및 지표는 여기에서 확인할 수 있습니다: https://www.mql5.com/en/users/def1380/seller // 또한 수익성 있고 안정적이며 신뢰할 수 있는 신호 https://www.mql5.com/en/signals/1887493에 참여하실 수 있습니다. 본 MQL5 홈페이지에서만 제공되는 오리지
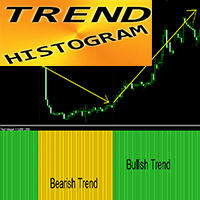
MT4용 외환 지표 "TREND 히스토그램"
TREND 히스토그램 표시기는 표준 MA 크로스보다 훨씬 더 민감하고 효율적입니다. 지표는 2가지 색상이 있습니다: 약세 추세는 노란색(금색), 강세 추세는 녹색(색상은 설정에서 변경 가능) TREND Histogram에는 모바일 및 PC 알림이 내장되어 있습니다. 이 지표를 가격 조치, VSA, 기타 지표와 같은 다른 거래 방법과 결합하는 것이 좋습니다.
// 더 훌륭한 전문가 자문 및 지표는 여기에서 확인할 수 있습니다: https://www.mql5.com/en/users/def1380/seller // 또한 수익성 있고 안정적이며 신뢰할 수 있는 신호 https://www.mql5.com/en/signals/1887493에 참여하실 수 있습니다.
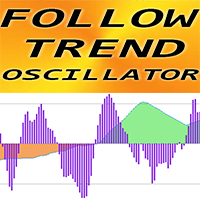
"Follow Trend Oscillator" - 고급 맞춤형 지표이자 효율적인 거래 도구입니다!
사용자 친화적인 지표는 주요 추세 방향으로 스캘핑할 수 있는 기회를 제공합니다. 신호 히스토 부분이 있는 부드럽고 조정 가능한 발진기 상승 추세는 녹색 오실레이터, 하락 추세는 갈색 과매도 값: -30 이하; 과매수 값: 30 이상 이 지표를 사용하면 표준 전략도 업그레이드할 수 있는 기회가 많이 있습니다.
// 더 훌륭한 전문가 자문 및 지표는 여기에서 확인할 수 있습니다: https://www.mql5.com/en/users/def1380/seller // 또한 수익성 있고 안정적이며 신뢰할 수 있는 신호 https://www.mql5.com/en/signals/1887493에 참여하실 수 있습니다. 본 MQL5 홈페이지에서만 제공되는 오리지널 제품입니다.
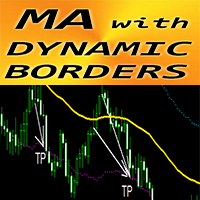
MT4용 외환 지표 "동적 테두리가 있는 MA"
지표에는 이동 평균 - 동적 변동성 경계에 고유한 기능이 첨부되어 있습니다. 동적 변동성 경계는 계산을 위해 평균 실제 범위 값을 사용합니다. 이 지표는 TakeProfit 타겟팅 및 보더 라인의 SL 배열에 적합합니다. 표시기는 가격 조치 항목과도 결합하는 데 탁월합니다. ............................................................................................................................................. // 더 훌륭한 전문가 자문 및 지표는 여기에서 확인할 수 있습니다: https://www.mql5.com/en/users/def1380/seller // 또한 수익성 있고 안정적이며 신뢰할 수 있는 신호 https://www.mql5.com/en/signals/1887493에 참여하실 수 있습니다.

The ICT Concepts indicator regroups core concepts highlighted by trader and educator "The Inner Circle Trader" (ICT) into an all-in-one toolkit. Features include Market Structure (MSS & BOS), Order Blocks, Imbalances, Buyside/Sellside Liquidity, Displacements, ICT Killzones, and New Week/Day Opening Gaps. It’s one kind of Smart money concepts. USAGE: Please read this document ! DETAILS Market Structure Market structure labels are constructed from price breaking a prior extreme

G-Ca$H IC Breaker (Source and Breaker Order Block Indicator) If you need support you can message via profile please check out the video and description where I try to answer the most common issues and how to use indicator there is also another short video i have made here https://youtu.be/yB9VutPfr-A We want to help you get the most out of the indicator and we like helping our customers . Please also see our other product https://www.mql5.com/en/market/product/58535?source=Unknown%3Ahttps

Elliott Wave Indicator
Perfect for trading Stocks, Futures, Forex & Crypto The Elliott Wave Indicator Suite is designed around a simple but effective Swing Trading strategy. The Indicator Suite is great for Stocks, Futures and Forex trading on multiple time-frames.
By subscribing to this indicator, you will get: Automatic Elliott Wave Count Elliott Wave Isolation High Probability Pull Back Zones Special 5-35 Oscillator 6/4 Moving Average High and Low's for trade entry and management Autom

Scanner Dashboard for Best Heiken Ashi VQZZ Arrows Indicator here: https://www.mql5.com/en/market/product/45900 Updated description and all extra indicators/templates are here: https://abiroid.com/extras/best-heiken-ashi-vqzz-system-extras
Please note that if you are using too many pairs/timeframes, then VQZZ calculations might slow down the dashboard. So be careful not to use too many VQZZ Higher timeframes if you are using too many pairs.
Dashboard Symbols:
Please refer to Screenshots f
The SD Indicator is a powerful tool in the world of Forex trading, that combines two classical strategies: Support/Resistance levels and Supply/Demand zones. The indicator helps traders to identify potential trading opportunities in the market with high accuracy.
Support and resistance levels are key price levels where buying and selling pressure converge, leading to potential price reversals. The SD Indicator identifies these levels in real-time and provides traders with a clear picture of wh

The Nihilist 5.0 Indicator includes Forexalien and Nihilist Easy Trend trading strategies and systems. It is composed of an MTF Dashboard where you can analyze the different input possibilities of each strategy at a glance. It has an alert system with different types of configurable filters. You can also configure which TF you want to be notified on your Metatrader 4 platform and Mobile application
The indicator has the option to view how could be a TP and SL by using ATR or fixed points, even

Defining Range ( DR ) and Implied Defining Range ( IDR ) indicator Pro with added features from free version
Show DR and IDR ranges Sessions on the chart for RDR Regular defining range (New York Session)
ADR After defining range (Asian session) ODR Outside defining range (London Session)
Buttons on chart to enable / disable :
Show Imbalance ( IMB ) Show Volume Imbalance ( VIB ) Show Gap's between open and close
Show Standard Deviation ( SD )
Show last 3 Sessions
mt4(Metatrader 4)용 스캘퍼 신호 Tarek 지표는 일일 차트를 포함해 어떤 시간대의 모든 통화 쌍에 대한 스캘핑 신호를 제공합니다.
이 지표는 매우 안정적이고 가벼우며 거래 플랫폼의 속도를 늦추지 않습니다.
신호는 녹색 및 빨간색 신호 화살표 형태로 메인 MT4 차트 창에 나타납니다.
매수 및 매도 신호:
차트에 녹색 화살표가 인쇄되면 매수 포지션을 개시하세요. 차트에 빨간색 화살표가 인쇄되면 매도 포지션을 엽니다. 거래당 7~40핍 수익을 목표로 하세요(선택한 기간에 따라 다름). Scalper Signal Tarek 지표는 거래 진입 및 청산 모두에 사용하거나 추가 단기 추세 필터로 사용할 수 있습니다.
이 지표는 모든 통화 쌍(메이저, 마이너 및 이국)에서 동일하게 작동하며 올바르게 사용하면 유망한 결과를 보여줍니다.
거래 팁:
Forex Scalper Signal 지표로 거래할 때 자신이 선호하는 거래 항목, 손실 중지 및 이익 실현
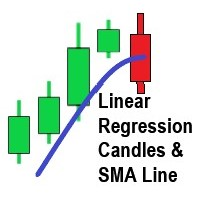
This indicator for MT4 is based on the currently popular indicator on Trading View of the similar name. The beauty of the indicator like Heiken Ashi is it removes a lot of market noise. 4 (OHLC) arrays are filled with Linear Regression(LR) values of each price for the LR period. The period of the Linear Regression is an input which must be higher than 2 (it's defaulted to 2 if you try an enter 1). The period of the Linear Regression is adjustable dependant on the market conditions. The SMA also
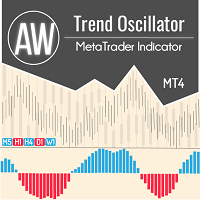
고급 필터링 시스템을 갖춘 트렌드 오실레이터. 추세, 약화 및 강화를 결정합니다. 멀티 타임프레임 패널이 내장되어 있습니다. AW Trend Oscillator는 모든 시간대와 기호(통화, 지수, 석유, 금속, 주식)에서 작동합니다. MT5 version -> HERE / Problem solving -> HERE 기능 및 이점:
고급 추세 필터링 한 번의 클릭으로 표시기의 감도 변경 쉬운 설정 다중 시간 프레임 패널 패널 이동 및 최소화 기능 모든 기호 및 시간 프레임에서 작동합니다. 모든 종류의 알림 입력 설정: 표시기의 주기 - 표시기의 주기는 값이 클수록 표시기 신호의 민감도가 낮아지고,
푸시 알림 보내기 - 거래자 단말기의 모바일 버전에 새로운 신호 알림을 사용하고,
팝업 알림 보내기 - 알림 시 소리 알림 사용,
이메일 보내기 - 거래자의 이메일로 신호의 출현에 대한 이메일 보내기를 사용합니다.
다중 시간 프레임 패널 표시 - 패널 표시 활성화,
다중 시

MT4 Multi-timeframe Order Blocks detection indicator. Features - Fully customizable on chart control panel, provides complete interaction. - Hide and show control panel wherever you want. - Detect OBs on multiple timeframes. - Select OBs quantity to display. - Different OBs user interface. - Different filters on OBs. - OB proximity alert. - ADR High and Low lines. - Notification service (Screen alerts | Push notifications). Summary Order block is a market behavior that indicates order collection

The dollar index is a reliable guide for all currency pairs with the participation of the dollar USD. The indicator helps to filter out false reversals and trade strictly according to the trend. Determines the current direction of the dollar index and the trend change point. It warns with an arrow on the chart and an alert about a trend change. Ready to work with default settings. It is possible to adjust the sensitivity of the trend line. Important
It is strongly discouraged to open a trading
소개:
"Turning Zone"은 거래자에게 금융 시장 내에서 잠재적인 추세 반전을 감지할 수 있는 강력한 도구를 제공하도록 설계된 정교하고 혁신적인 MT4 지표입니다. 시대를 초월한 갈퀴 분석 개념을 활용함으로써 Turning Zone 지표는 시장 정서가 바뀔 가능성이 있는 주요 반전 영역을 식별하여 거래자에게 정보에 입각한 결정을 내릴 수 있는 귀중한 통찰력을 제공합니다. MT5 버전 : WH Turning Zone MT5
관련상품 : WH Trend Continuation MT4
주요 특징들:
갈퀴 분석. 반전 확률. 시각적 선명도. 사용자 지정 옵션. 실시간 알림.
사용하는 방법 :
옵션 1: 가격이 터닝 존에 도달할 때까지 기다렸다가 존 위/아래에서 고유한 진입 규칙, 정류장 및 타겟을 사용합니다.
옵션 2: 내 진입 규칙이 형성될 때까지 기다리십시오(빨간색/파란색 화살표로 표시). 중지되고 대상이 차트에 나타납니다.
정확한 추세

VR 시스템 은 단순한 지표가 아니라 금융 시장 거래를 위한 전체적으로 균형 잡힌 거래 시스템입니다. 이 시스템은 고전적인 거래 규칙과 지표 이동 평균 및 Donchian 채널 의 조합을 기반으로 구축되었습니다. VR 시스템 은 시장 진입 규칙, 시장 포지션 보유 규칙, 포지션 청산 규칙을 고려합니다. 간단한 거래 규칙, 최소한의 위험 및 명확한 지침은 VR 시스템을 금융 시장 거래자에게 매력적인 거래 전략으로 만듭니다. 설정, 세트 파일, 데모 버전, 지침, 문제 해결 등은 다음에서 얻을 수 있습니다. [블로그]
다음에서 리뷰를 읽거나 작성할 수 있습니다. [링크]
버전 [MetaTrader 5] 거래 시스템은 이동 평균과 Donchian 채널이라는 두 가지 결합 지표로 구성됩니다. Donchian 채널 – 금융 상품의 현재 상태를 결정하기 위해 설계되었으며 추세 또는 평면을 결정하는 고전적인 규칙에 따라 구성되었습니다. 새로운 로컬 최대값이 이전 것보다 높고, 새로운
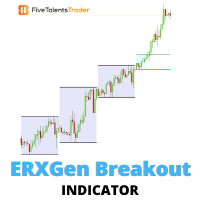
Without volatility, trading the financial market is close to impossible. Profit is made ONLY when the price is moving. The ERXGen (Early Riser Next Generation) system is a short-term trading technique built around the phenomenon that there are certain times during a trading day when the price volatility has the tendency to be high. In essence, ERXGen is based on the very popular London Open Breakout strategy, although with bespoke tried and tested rules that increase consistency and profitabilit

LordTrendSignal is a financial market indicator for Meta Trader that checks signals through trends and candles, works on all TimeFrames (M1, M5, M15, M30, H1, H4, D1).
LordTrendSignal checks the signal through trends and candles and informs you via notification, alerts via email and push on the automatic screen.
The trend flexibility of LordTrendSignal is high, however, together with other of our indicators LordAutoFibonacci and LordAutoTrendLine you will be able to work very well to obtain
LordOscilatorSignal is a financial market indicator for Meta Trader, which uses standard market indicators; Stochastic, Moving Average, MACD, MA Xover, P.SAR.
Exactly! this single indicator has the help and assistants of (5) indicators.
The LordOscilatorSignal has a graphic panel of great visualization and understanding, being able to observe the values of each indicator and timeframes.
LordOscilatorSignal identifies through the trends of the buying and selling indicators, if all indicato
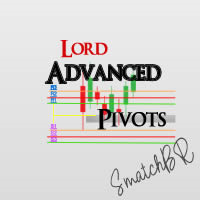
The LordAdvancedPivot Indicator is an indicator for META TRADER 4, with the function of analyzing the main daily channels of the currency pair, known as RESISTANCE, SUPPORT and PIVOT (center), to determine the levels at which market sentiment can change from "bullish" "to" low ".
Pivot points can be points that correspond to trend lines, Fibonacci levels, moving averages, previous highs / lows or closings and many more indicators, depending on the trader's philosophy.
LordAdvancedPivot has

About testing Mode step1.Copy the settings below into txt and save as presets file such as "QDT3.set" step2.Copy the presets file into the "tester" folder which is located in the MT4 root directory step3.Load the settings when testing the indicator step4.Use the tick data to test and adjust the test speed to 30
InpDivideLine1=*******************************通用设置******************************* InpTheme=2 InpSHIcon=0 InpShowSHIcon=true InpShowOnRight=true InpShowMainTabByClickAutoHide=true In
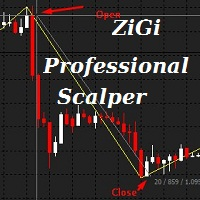
ZiGi Professional Scalper Indicator: Real Wave Analysis Tool This indicator reveals the true waves of the market by identifying alternating highs and lows on the price chart, thus displaying the market's wave structure. The algorithm of this indicator is entirely new, and its association with ZiGi Professional Scalper and Zigzag is purely cosmetic. It is based on eight radically different algorithms and is capable of calculating market volumes in real-time. When using this indicator, manual wave

The Market Profile Indicator for MT4 displays the price levels and zones where increased trading activity happens. These zones with substantial forex trading activity provide the forex traders with the best entry levels, support, and resistance levels. Moreover, price levels indicate the best reversal zones. As a result, forex traders can identify BULLISH and BEARISH market trends and BUY and SELL entry points as well as the best reversal points. The indicator works well in all intraday timefram

Introducing the "Magic Trades" for MetaTrader 4 – your ultimate tool for precision trading in dynamic markets. This innovative indicator revolutionizes the way you perceive market trends by harnessing the power of advanced analysis to detect subtle changes in character, paving the way for optimal trading opportunities.
The Magic Trades Indicator is designed to empower traders with insightful entry points and well-defined risk management levels. Through its sophisticated algorithm, this indica

All about Smart Money Concepts Strategy: Market struture: internal or swing BOS, CHoCH; Orderblock; Liquity equal; Fair Value Gap with Consequent encroachment, Balanced price range; Level with Previous month, week, day level or in day level (PMH, PWH, PDH, HOD); BuySell Stops Liquidity (BSL, SSL); Liquidity Void Long Wicks; Premium and Discount; Candle pattern ... "Smart Money Concepts" ( SMC ) is a fairly new yet widely used term amongst price action traders looking to more accurately navigate

The Market Sessions Indicator for MT5 helps you predict market turnarounds by detecting major supply and demand areas. These pivot points tend to occur after a new session has started and the previous one is still open. It is also used to gauge how many points or pips the market moves on average during a session. This helps us to place better our take profits and stop losses. The indicator works on all forex pairs, gold, silver, commodities, stocks, indices and any other instrument that your
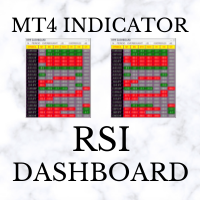
RSI Dashboard uses the value of Relative Strength Index indicator. The parameters can be adjusted via the Edit boxes of this dashboard. The monitoring pairs will be selected by adding to the Market Watch (no need to set prefixes or suffixes) , you can monitor many pairs as you like. This dashboard will check almost popular time frame (M1,M5,M15,M30,H1,H4 and D1). The colors can be customized. We can have a look at many pairs and many time frames without opening the chart. In addition, we can

Description
Trend Influencer is an indicator that determines the potential dynamics of the influence of trend wave movements on the market. The indicator is based on the value of moving averages corrected by the standard deviation. The indicator is displayed as a main dash-dotted moving average and a signal solid moving average. The signal moving average is colored blue or red depending on what type of trend is currently observed in the market. The indicator also draws inhibition levels - blue

Imbalance / Fair Value Gap (FVG), this is a zone / gap created when the price move with force in a given direction. It identify a zone where the price could potentially go back. This gives perfect targets for your trades.
Imbalance is created from the high and low of 3 candles. When the wicks the of 1st and 3rd candle does not fully overlap the middle one.
This indicator will help you to easily spot mitigated/unmitigated imbalances in your chart.
NEW FEATURE Update: Multi-TimeFrame Feat

GOLDEN RETRACEMENT POWER indicator draws fibonacci levels automatically. Defines the golden entry buy/sell area, support and resistant lines , signals arrows and strength 'Power Bars Level' based on price action . Some indicators also work behind the chart: Stochastic,RSI,MFI,DeMarker and WPR . Fibonacci retracements are a popular form of technical analysis used by traders in order to predict future potential prices in the financial markets. If used correctly, Fibonacci retracements and ratios c
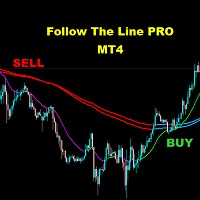
FOLLOW THE LINE (PRO VERSION) This powerful indicator is the full and complete version of my free indicator called "Follow The Line". IT IS BASED ON the popular maxim that: "THE TREND IS YOUR FRIEND" It gives alarms and alerts of all kinds. IT DOES NOT REPAINT and can be used for all currency pairs and timeframes.
AVOID FALSE SIGNALS:
BUY ONLY when price closes above the green line and the green line is above the blue channel.
SELL ONLY when price closes below the pink line and the pink lin

The indicator returning pivot point based trendlines with highlighted breakouts . Trendline caculated by pivot point and other clue are ATR, Stdev. The indicator also includes integrated alerts for trendlines breakouts and foward message to Telegram channel or group if you want. Settings · Lookback bar: Default 200 is number of bar caculate when init indicator. · Length: Pivot points period · Slope Calculation Method: Determines how this lope is calcula

Title: Best Trend Sniper Indicator - A Custom MQL4 Indicator for Spotting Potential Trends Description: Indicator Name: Best Trend Sniper Indicator Introduction: The "Best Trend Sniper Indicator" is a custom Meta Quotes Language 4 (MQL4) indicator designed to identify potential trends in financial markets. This indicator is intended to be used on Meta Trader 4 (MT4) trading platforms. Key Features: Non Repaint: The Best Trend Sniper Indicator is a non-repaint indicator, which means it does not

Wicks UpDown Target
Choppy movement up and down on the opening range every day. Trading breakouts on London session and New York session is recommended. Wicks UpDown Target is specialized in all forex pairs.
Guideline Entry Strategy Idea:
Step 1 - Breakout Forming (Warning! Trade on London Session and New York Session) Step 2 - Breakout Starting (Take Action on your trading plan) Step 3 - Partial Close your order & set breakeven (no-risk) Step 4 - Target complete Step 5 - Don't trade in
MT5 Version
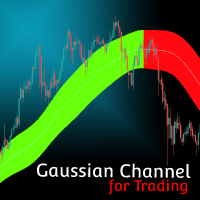
Gaussian Channel MT4 Gaussian Channel MT4 is the first indicator in the market that uses Ehlers Gaussian Filter methods to define trends. Nowadays, this Gaussian Channel is highly known as a method to support HOLD techniques in crypto. If the price is above the channel the trend is strong, if it comes back to the channel this can react as a resistance and indicate the beginning of a bear market (or Winter) if the price breaks below it. Eventhough the use of this channel focuses on
MetaTrader 마켓은 MetaTrader 플랫폼용 애플리케이션을 구입할 수 있는 편리하고 안전한 환경을 제공합니다. Strategy Tester의 테스트를 위해 터미널에서 Expert Advisor 및 인디케이터의 무료 데모 버전을 다운로드하십시오.
MQL5.community 결제 시스템을 이용해 성능을 모니터링하고 원하는 제품에 대해 결제할 수 있도록 다양한 모드로 애플리케이션을 테스트할 수 있습니다.
트레이딩 기회를 놓치고 있어요:
- 무료 트레이딩 앱
- 복사용 8,000 이상의 시그널
- 금융 시장 개척을 위한 경제 뉴스
등록
로그인
계정이 없으시면, 가입하십시오
MQL5.com 웹사이트에 로그인을 하기 위해 쿠키를 허용하십시오.
브라우저에서 필요한 설정을 활성화하시지 않으면, 로그인할 수 없습니다.