PAX Multi TMA HMA 8 for MT4
- 지표
- 버전: 8.30
- 업데이트됨: 2 7월 2023
- 활성화: 20

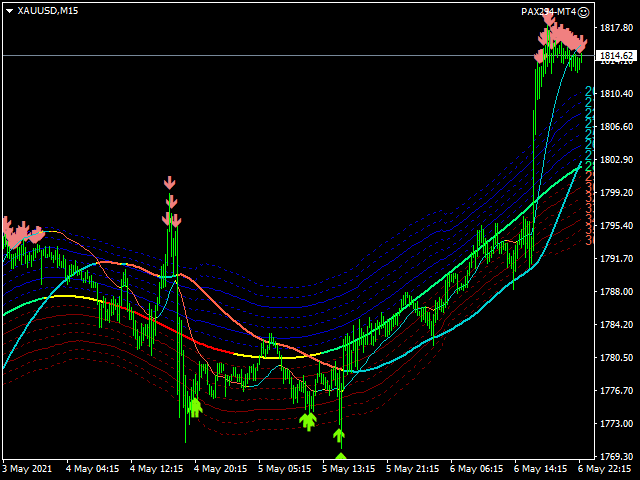
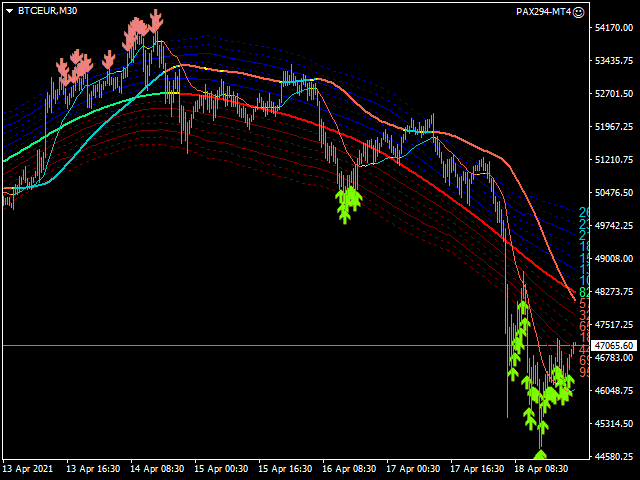
Trade system "PAX Multi TMA/HMA 8"
it is a ready-made trading system for trading on any instrument and any timeframe.
Completely ready for manual trading and use in robots.
Not redrawn.
It is convenient to work on timeframes M30, H1, H4.
Tested on metals, currency pairs, oil, international stocks, Russian stocks, cryptocurrencies, monetary and cryptocurrency indices.
What the trading system consists of:
1. The main channel of price movement named Medina.
May be of 3 colors:
red - downtrend,
yellow - the trend is changing,
green - a growing trend.
It can be based on the current timeframe or higher.
2. Laterals - lateral canals of the medina.
They clearly show how far the price bounced in order to make the right decision to open and close positions or build up the grid.
3. HMA lines.
Two Hull Moving Average lines automatically filter signals.
They can be based on the current or higher timeframes.
4. CCI filter (Commodity Channel Index)
Automatically filters unnecessary signals, allows you to reduce the balance drawdown.
5. Arrows - signals.
Shows where it is necessary to open a new position and close opposite orders.
6. Placard of the state of the price.
To the right of the chart, the distances in points from the Bid price to the corresponding channel lateral are displayed.
This makes it possible to understand how profitable the deal will be if you open an order at the current price.
Strategies for working with the trading system:
1. High profit.
Orders are opened at each arrow of the signal. The entire grid of orders is closed as soon as an opposite signal appears.
At this moment, you can open a reverse order.
2. Low risk.
Orders are opened only on the accompanying trend.
For example, if the arrow is green and the trend color is also green, you can open a buy order.
A new pyramiding order must be opened at the next green arrow, but not more often than 100 points later.
All orders are closed if the trend color has changed. In our example, the trend color turns yellow or red - close the order grid.
3. Opposite orders.
This strategy will reduce the drawdown of the account balance and minimize risks.
The strategy works on hedging accounts.
Orders are opened for each arrow.
And they close in the following order:
1. If a green arrow is encountered and the trend color is green or yellow, close all short orders.
2. If a red arrow is drawn and the trend color is red or yellow, close all long orders.
A detailed description of the trading system parameters can be found in the corresponding section of the help link into the indicator.
Here you can also send suggestions for the development of the system in the form of comments.
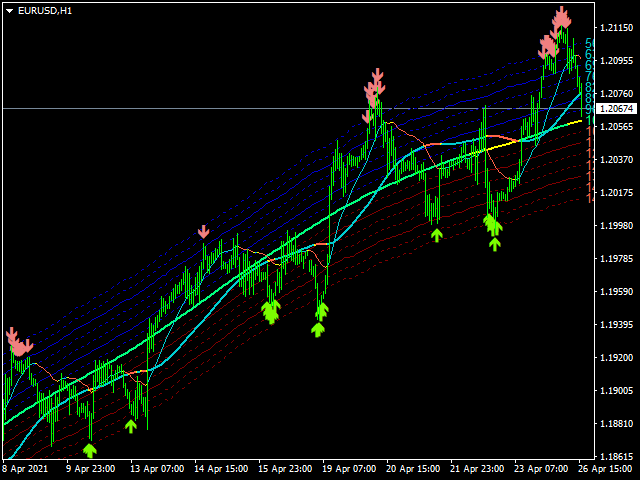


When price breaks above or below the outer band of the TMA, it is an excellent predictor for a price reversal. When used together with fractal level and market structure you have the tools for great success.