 MetaTrader 5
 Experts
 지표
지표
 라이브러리
라이브러리
 유틸리티
유틸리티
 위젯
위젯
 규칙
규칙
MetaTrader 4용 유료 기술 지표 - 5
 아래 나열된 기술 지표의 시그널은 MetaTrader 4 플랫폼의 거래를 열고 종료하는 데 중요한 역할을 합니다.
지표의 본질은 가격 변화를 예측하기 위한 금융 시그널 값의 수학적 변형입니다.
아래 나열된 기술 지표의 시그널은 MetaTrader 4 플랫폼의 거래를 열고 종료하는 데 중요한 역할을 합니다.
지표의 본질은 가격 변화를 예측하기 위한 금융 시그널 값의 수학적 변형입니다. 
MT4용 Crypto_Forex 지표 "재테스트 히스토그램", 리페인트 없음. - ReTest_Histogram 지표는 강력한 지지선/반지선(S/R) 재테스트 후 주요 추세 방향으로 진입 신호를 찾는 데 사용할 수 있습니다. - ReTest 히스토그램은 두 가지 색상으로 제공됩니다. 빨간색은 하락 추세, 녹색은 상승 추세입니다. - 동일한 색상의 히스토그램 열이 일정하게 연속적으로 나타나면 새로운 추세가 시작되었음을 의미합니다. - ReTest 신호는 히스토그램에서 반대 색상의 열 하나와 추세 색상의 다음 열 하나(그림 참조)입니다. - 지표에는 모바일 및 PC 알림 기능이 내장되어 있습니다. 지표 사용 방법: - 매수 신호의 경우: 일정하게 연속된 녹색 히스토그램(상승 추세) + 빨간색 열 하나(재테스트) + 녹색 열 하나(매수 포지션 개시). - 매도 신호: 안정적인 연속 빨간색 히스토그램(하락 추세) + 히스토그램의 녹색 열 1개(재테스트) + 빨간색 열 1개(공매도 포지션)
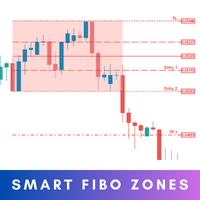
Smart Fibo Zones are powerful, auto-generated Fibonacci Retracements that are anchored to key market structure shifts . These zones serve as critical Supply and Demand levels, guiding you to identify potential price reactions and confirm market direction. Fibonacci calculations, widely used by professional traders, can be complex when it comes to identifying highs and lows. However, Smart Fibo Zones simplify this process by automatically highlighting order blocks and key zones, complete with St

Forex Bat Harmonic Dashboard 를 만든 이유는 여러 통화쌍과 타임프레임에 걸쳐 정확한 Bat 패턴을 수동으로 찾는 데 몇 시간이 걸렸고——그럼에도 계속해서 셋업을 놓쳤기 때문입니다. 이것은 진정한 Bat를 정의하는 핵심 XAD 88.6% 되돌림 을 포함한 엄격한 피보나치 비율 검증을 사용하여 전체 관찰 목록에서 Bat 하모닉 패턴 을 자동으로 감지하는 전문가급 멀티 심볼·멀티 타임프레임 스캐너입니다. 백그라운드에서 지속적으로 실행되며 모든 확인된 패턴을 하나의 깔끔하고 정리된 대시보드에 표시합니다. 모든 신호는 적절한 우측 확인(기본값 PivotRight = 5)과 함께 확정된 봉에서 확인됩니다. Bat 패턴이 대시보드에 나타나면 절대 사라지거나 변경되지 않습니다. Bat 패턴을 독특하게 만드는 것은? Scott Carney가 발견한 Bat 패턴 은 D 포인트가 XA의 정확히 88.6%를 되돌리는 5점 XABCD 하모닉 구조입니다——Gartle

Smart Market Structure Pro by G-Labs — ICT and Smart Money Concepts toolkit with built-in multi-symbol scanner for MetaTrader 5. Break of structure, change of character, order blocks, fair value gaps, liquidity sweeps, premium and discount zones, ICT sessions, confluence scoring, AI trade ideas, and a traffic-light scanner across up to 30 pairs and four timeframes from one chart.
Map SMC and ICT on the active chart while the built-in scanner monitors your full watchlist. Each cell shows BUY, SE

Binary Win 60는 M5(5분) 타임프레임에서 작동하도록 설계된 바이너리 옵션 거래를 위한 전문 도구입니다. 이 인디케이터는 다음과 같은 인기 있는 통화 쌍에 적합합니다: AUDCAD, AUDNZD, CHFJPY, EURCAD, EURAUD, EURCHF, EURGBP, EURNZD, GBPAUD, GBPJPY, GBPUSD, USDJPY. 주요 특징: 화살표 형태의 명확한 신호: 초록색 화살표: 매수 신호. 빨간색 화살표: 매도 신호. 즉각적인 알림: 팝업 알림. 소리 알림. 권장 만료 시간: 1 캔들 (5분). 장점: 높은 정확도: 역사적 테스트에서 60% 이상의 수익률. 테스트 품질: Dukascopy의 99% 정확도 데이터 사용. 선물:
구매 후 7일 이내에 MT4용 Expert Advisor(EA)를 받으세요. 자동으로 거래를 시작합니다. ️ 사용 방법: 차트에 인디케이터 설치. 신호(초록색 또는 빨간색
범위 및 다음 가능한 움직임 식별 | 추세의 초기 신호와 강도를 확인하세요 | 반전 전 명확한 출구 확보 | 가격이 테스트 할 피보 레벨 파악 비추적, 비지연 지표 - 수동 및 자동 거래에 이상적 - 모든 자산 및 모든 시간 단위에 적합 구매 후, 무료 TrendDECODER_Scanner를 받기 위해 저에게 연락해 주세요. MT5 버전: 여기를 클릭하세요 BladeSCALPER 및 PowerZONES 로 전체 방법을 확인하세요.
어떤 서비스인가요?
트렌드디코더는 추세 모니터링을 간단하고 쉽게 하기 위한 여러 혁신 기술의 집약체입니다.
투영 추세선(투영 추세선) - 다가오는 추세의 속도 기준 실시간 추세선과 투영 추세선 비교 - 시장이 이전과 같은 방향으로 움직이고 있는지, 아니면 둔화되고 있는지? 실시간 추세선 교차 - 추세가 궤도를 이탈하고 있습니다. 그레이박스 - 시장이 더 이상 추세가 아니며 새로운 전환기에 들어섰습니다. 디코더신

최고의 기관 마스터 시스템으로 거래 수준을 높이십시오 이 올인원 지표는 실시간 시장 알고리즘을 표시합니다. 시장에서 사용할 수 있는 가장 포괄적인 SMC(Smart Money Concepts) 및 ICT 도구를 사용하여 기관 거래의 세계로 들어가십시오. 차트를 여러 개의 무거운 지표로 복잡하게 만드는 대신 핵심 기관 거래 방법론을 하나의 강력하고 초경량이며 완전히 대화형인 마스터 시스템으로 엔지니어링했습니다. 데이 트레이더, 스캘퍼 또는 스윙 트레이더이든 관계없이 이 지표는 기관 알고리즘의 발자취를 추적하는 데 필요한 궁극적인 명확성을 제공합니다. 이 지표를 돋보이게 하는 주요 기능: 대화형 차트 대시보드(업그레이드됨): 진정한 차트 작성의 자유를 경험하십시오. 당사의 독점적인 대화형 대시보드를 사용하면 차트에서 직접 한 번의 클릭으로 특정 기능(OB, FVG, DOL, MS, KZ 및 PDA)을 켜거나 끌(ON/OFF) 수 있습니다. 지표 설정을 열지 않고도 작업 공간을 깨끗하게

Gold Channel is a volatility-based indicator, developed with a specific timing algorithm for the XAUUSD pair, which consists of finding possible corrections in the market.
This indicator shows two outer lines, an inner line (retracement line) and an arrow sign, where the theory of the channel is to help identify overbought and oversold conditions in the market.
The market price will generally fall between the boundaries of the channel. If prices touch or move outside the channel it is a tradi

Axiom Matrix는 MetaTrader 4용 전문 멀티 심볼, 멀티 타임프레임 시장 스캐너이자 의사결정 대시보드입니다. Axiom Matrix는 사용자의 Market Watch를 스캔하고, 여러 타임프레임을 분석하며, 여러 근거 엔진을 읽고, 가장 강한 기회를 비교하여 하나의 깔끔한 매트릭스 대시보드 안에서 최적의 BUY, SELL, WAIT 또는 차단 상태를 보여줍니다. 저는 무거운 시장 스캔 작업을 대신 처리해 줄 수 있는 하나의 도구가 필요했기 때문에 Axiom Matrix를 만들었습니다. 저는 RSI만 따로 확인하고 싶지 않았습니다.
그다음 MACD만 따로 확인하고.
그다음 이동평균.
그다음 거래량.
그다음 변동성.
그다음 지지와 저항.
그리고 하나의 트레이딩 아이디어를 만들기 위해 심볼과 타임프레임을 수동으로 계속 전환하고 싶지 않았습니다. 저는 시장을 스캔하고, 근거를 비교하고, 최고의 기회를 순위화하며, 지금 가장 강한 셋업이 어디에 있는지 알려주는 하나의 대시보

Artemis Gold M1 Scalper Artemis Gold M1 Scalper 는 XAUUSD 트레이더를 위해 특별히 제작된 프리미엄 MT4 인디케이터입니다. M1 시간대에서 골드 스캘핑을 보다 깔끔하고 구조적으로 접근하고 싶은 트레이더를 위해 설계되었습니다. 이것은 일반적인 화살표 표시 인디케이터가 아닙니다. Artemis는 동적 지지와 저항, 추세 확인, 모멘텀 필터링, ATR 기반 거래 레벨, 신호 품질 점수, 시장 상태 분석, 세션 강도, 활성 거래 보호, 그리고 깔끔한 대시보드를 하나의 집중된 스캘핑 프레임워크로 결합했습니다. 이 모든 것은 골드의 빠른 움직임에 맞춰 설계되었습니다. Gold M1에 다른 접근 방식이 필요한 이유 골드는 일반적인 외환 통화쌍보다 더 빠르고 강하게 움직입니다. M1 시간대에서는 이러한 변동성이 쉽게 노이즈가 많은 신호, 늦은 진입, 낮은 품질의 셋업으로 이어질 수 있습니다. 많은 스캘핑 인디케이터는 차트에 화살표를 과도하게 표시하거나,

Level Breakout Indicator is a technical analysis product that works from upper and lower boundaries, which can determine the direction of the trend. Works on candle 0 without redrawing or delays.
In its work, it uses a system of different indicators, the parameters of which have already been configured and combined into a single parameter - “ Scale ”, which performs gradation of periods.
The indicator is easy to use, does not require any calculations, using a single parameter you need to select
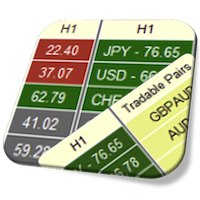
Currency Strength Meter is the easiest way to identify strong and weak currencies. This indicator shows the relative strength of 8 major currencies + Gold: AUD, CAD, CHF, EUR, GBP, JPY, NZD, USD, XAU. Gold symbol can be changed to other symbols like XAG, XAU etc.
By default the strength value is normalised to the range from 0 to 100 for RSI algorithm: The value above 60 means strong currency; The value below 40 means weak currency;
This indicator needs the data of all 28 major currency pairs a

Unlock key market insights with automated support and resistance lines Tired of plotting support and resistance lines? This is a multi-timeframe indicator that detects and plots supports and resistance lines in the chart with the same precision as a human eye would. As price levels are tested over time and its importance increases, the lines become thicker and darker, making price leves easy to glance and evaluate. [ Installation Guide | Update Guide | Troubleshooting | FAQ | All Products ] Boos
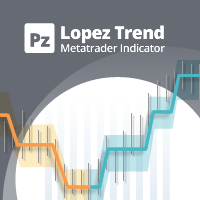
Noise filtering: the key to mastering trends
This indicator tracks the market trend with an unmatched reliability, by ignoring sudden fluctuations and market noise. It has been designed to trend-trade intraday charts and small timeframes. Its winning ratio is around 85%.
[ Installation Guide | Update Guide | Troubleshooting | FAQ | All Products ] Amazingly easy to trade Find oversold/overbought situations Enjoy noise-free trading at all times Avoid being whipsawed in intraday charts The indi

추측을 멈추세요. 통계적 우위로 트레이딩을 시작하세요. 주식 지수는 외환과 다르게 거래됩니다. 정해진 세션이 있고, 야간에 갭이 발생하며, 예측 가능한 통계적 패턴을 따릅니다. 이 지표는 DAX, S&P 500, 다우존스와 같은 지수를 자신 있게 거래하는 데 필요한 확률 데이터를 제공합니다. 무엇이 다른가 대부분의 지표는 무엇이 일어났는지 보여줍니다. 이 지표는 다음에 무엇이 일어날 가능성이 있는지 보여줍니다. 매 거래일마다 지표는 100일간의 과거 데이터를 기준으로 현재 설정을 분석합니다. 유사한 갭, 유사한 시가 위치를 가진 날을 찾고, 가격이 주요 레벨에 도달한 빈도를 정확히 계산합니다. 갭이 메워질지, 어제 고점이 테스트될지 더 이상 추측할 필요가 없습니다. 실제 데이터에 기반한 정확한 백분율을 얻게 됩니다. 모든 입력 설명이 포함된 전체 매뉴얼: https://www.mql5.com/en/blogs/post/766370 훌륭한 설정을 찾는 데 도움이 되는 전략 가이드: ht
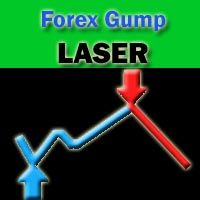
Friends, we present to your attention our new Forex Gump Laser indicator. Since there are no designers in our team, but mainly mathematicians, financiers, programmers and traders, we did not make any special changes in the indicator design. In appearance, it resembles the usual Forex Gump. On the other hand, Forex Gump has become not just the name of an indicator, it is a brand. And we try to preserve the corporate identity in all its varieties. The whole essence of the indicator in its operatio

A Renko patterns indicator for MetaTrader that turns every pattern into a complete trade plan: the entry, a stop loss beyond the pattern and three take profit targets, drawn on your Renko chart as soon as a closed brick confirms the breakout. It also keeps the score. A dashboard follows every past signal to its stop loss or exit, so you see how each of the 14 patterns has worked on your own symbol and brick size before you take the next signal. What you get 14 Renko chart patterns: Double Top an

Color Trend FX shows the current trend direction and marks entry points, trailing levels and possible exit points right on the chart. The indicator is built for traders who want to see where to open, get hints on when to close, and check how it performed on history. It can work as a standalone tool, as part of your own system, or as a base for your Expert Advisors. The indicator plots signals as colored dots that follow the trend and also act as trailing levels for open positions. When the move

Reversal Master helps you read the current direction of price movement and spot potential reversal points on the chart. It is built for traders who want a clearer view of the market situation before making a decision. You can use it as a standalone tool, as an add-on to a ready-made trading system, or as a building block for developing your own strategies. To locate reversal points, Reversal Master evaluates several market conditions at once, since combined analysis gives a more complete picture

러시아어 설명서 / 영어 설명서 / MT5 버전 주요 기능: 판매자와 구매자의 활동 영역을 표시합니다! 이 지표는 매수 및 매도에 대한 모든 올바른 첫 번째 임펄스 레벨/존을 표시합니다. 진입점 검색이 시작되는 이러한 레벨/존이 활성화되면 레벨의 색상이 바뀌고 특정 색상으로 채워집니다. 상황을 더욱 직관적으로 파악할 수 있도록 화살표도 표시됩니다. LOGIC AI - 템플릿 활성화 시 진입점 검색을 위한 영역(원) 표시 시각적 명확성을 개선하기 위해 인공지능을 사용하여 진입점을 검색한 영역을 표시하는 기능이 추가되었습니다. 더 높은 시간대의 레벨/존 표시(MTF 모드) 더 높은 시간 간격을 사용하여 레벨/존을 표시하는 기능이 추가되었습니다. 또한, 이 지표는 자동 추세 감지 기능( TPSproTREND PRO )을 구현했습니다. 거래를 위한 별도의 전문적인 단계별 알고리즘 이 알고리즘은 추세 방향과 반대 방향으로의 당일 거래 모두에 적합하도록 설계되었습니다. 각

이 표시기의 아이디어는 모든 시간 프레임에서 Murray 레벨을 찾아 강력한 Murray 레벨(+2, +1, 8, 4, 0, -1, -2)을 기반으로 하는 신호 레벨을 포함하는 콤보 레벨로 결합하는 것입니다. 기간이 짧을수록 콤보 레벨을 즉시 볼 수 있는 기회가 많아집니다. 색상으로 강조 표시됩니다. 숫자 위에 커서를 올리면 레벨이 속한 기간에 대한 힌트가 나타납니다. 그러나 항상 현재 시간대가 가장 왼쪽으로 표시됩니다. 스마트 경고는 신호 콤보 레벨과 관련된 가격을 전달하는 데 도움이 됩니다.
비디오의 대시보드는 선언된 기능이 아니며 여기에 포함되지 않습니다! 아직 개발 중입니다.
트레이딩 추천. 추가 기술적 분석 없이 콤보 레벨에서 반등을 거래하는 것은 권장하지 않습니다. 파란색과 빨간색 레벨에서 반등할 확률이 더 높습니다. 가격은 아직 가격에 의해 테스트되지 않은 (128 캔들 전) 콤보 레벨에 자화됩니다. 이 경우 레벨 테이킹(한 레벨 상승/하락)이 있는 추세 전략을 사
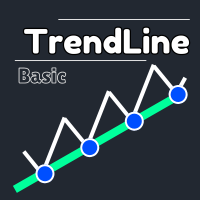
이 강력한 도구는 자동으로 추세 라인을 식별하여 거래 전략을 간소화하고보다 정보에 근거한 결정을 내릴 수 있도록 도와줍니다. MT5 버전
주요 기능 자동 추세 라인 감지 : "기본 추세선"표시기는 잠재적 인 추세 라인에 대한 시장을 스캔하고 차트에 즉시 표시합니다.이것은 귀중한 시간을 절약하고 중요한 트렌드를 놓치지 않도록합니다. 사용자 친화적 인 패널 : 우리의 지표에는 다양한 트렌드 라인을 쉽게 그릴 수있는 아름답고 직관적 인 패널이 제공됩니다.이 패널은 모든 경험 수준의 거래자를 위해 설계되어 몇 번의 클릭만으로 추세선을 추가, 편집 또는 제거 할 수 있습니다. 좋아하는 트렌드 라인을 저장하고 관리하십시오. : 가장 중요한 트렌드 라인을 추적하십시오.우리의 지표는 선호하는 추세선을 저장하여 차트를 다시 방문 할 때마다 항상 사용할 수 있도록합니다. 다목적 응용 프로그램 : 당신이 외환, 주식 또는 암호 화폐 거래에 관계없이 "기본 추세선"지표는 다양한 시장에 적응하여 거래 전

POC Delta Order Blocks is a rule-based order block and volume-delta indicator designed to help traders clearly understand where real trading activity happened and how price reacts around those zones . Instead of drawing generic candle-based blocks, this indicator uses a Point of Control (POC) approach to identify the most actively traded price level between a swing high/low and a confirmed Break of Structure (BOS). The order block is then anchored to the earliest valid candle that inte

ECM Elite Channel is a volatility-based indicator, developed with a specific time algorithm, which consists of finding possible corrections in the market.
This indicator shows two outer lines, an inner line (retracement line) and an arrow sign, where the channel theory is to help identify overbought and oversold conditions in the market.
The market price will generally fall between the boundaries of the channel. If prices touch or move outside the channel, it's a trading opportunity.
The ind

Dashboard uses Ichimoku Strategy to find best trades.
Get extra Indicators/Template: And read more about detailed Product Description and usage here: https://www.mql5.com/en/blogs/post/747457
Read more about Scanner Common features in detail here: https://www.mql5.com/en/blogs/post/747456
Features:
Price Kumo Breakout Tenkan-Kijun Cross Chikou/CLoud and Chikou/Price Support/Resistance (SR-SS or SR-NRTR) Stochastic OB/OS and back Awesome Oscillator Higher Timeframe Ichimoku Trend Align

ICT PO3 (Power of 3) AMD Protocol Framework Indicator
True Time & Structure Integration | Non-Repainting | Real-Time | Multi-Asset | MT5 Version Available
Full Setup Guide & Strategy Playbook: https://www.mql5.com/en/blogs/post/768683 MT5 Version: https://www.mql5.com/en/market/product/171633
Indicator Overview
The ICT PO3 AMD Protocol Framework is a complete structural overlay for MetaTrader 4 that maps the True Daily Cycle directly onto your lower-timeframe execution chart. It projects

Adopt market correlation and indicator resonance
Here are some trading recommendations based on the current market conditions:
(1) Note: It doesn't mean you have a perfect deal, but rather helps you avoid bad trades (2) Why traditional indicators are prone to distortion. For example, the 10-day moving average is calculated by calculating the average price of the top 10 candlesticks. Result: I prove I want to rise, and the signal is easily distorted. This indicator adopts a self-proof + corrob
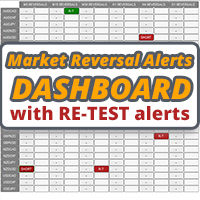
이 대시보드는 시장 구조 반전 지표와 함께 사용하기 위한 경고 도구입니다. 주요 목적은 특정 시간 프레임에 반전 기회를 알리고 지표가 하는 대로 경고의 재테스트(확인)를 알리는 것입니다. 대시보드는 자체적으로 차트에 배치되고 백그라운드에서 작동하여 선택한 쌍 및 기간에 대한 알림을 보내도록 설계되었습니다. 많은 사람들이 하나의 MT4에서 여러 차트에서 시장 반전 표시기를 실행하는 대신 여러 쌍과 시간 프레임을 한 번에 모니터링하기 위해 대시를 요청한 후 개발되었습니다. M5, M15, M30, H1, H4 및 D1 시간대에 경고합니다. 더 높은 기간은 물론 모든 거래와 마찬가지로 가장 잘 작동합니다.
이 대시보드는 시장 구조 반전 지표용 애드온으로 설계되었습니다. 독립적으로 작동하며 시장 역전 경고 표시기가 제공하는 패턴 및 신호에 대해 경고합니다.
여기에서 시장 반전 경고 표시기를 얻으십시오: https://www.mql5.com/en/market/product/46295 이
The Pulse 은 축적 기간을 실시간으로 보여주는 지표입니다.
간단히 말해서,축적은"스마트 머니"가 시장에서 강력한 움직임을 시작하기 전에 조용히 자산을 수집 할 때입니다.
차트에서는 가격이 한 범위에"붙어"있는 것처럼 보입니다. 이것은 축적 단계입니다—누군가가 큰 움직임을 준비하고 있습니다.
그리고 이러한 순간을 알아 차리는 법을 배우면—시장이"동결"하는 것처럼 보이지만 동시에 긴장이 느껴질 때-적절한 시간에 적절한 장소에있을 수 있습니다.
또한 ,The Pulse 표시기는 각 축적에 대한 계산을 수행하고 축적 기간 후에 가능한 가격 잠재력의 방향을 결정할 수 있습니다 . The Pulse 표시기의 도움으로 시장 구조를 훨씬 더 잘보고 이해할 수 있습니다 .
The Pulse Blog. The blog: Why every trader should have The Pulse indicator as an additional tool for trading. Version m
이 지표는 Advanced Currency IMPULSE with ALERT + Currency Strength Exotics 의 2가지 제품의 슈퍼 조합입니다.
그것은 모든 시간 프레임에 대해 작동하며 8개의 주요 통화와 하나의 기호에 대한 강약의 충동을 그래픽으로 보여줍니다!
이 표시기는 금, 이국적인 쌍, 상품, 지수 또는 선물과 같은 기호에 대한 통화 강도 가속을 표시하는 데 특화되어 있습니다. 금, 은, 오일, DAX, US30, MXN, TRY, CNH 등의 진정한 통화 강도 가속(충동 또는 속도)을 표시하기 위해 9번째 줄에 모든 기호를 추가할 수 있습니다.
새로운 기본 알고리즘을 기반으로 구축되어 잠재적인 거래를 훨씬 더 쉽게 식별하고 확인할 수 있습니다. 이는 통화의 강세 또는 약세가 가속되는지 여부를 그래픽으로 표시하고 가속 속도를 측정하기 때문입니다. 자동차의 속도계처럼 생각하면 됩니다. 가속화할 때 Forex 시장에서 동일한 일이 분명히 더 빠르

FullScalping 는 모든 시장에서 지속적인 스캘핑 진입 을 생성하도록 특별히 설계된 재그리기 없음, 역방향 그리기 없음 지표입니다. 끊임없는 액션을 찾는 공격적인 트레이더에게 완벽합니다!
독점 정보 및 업데이트를 받으려면 채널에 가입하세요: https://www.mql5.com/en/channels/forexnewadvisor
거의 모든 캔들 에서 신호를 제공하며, 트렌드를 확인하거나 주요 되돌림을 신호합니다. 지속적으로 당신을 안내하는 레이더와 같습니다.
작동 방식은? 매우 간단합니다: 빨간색 화살표 매도 거래에 진입. 파란색 화살표 매수 거래에 진입. 항상 일반적인 트렌드 방향으로 거래하고, 거래당 15-20핍 을 공격적으로 목표로 하며, 급격한 시장 반전 전에 빠르게 퇴장합니다.
신호는 지속적 이므로 거래 기회가 고갈되지 않습니다. 목표는 다음을 사용하여 집중적인 스캘핑 을 실행하는 것입니다: 높은 로트 낮은 스프레드(왼쪽 하단 모서리에 표시) 마지막 트렌

# ATR Trend Bands & EMA Indicator for MetaTrader 4 (MQL4)
A professional, volatility-adaptive trend-following indicator for MetaTrader 4. It identifies breakout momentum using dynamically adjusting **Average True Range (ATR) Bands** combined with **Exponential Moving Average (EMA)** multi-timeframe trend filters.
---
## Features
- **Adaptive ATR Channels:** Dynamically tracks trailing support/resistance bands that expand during high volatility and contract during consolidation. - **Dyna

Oversold and Overbought Candles, Trendlines, and BUY-SELL arrows in the single Indicator. Built from 8 default MT4 Indicators. Stochastic,RSI,SAR,CCI,RVI,DeMarker,WPR and MA. It is " NON REPAINT " indicator. All buffers do not repaint. Double Trendline buffers that can also be used to identify sideway market and support resistance area. Any timeframes and any currency pairs.
Parameters: Show Trend . TRUE/FALSE to show trendlines on the chart Follow Trend. If TRUE , Dapitrend will show only

After your purchase, feel free to contact me for more details on how to receive a bonus indicator called VFI, which pairs perfectly with Easy Breakout for enhanced confluence!
Easy Breakout is a powerful price action trading system built on one of the most popular and widely trusted strategies among traders: the Breakout strategy ! This indicator delivers crystal-clear Buy and Sell signals based on breakouts from key support and resistance zones. Unlike typical breakout indicators, it levera

The Mechanism Trend indicator is a hybrid indicator that shows the moments for entering the market with arrows. This indicator was created on the basis of the original indicators for searching for extreme points, the indicator is well suited for determining a reversal or a large sharp jerk to one side.
When the trend changes, the Mechanism Trend indicator uses color signaling: green - when changing from a downtrend to an uptrend, and red - vice versa, to a downtrend. You can use the indicator
FX Power: 통화 강세 분석으로 더 스마트한 거래 결정을 개요
FX Power 는 어떤 시장 상황에서도 주요 통화와 금의 실제 강세를 이해하기 위한 필수 도구입니다. 강한 통화를 매수하고 약한 통화를 매도함으로써 FX Power 는 거래 결정을 단순화하고 높은 확률의 기회를 발견합니다. 트렌드를 따르거나 극단적인 델타 값을 사용해 반전을 예측하고자 한다면, 이 도구는 귀하의 거래 스타일에 완벽히 적응합니다. 단순히 거래하지 말고, FX Power 로 더 스마트하게 거래하세요.
1. FX Power가 거래자에게 매우 유용한 이유 통화와 금의 실시간 강세 분석
• FX Power 는 주요 통화와 금의 상대적 강세를 계산하고 표시하여 시장 역학에 대한 명확한 통찰력을 제공합니다.
• 어떤 자산이 앞서고 있고 어떤 자산이 뒤처지는지 모니터링하여 보다 현명한 거래 결정을 내릴 수 있습니다. 포괄적인 멀티 타임프레임 뷰
• 단기, 중기 및 장기 타임프레임에서 통화와 금의 강세를

FOREX MEGA SALE! 50% OFF!
Buy Trend Reader Indicator with a huge –50% discount ! Promo Price: $147
(Regular Price: $297 — You Save $150!) Act now before this deal ends! Trend Reader Indicator is a revolutionary trading indicator designed to empower forex traders with the tools they need to make informed trading decisions. This cutting-edge indicator utilizes complex mathematical calculations and the Average True Range (ATR) indicator to identify and highlight the initiation of new uptrends an
Get ALL my MT4 & MT5 indicators FREE — See how here
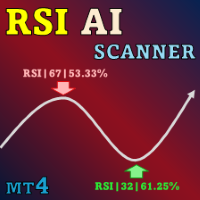
이 인디케이터와 다른 인디케이터도 무료로 받으세요: 인디케이터를 거래 로봇으로 전환하기 (코딩 불필요) 특별 할인 : ALL TOOLS , 개당 $35 , 기간 한정 ! 새 도구 는 $30 에 제공됩니다. 적용 기간은 첫 1주일 또는 첫 3건의 구매 까지입니다. MQL5 트레이딩 도구 채널: 가입하여 최신 소식을 받아보세요 다중 시간대 및 다중 종목 안내: Multi-Timeframe & Scanner 사용자 가이드(12개 언어 제공) MT5 버전 보기: RSI Kernel Optimized MT5 Multi-TF Scanner MT4 버전 보기: RSI Kernel Optimized MT4 Multi-TF Scanner 다른 제품 보기: 모든 제품 또는 트레이딩 인디케이터, 특별 혜택 및 신제품 RSI Kernel Optimized 는 현재 RSI를
Get ALL my MT4 & MT5 indicators FREE — See how here
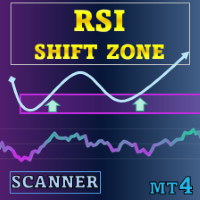
특별 할인 : ALL TOOLS , 각 $35 입니다! 새로운 도구 는 발표 후 첫 주 또는 첫 3회 구매 동안 $30 에 제공합니다! Trading Tools Channel on MQL5 : 최신 소식을 받으려면 채널에 참여하세요 RSI Shift Zone Scanner는 RSI 신호를 가격 행동과 연결하여 시장 심리가 변할 수 있는 순간을 식별합니다. RSI가 설정된 수준(기본값: 과매수 70, 과매도 30)을 상·하단 돌파하면, 지표는 차트에 채널을 그립니다. 이 채널은 심리가 반전되었을 가능성이 있는 구역을 표시하여 잠재적 지지·저항으로 활용될 수 있습니다. MT5 버전 보기: RSI Shift Zone MT5 Scanner 다른 제품: All P roducts RSI가 상단 또는 하단 레벨을 교차하면 새로운 채널이 생성됩니다. 채널 경계는 교차 캔들의 고가

차트를 구조화하고 주기적인 가격 변동을 식별하는 기술 지표입니다.
모든 차트에서 작업할 수 있습니다.
다양한 유형의 알림.
그래프 자체에도 추가 화살표가 있습니다.
역사를 재구성하지 않고, 촛불을 닫는 작업에 임한다.
M5 이상에서 권장되는 TF입니다.
사용 및 구성이 쉬운 매개변수입니다.
매개변수가 다른 2개의 지표를 사용하는 경우, 다른 지표 없이 해당 지표만 사용할 수 있습니다.
2개의 입력 매개변수가 있습니다
주기성과 신호 지속 시간
이 2개의 매개변수는 차트 구조의 처리와 관련이 있습니다.
Cyclicity - 역전 주기가 얼마나 자주 바뀌는지 조절하고 주기를 매끄럽게 합니다. Signal duration - 최소 숫자에서는 가격 움직임의 충격을 감지하고, 최대 숫자에서는 장기적 추세 움직임을 감지합니다.. --------------------------------
The indicator displays trend reversal in the form of arrows. The indicator does not change its values (is not redrawn) after a signal. The program notifies about arrows by means of a pop-up window, or sending notification to e-mail. This is a multitimeframe instrument. Values of the indicator may be displayed from higher timeframes.
Parameters Time-frame - select time session; zero is the current timeframe (Time-frame cannot be lower than the current time interval). Bars - number of bars on the

Volatility Trend System - a trading system that gives signals for entries. The volatility system gives linear and point signals in the direction of the trend, as well as signals to exit it, without redrawing and delays.
The trend indicator monitors the direction of the medium-term trend, shows the direction and its change. The signal indicator is based on changes in volatility and shows market entries.
The indicator is equipped with several types of alerts. Can be applied to various trading ins
Please thoroughly test demo the indicator in your preferred trading conditions before making a purchase decision.
Your satisfaction and confidence in its performance are paramount.
MT Magical : A sophisticated strategy combining swing trading, trend analysis and supply & demand signals. Expertly filtered for precision. Developed with rigorous effort, delivering value to serious investors. Indicator for traders who prefer manual trading. Request: PC high performance
TRADE: Forex
TIME FRA

Dashboard for Ma Speedometer: https://www.mql5.com/en/market/product/116784
Non standard attitude to the standard moving average indicator. The essence of the indicator is to determine the strength and speed of the price direction by determining the tilt angle of the moving average. A point is taken on the fifteenth MA candle and a point on the last closed MA candle, a straight line is drawn between them, it is movable and on a hemisphere shows an angle of inclination from 90 degrees to -90. a
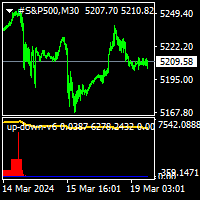
Thise indicator is up down v6 comes with tradingwiev pinescript. purchased people, after installed on terminal ,contact me on mql5 to get BONUS TradingView pinescript.
up-down indicator is no repaint and works all pairs and lower than weekly time frames charts. it is suitable also 1 m charts for all pairs. and hold long way to signal. dont gives too many signals. when red histogram cross trigger line that is up signal.and price probably will down when blue histogram cross trigger line that i
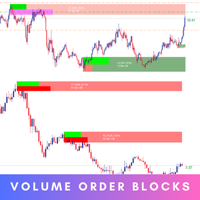
Introducing the Volume Order Blocks indicator, a game-changing tool designed for traders who demand precision and clarity in their market analysis. This advanced indicator not only identifies order blocks but also integrates crucial volumetric data, allowing you to gauge the strength of these blocks with unparalleled accuracy. MT5 version - https://www.mql5.com/en/market/product/121238/ Key Features of the Volume Order Blocks: Bullish & Bearish Order Blocks: Easily visualize and dif

Volume Profile Rectangle 요약 선택한 영역 내에서 각 가격 수준별 거래량의 수평 분포를 시각화하는 인터랙티브 볼륨 프로파일 지표 입니다. 자동으로 이동 가능한 직사각형을 생성하고, 매수/매도 우세 거래량을 색상 막대로 표시합니다. 주요 기능: 수평 거래량 표시 : 각 가격 수준에서의 거래량 분포를 수평 막대 형태로 시각화 강세/약세 분석 : 매수 우세 거래량은 초록색, 매도 우세 거래량은 빨간색으로 표시 인터랙티브 직사각형 : 선택 영역(직사각형)을 이동하면 자동으로 분석이 업데이트됨 자동 생성 : 시작 시 기본 직사각형을 자동으로 생성하여 즉시 사용 가능 작동 방식: 영역 선택 : 자동 또는 수동으로 생성된 직사각형이 분석할 구간(시간 + 가격)을 정의 거래량 분포 계산 : 가격 구간을 여러 수준으로 나누고(해상도 설정 가능), 선택된 캔들의 거래량을 해당 구간에 분배 스마트 색상 분석 : 각 가격 수준별로 매수/매도 중 어느 쪽 거래량이 우세한지 판별 동적

Indicator UU Bands สำหรับเทรดเดอร์ ที่ต้องการความแม่นยำ ในการเข้าเทรด หรือ หาจังหวะในการเข้าเทรด
ใช้ได้กับทุก ทามเฟรม
ข้อมูลของ อินดิเคเตอร์ 1. มี แบนด์ ด้วยกันทั้งหมด 7 เส้น 2. เส้น 3 เส้น ด้านบน เป็นแนวต้าน เคลื่อนที่ แนวต้านที่1 แนวต้านที่ 2 แนวต้านที่3 3. เส้น 3 เส้น ด้านล่าง เป็นแนวรับ เคลื่อนที่ แนวรับที่ 1 แนวรับที่ 2 แนวรับที่ 3 4. เส้นตรงกลาง เป็นเส้นแบ่ง เทรน สีเขียว หมายถึง แนวโน้มขึ้น สีแดง หมายถึง แนวโน้มลง 5. สัญลักษณ์ ลูกศร สามารถนำไปอ้างอิง เป็นจุดเข้าเทรดได้
คำแนะสำหรับการเท

OrderFlow Absorption – MT4용 전문 델타 & 흡수 신호 인디케이터 OrderFlow Absorption으로 진정한 오더플로우 분석의 힘을 경험하세요. MetaTrader 4를 위한 궁극의 델타 히스토그램 및 흡수 신호 인디케이터입니다. 가격 움직임의 이면에서 실제로 무슨 일이 일어나는지 알고 싶은 트레이더를 위해 설계된 이 도구는, 시장을 움직이는 숨겨진 매수/매도 압력과 흡수 이벤트를 드러냅니다. 주요 기능 델타 히스토그램 시각화: 매수와 매도 압력을 색상별 히스토그램으로 즉시 확인할 수 있습니다. 흡수 신호 감지: 고급 로직으로 강세 및 약세 흡수 이벤트를 식별하여 반전 신호를 미리 알려줍니다. 차트 마커: 흡수 신호가 차트에 직접 표시되어 시각적으로 쉽게 확인할 수 있습니다. 팝업 알림: 새로운 흡수 신호가 발생하면 실시간으로 알림을 받을 수 있습니다. 사용자 지정 임계값: 약한 신호는 필터링하고, 확률이 높은 기회에 집중할 수 있습니다.

Smart Phase Box (SPB) — Indicator Description Smart Phase Box automatically locates consolidation zones (bases, flats) on the chart and analyzes the candle microstructure inside each zone — wicks, tick volume, body-to-range ratio, and where price closes relative to the zone — to estimate whether the zone looks more like accumulation (buyers absorbing supply) or distribution (sellers absorbing demand), based on classic Wyckoff / Smart Money concepts. MT5-version: https://www.mql5.com/en/market/p
Gold Trend M1 - Optimized Scalping Tool for Gold (XAUUSD) Gold Trend M1 is a high-frequency trading indicator for the MetaTrader 4 platform, specifically optimized for the M1 timeframe on the Gold market. It combines a powerful SuperTrend trend filter with buy/sell signals derived from Heiken Ashi calculation logic, helping traders identify precise and disciplined entry points for optimal trading performance.
Key Features Optimized for M1 Scalping: Specifically developed for high-speed scalping

Auto Optimized Parabolic RSI: 고급 3D 모멘텀 엔진 대부분의 개인 투자자용 보조지표는 시장의 변동성이 변하는 순간 무용지물이 되는 정적인 입력값에 의존하기 때문에 실패합니다. Auto Optimized Parabolic RSI는 자체적인 수학적 우위를 지속적으로 재계산하여 "보조지표 노후화" 문제를 해결하며, 기관급 퀀트 트레이딩의 적응력을 귀하의 MT5 터미널에 직접 제공합니다. 핵심 이점: 맞춤형 인메모리 3D 최적화 표준 자동 최적화 도구들은 일반적인 보조지표 호출로 터미널에 과부하를 일으켜 MT5 플랫폼을 멈추게 하는 경우가 많습니다. 이 도구는 이러한 병목 현상을 완전히 우회합니다. 맞춤형 네이티브 RAM 기반 계산기로 구축된 내부 엔진은 차트를 로드하거나 타임프레임을 변경할 때마다 빛처럼 빠른 3D 그리드 검색을 실행합니다. RSI 기간(주기), SAR 스텝(가속도) 및 SAR 최대치(속도 제한)를 동시에 스캔하여 플랫폼 지연 없이 수만 개의

마켓 메이커를 위한 도구. Meravith는 다음과 같은 기능을 제공합니다: 모든 타임프레임을 분석하고 현재 유효한 추세를 표시합니다.
강세와 약세 거래량이 동일한 유동성 구간(거래량 균형 구간)을 강조 표시합니다.
서로 다른 타임프레임의 모든 유동성 레벨을 차트에 직접 표시합니다.
텍스트 기반 시장 분석을 생성하여 참고용으로 제공합니다.
현재 추세를 기반으로 목표가, 지지선 및 손절가를 계산합니다.
거래의 위험 대비 보상 비율(Risk/Reward)을 계산합니다.
계좌 잔고에 따라 포지션 크기를 산출하고 잠재 수익을 추정합니다. 시장에 중대한 변화가 발생할 경우 경고도 제공합니다. 지표의 주요 라인: 강세/약세 거래량 소진 라인 — 목표가로 사용됩니다.
시장 추세를 나타내는 라인. 시장이 강세인지 약세인지에 따라 색상이 변경되며 추세 지지선 역할을 합니다. 색상은 주로 시장 심리를 보여줍니다.
거래량 균형선(Eq). Eq(Volume Equilibrium) 라인은 시스템의 핵심입니

하나의 차트에서 즐겨 사용하는 지표로 모든 심볼과 모든 타임프레임을 모니터링하세요. Ultimate Indicator Dashboard는 깔끔하고 이동 가능한 단일 패널에서 멀티 심볼, 멀티 지표, 멀티 타임프레임 뷰를 완벽하게 제공합니다. 차트 전환은 이제 그만. RSI, MACD, Bollinger Bands, Ichimoku, ATR, 거래량 등 모든 종목을 한눈에 확인하세요. 색상으로 구분된 신호가 기회가 어디에 있는지 정확히 보여주며, 스마트 알림이 조건 변화를 알려줘 — 더 이상 매매 기회를 놓치지 않습니다. 대시보드에 없는 지표를 사용하고 계신가요? 메시지 보내기 하시면 쉽게 추가할 수 있는지 확인해 드리겠습니다! === 트레이더들이 이 대시보드를 사랑하는 이유 ===
• 하나의 차트에서 최대 30개 심볼과 8개 지표를 동시에 확인 • 모든 열은 독립적으로 설정 가능 — 어떤 타임프레임에서든 원하는 지표 선택 • 색상 코딩된 셀이 강세, 약세, 과매수, 과매도 조건을

M1 Arrow Scalping - shows signals on the M1 period, does not redraw entry points and can work on all major currency pairs + metals (gold/silver). The indicator analyzes the market using algorithms for determining price patterns and shows the trader the price reversal points on the chart. The red dot shows that the price will turn down and the blue dot shows that the price will turn up. The indicator also sends signals to the phone in the form of PUSH notifications. Therefore, you do not need to

Hidden - Delta - Flow is a professional trading system designed to detect hidden changes in market structure through comprehensive analysis of Hidden Divergence and Delta CVD Divergence, enhanced by normalized volume, an adaptive TP/SL model, and verifiable performance statistics. Instead of simply displaying price direction, the system analyzes the relationship between price movement and internal volume activity, allowing it to identify situations where the external price structure begins t
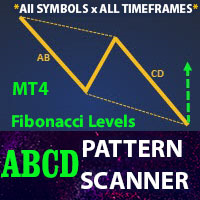
** All Symbols x All Timeframes scan just by pressing scanner button ** *** Contact me to send you instruction and add you in "ABCD scanner group" for sharing or seeing experiences with other users. Introduction This indicator scans AB=CD retracement patterns in all charts. The ABCD is the basic foundation for all harmonic patterns and highly repetitive with a high success rate . The ABCD Scanner indicator is a scanner reversal ABCD pattern that helps you identify when the price is about to ch

Market Structure Patterns is an indicator based on smart money concepts that displays SMC/ICT elements that can take your trading decisions to the next level. Take advantage of the alerts , push notifications and email messages to keep informed from when an element is formed on the chart, the price crosses a level and/or enters in a box/zone. Developers can access the values of the elements of the indicator using the global variables what allows the automation of trading d

블로그: https://www.mql5.com/en/blogs/post/769823 MT4: https://www.mql5.com/en/market/product/176181 MT5: https://www.mql5.com/en/market/product/176182
VOLUME BUBBLE [tambangEA]은 트레이더가 차트에서 비정상적인 시장 활동을 직접 식별할 수 있도록 설계된 프리미엄 시각적 거래량 압력 지표입니다.
이 지표는 비정상적인 델타/거래량 움직임을 감지하여 가격 움직임 주변에 깔끔한 버블 마커로 표시합니다. 각 버블은 거래량 압력 이벤트를 나타내므로 트레이더는 강한 참여, 불균형, 모멘텀 압력 또는 잠재적 흡수가 나타날 수 있는 지점을 빠르게 파악할 수 있습니다.
이 도구는 캔들별 거래량 데이터를 수동으로 분석할 필요 없이 시장 참여를 시각적으로 빠르게 파악하려는 트레이더를 위해 설계되었습니다.
핵심 개념 대부분의 가격 차트는 가격 움직임만 보여줍니다.

MQL5 블로그: https://www.mql5.com/en/blogs/post/771566 MT4 버전: https://www.mql5.com/en/market/product/181554 MT5 버전: https://www.mql5.com/en/market/product/181555
듀얼 리그레션(DUAL REGRESSION) [tambangEA]은 트레이더가 이중 로그 회귀 채널, 거래량 패턴, 그리고 다중 통화쌍 대시보드 모니터링을 통해 가격 움직임을 분석할 수 있도록 설계된 전문 시장 구조 지표입니다.
이 지표는 광범위한 시장 방향을 위한 거시 회귀 채널과 활발한 거래 영역 분석을 위한 단기 회귀 채널을 결합했습니다. 또한, 기울어진 거래량 프로파일 시각화, POC(Point of Control) 참조, 매수/매도 틱 거래량 통계, 델타 압력, 방향 화살표, 그리고 빠른 차트 해석을 위한 간결한 대시보드 패널을 제공합니다.
이 도구는 자동 거래 로직을 사용하지 않고 시

MQL5 블로그 = https://www.mql5.com/en/blogs/post/775739 MT4 버전 = https://www.mql5.com/en/market/product/195514 MT5 버전 = https://www.mql5.com/en/market/product/195515
FIBONACCI ARCS [tambangEA]는 가격, 시간, 스윙(swing) 기하학적 구조 및 거래량 집중도 간의 관계를 차트상에 직접 시각화하도록 설계된 고급 시장 구조 지표입니다.
정적인 수평 레벨을 표시하는 기존의 피보나치 되돌림(Fibonacci Retracement)과 달리, 피보나치 아크(Fibonacci Arcs)는 활성 시장 스윙을 기반으로 곡선 형태의 피보나치 영역을 투영합니다. 이를 통해 트레이더는 가격이 수직적인 움직임뿐만 아니라 시간의 흐름에 따라 어떻게 전개되는지 평가할 수 있습니다.
이 지표는 동적 스윙 분석과 0.0%, 23.6%, 38.2%, 50.0%,

Linear Trend Predictor - 진입 지점과 방향성 지원선을 결합한 추세 지표입니다. 고가/저가 채널을 돌파하는 원칙에 따라 작동합니다.
지표 알고리즘은 시장 노이즈를 걸러내고 변동성과 시장 역학을 고려합니다.
표시기 기능
평활화 방법을 사용하여 시장 추세와 BUY 또는 SELL 주문을 시작하기 위한 진입 시점을 보여줍니다. 모든 기간의 차트를 분석하여 단기 및 장기 시장 움직임을 파악하는 데 적합합니다. 어떠한 시장과 시간대에도 적용할 수 있으며, 입력 매개변수를 통해 거래자는 자신에게 맞게 지표를 독립적으로 사용자 지정할 수 있습니다. 설정된 지표 신호는 사라지거나 다시 그려지지 않습니다. 이는 캔들 마감 시 결정됩니다.
여러 유형의 알림이 화살표와 결합되어 있습니다. 이 지표는 독립적인 거래 시스템으로 사용할 수도 있고, 다른 거래 시스템에 추가하는 용도로도 사용할 수 있습니다. 모든 수준의 경험을 가진 거래자가 사용할 수 있습니다.
주요 매

Extreme Value Sniper is a detrended price indicator Indicator finds the potential reversal levels by checking value ranges and price cycles. MT5 Version of the product : https://www.mql5.com/en/market/product/114550
It shows the overbought and oversold levels using the average range. Overbought Levels are between 4 and 10 Oversold levels are bewtween -4 and -10
Those levels can be used as a reversal levels.
Extreme Value Sniper look for some special divergence and convergence patterns to c

M & W Pattern Pro is an advanced scanner for M and W patters , it uses extra filters to ensure scanned patterns are profitable. The indicator can be used with all symbols and time frames. The indicator is a non repaint indicator with accurate statistics calculations. To use , simply scan the most profitable pair using the statistics dashboard accuracy , then enter trades on signal arrow and exit at the TP and SL levels.
STATISTICS Accuracy 1 : This is the percentage of the times price hits TP1

Introducing Order Blocks Breaker , a brand-new way to identify and leverage order blocks in your trading strategy. After developing multiple order block tools with unique concepts, I’m proud to present this tool that takes things to the next level. Unlike previous tools, Order Blocks Breaker not only identifies order blocks but also highlights Breaker Order Blocks —key areas where the price is likely to retest after a breakout. MT5 - https://www.mql5.com/en/market/product/124102/ This tool inco

Liquidity Sweeps Detector PRO MT4
매수 측과 매도 측 유동성을 매핑하고, 가격이 유동성 레벨을 스윕하는 순간을 감지하며, 뒤따르는 시장 구조 전환 (MSS)을 확인하는 Smart Money Concepts (SMC / ICT) 지표입니다. 유효한 sweep + MSS마다 화살표로 표시하고 멀티 타임프레임 컨플루언스로 등급을 매기며, 자동 손익비 투영과 차트 위 실시간 패널을 제공합니다.
기능 확인된 스윙 고점과 저점에서 매수 측 (BSL) 과 매도 측 (SSL) 유동성을 매핑합니다. 유동성 sweep (스톱 헌팅)을 감지합니다: 가격이 레벨을 뚫은 뒤 다시 안쪽으로 마감합니다. setup을 검증하기 전에 sweep 이후의 시장 구조 전환 (MSS) 을 확인합니다. BSL + MSS에는 숏 화살표를, SSL + MSS에는 롱 화살표를 표시합니다. 멀티 타임프레임 컨플루언스
세 개의 상위 타임프레임(기본값 M15 / H1 / H4)을 캐시된 바이어스 엔진
맞춤형 MT4 지표로 성공적인 외환 거래에 대한 비밀을 발견하십시오!
Strategy with RangeBars https://youtu.be/jBaDCAPTtHc
외환 시장에서 성공을 달성하고 위험을 최소화하면서 일관되게 이익을 얻는 방법을 궁금해 한 적이 있습니까? 여기에 당신이 찾고 있던 답이 있습니다! 거래에 대한 귀하의 접근 방식을 혁신 할 독점적 MT4 지표를 소개 할 수 있습니다.
독특한 다양성
우리의 지표는 Renko 및 Rangebar Candle Formations를 선호하는 사용자를 위해 특별히 설계되었습니다. 우리는 이러한 차트 유형이 많은 숙련 된 거래자들이 선호한다는 것을 이해하기 때문에 우리의 지표가 그들과 완벽하게 통합되어 비교할 수없는 시장 분석을 제공합니다.
명확한 추세 신호
복잡한 분석을 잊어 버리십시오! 우리의 지표는 생생한 색상과 명확한 점 구조를 사용하여 시장 동향을 명확하게 나타냅니다. 빨간색과 파란색 점은 가격 이동 방향에 대해 의심의

The Stream indicator is based on the process of identifying the rate of change in price growth based on the intersection of two lines created according to a special algorithm and allows you to find points of entry and exit from the market. A fundamental technical indicator is used, which allows you to assess the current market situation in order to enter the market of the selected currency pair in the trend and with minimal risk. The indicator is well suited for detecting a reversal or a large s

The Storm Prices indicator is trendy, arrow family. It is easy to work and understand when the first red arrow appears, you need to buy, when the first blue arrow appears, sell. The indicator is used for scalping and pipsing. The indicator makes calculations based on several technical indicators. Determines the direction of the trend and gives a fairly clear indication of the position. The indicator allows you to determine the opportunities for entering the market for a short time. There is a sw

Currency Strength Pro는 주요 8개 통화를 상대적 강도로 순위 매깁니다. 최대 28개 통화쌍에서 값을 읽어 다중 시간대 합성으로 계산한 뒤, 바스켓 자체가 구성할 수 있는 통화쌍을 등급이 매겨진 스캐너로 순위화합니다. 확정된 봉만 사용하며 매 틱마다 계산하지 않습니다. 개념은 단순합니다. 오늘 우연히 보기 좋은 차트가 아니라, 강한 통화를 약한 통화에 대해 거래하는 것입니다. 강도 표는 "어떤 통화인가"에 답하고, 스캐너와 그 A/B/C 등급은 "어떤 통화쌍이며 셋업이 얼마나 깨끗한가"에 답합니다. 이 지표가 하는 일 패널은 EUR, GBP, AUD, NZD, USD, CAD, CHF, JPY를 강한 순서대로 정렬합니다. 모든 수치는 브로커가 실제로 제공하는 통화쌍을 기반으로 만들어집니다. 각 통화쌍은 한쪽에 더하고 다른 쪽에서 빼므로, 8개의 점수는 항상 50을 중심으로 하며 바스켓은 구조적으로 제로섬입니다. 50은 바스켓의 평균이지 고정된 수준이 아닙니다. 점수
MetaTrader 플랫폼 어플리케이션 스토어에서 MetaTrader 마켓에서 트레이딩 로봇을 구매하는 방법에 대해 알아 보십시오.
MQL5.community 결제 시스템은 페이팔, 은행 카드 및 인기 결제 시스템을 통한 거래를 지원합니다. 더 나은 고객 경험을 위해 구입하시기 전에 거래 로봇을 테스트하시는 것을 권장합니다.
