MetaTrader 4용 유료 기술 지표 - 14

KT COG is an advanced implementation of the center of gravity indicator presented by John F. Ehlers in the May 2002 edition of Technical Analysis of Stocks & Commodities magazine. It's a leading indicator which can be used to identify the potential reversal points with the minimum lag. The COG oscillator catches the price swings quite effectively.
MT5 version of the same indicator is available here KT COG Advanced MT5
Calculation of COG The COG indicator is consist of the two lines. The main l

"It's not about how much you do, but how much love you put into what you do that counts." - Mother Teresa
This Indicator is build on value of Relative Strength Index and Moving average of relative strength Index. We have calculated bands with respect to Moving average of Relative strength Index. Trading strategy: https://www.mql5.com/en/blogs/post/725691 Why use Rsi Ma Bands? Great for novice traders as well as experienced traders. Low risk entries. Doesn't repaints.
No additional Indicato

The Squeezer indicator simply draws ascending lines with Sell signal in the downtrend and descending lines with Buy signal in the uptrend to catch the pullbacks and sniper entries. This is a common successful trading strategy being used by many successful traders, and the good thing about this strategy is that it works with all time frames. The difference is in the take profit level between them. Buy / Sell signals are triggered at the close of the current candles above / below the ascending or

Multi-timeframe Parabolic SAR dashboard allows you to add and monitor PSAR trends. The multi-timeframe Parabolic SAR dashboard will save you a lot of time and gives you a single view of the markets using PSAR. In short, you can just view one window and get a snapshot of up to 21 instruments on your MT4 platform. The indicator opens in a sub-window. Below are the features of the PSAR Dashboard Indicator Modify PSAR Settings: The PSAR Dashboard comes with default PSAR settings of 0.02 (Step) and 0

The indicator trades during horizontal channel breakthroughs. It searches for prices exceeding extreme points and defines targets using Fibo levels. The indicator allows you to create a horizontal channel between the necessary extreme points in visual mode quickly and easily. It automatically applies Fibo levels to these extreme points (if the appropriate option is enabled in the settings). Besides, when one of the extreme points and/or Fibo levels (50%) is exceeded, the indicator activates a so

Two Period RSI + Alerts compares long-term and short-term RSI lines, and plots a fill between them for improved visualization. Fill is colored differently according to an uptrend (short period RSI above long period RSI) or a downtrend (short period RSI below long period RSI). Short-term RSI crossing long-term RSI adds a more robust trend confirmation signal than using single period RSI alone. This is a tool to help visualize and confirm RSI trends. We hope you enjoy!
Alerts Email, message, and

The Volume Spike indicator is a useful tool to identify the directional market's intention.
How Does It Work: The Volume Spike indicator identifies the volume peaks and creates a sensitive rectangle equipped with Alert and Warning Pop Up that it suggests the market's direction. This tool has the ability to select the time frame on which to do the analysis of volume and it gives a great visual signal colored into rectangle. The indicator can identify valid market signals but it can also suggest
Market Zones This indicator provides an easy way to get to trade based on Gaussian statistical levels similar to the Market Profile methodology. Using an exclusive formula the indicator estimates dinamic zones where the market movements statistically remains most of the time (70%), this allows to see the market on a simplified way avoiding following non-relevant bar movements. Prices stay calm inside market zones and tend to move faster outside the zones. This is crutial to identify best zones
Special offer! https://www.mql5.com/ru/users/bossik2810 SMC Probability - is an indicator designed to track the actions of institutional investors, commonly known as “smart money”. This tool calculates the probability that smart money will actively participate in buying or selling in the market, which is referred to as smart money order flow.
The indicator measures the probability of three key events: Change of Character ( CHoCH ), Shift in Market Structure ( SMS ), and Break of Structure

Angle of Moving Averages This indicator is very simple yet powerful concept which constantly calculate the slope of the current bar moving average with respect to the N bar before moving average value. This no only give a good entry and exit signal but also it shows traders the strength of the signal. It shows positive green histogram when market is moving toward upward direction and red histograms for downtrend. When large histograms found means market has very strong trend. Inputs Available

CMA dashboard is designed to help traders in identifying trend on multiple timeframes and symbols. It displays a clear state of the overall trend at one place without the need to navigate between different charts and timeframes. This saves time and makes decision making process fast so that potential opportunities are not missed. It is based on Corrected moving averages available here Features
Parameters for signal optimization Inputs for multiple timeframes and symbols Usage Higher timeframe
Universal adaptable indicator. It determines the estimated trading range for the current day based on the available history a real data, and displays the area of the probable price rollback on the chart. All this thanks to the built-in algorithm that automatically adapts to any behavior models of the market quotes. With the parameters adjusted, the indicator shows its effectiveness on most of the currency pairs, that have a rollback from the reached extremums during the current or the next tradi

The FFx Dashboard MTF alerter will show you on a single chart all the timeframes (M1 to Monthly) with their own status for the indicator.
2 Alert Options: Single timeframe: each selected timeframe alert separately when a signal occurs Multi timeframes: all selected timeframes must agree for an alert to be triggered Both options have an input to select the timeframes to be used for the alert(s).
How to Understand the Status: Green/Red square: histogram above/below 0 line Green square + Red bord

KT Auto Trendline draws the upper and lower trendlines automatically using the last two significant swing highs/lows. Trendline anchor points are found by plotting the ZigZag over X number of bars.
Features
No guesswork requires. It instantly draws the notable trendlines without any uncertainty. Each trendline is extended with its corresponding rays, which helps determine the area of breakout/reversal. It can draw two separate upper and lower trendlines simultaneously. It works on all timeframe

Reversal Sniper is designed to find the extreme reversals of the price. Indicator collects data of Cycle Sniper Indicator.
NOTE: REVERSAL SNIPER Indicator is made for Cycle Sniper Users as an additional tool. However, it can be used by the traders who look for finding out strong reversal levels.
Indicator works on all timeframes and all instruments.
Reversal Sniper Checks: Harmonic Patterns RSI Zig Zag and Harmonic Swings Cycle Sniper Indicator's Buy / Sell Signals The complex algo is bas
Top Quantum Entry MT4 indicator that gives signals to enter trades.
Perfect entry points for currencies, cryptocurrency, metals, stocks and indices.
Special offer - https://www.mql5.com/en/users/bossik2810
The indicator 100% does not repaint!!!
If a signal appears, it does not disappear anymore! Unlike indicators with redrawing, which lead to loss of deposit, because they can show a signal, and then remove it.
Trading with this indicator is very easy.
Wait for a signal from the indicat

The "Spread Monitor" indicator allows you to analyze the spread change during the day, control the expansion of the spread by your broker and has a number of interesting additional features Choosing a broker with a minimum spread value is very important for the work of night advisors, scalping and intraday trading.
However, the MT4 terminal does not store spread data, so the multifunctional "Spread Monitor" indicator will be useful for any intraday trader. Features:
The indicator shows the curr
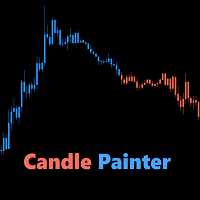
Candle Painter is a 13 in 1 indicator that paints indicators such as all the oscillators, right on top of your chart candles. You can choose from a long list of indicators and follow the trend of the colored candles, or get warned by the overbought/oversold color on the candles. Uptrend and downtrend levels can be set for the oscillators. Oscillators with main and signal lines, such as MACD, Stochastic and RVI, also have the option to follow trend by crossings. Overbought and oversold levels can

Best and worst Dashboard was born from the idea to have a panel that includes all the symbols in a chart. It is very importance to understand which symbols are both positive and negative. In the past, we realized the single indicator Best and Worst ( https://www.mql5.com/en/market/product/11784 ), now thanks to the upgrading of the Metatrader the dashboard displays all the instruments simultaneously. A great revolution. This Dashboard is able to calculate performance at any time frame and clicki

This scanner is monitoring the entire market for trade opportunities for all symbols and for all time frames. This scanner will alert you on your computer, or on your mobile, when a trade opportunity has been found. Three moving average strategy
The three moving average strategy is a very popular and proven strategy. The slowest moving average is used to determine the direction of the trend. If the price is above the slowest moving average, we are in a Bullish market and if the price is below

Parabolic SAR is one of the most popular indicators allowing you to determine in a timely manner the trend reversal, get an early entry point and accurately define the place of profit taking. Parabolic SAR is very efficient in case of a trendy market but often gives false signals during a flat. In order to sort such signals out, it is possible to use the same indicator on higher timeframes. This eliminates the main drawback of the indicator during a flat, while retaining its advantage of early e
KT Fisher Transform is an advanced version of the original Fisher Transform oscillator equipped with divergence detection, crossover alerts, and many more features. Originally it was developed by John F. Ehlers. It converts the asset's price into a Gaussian normal distribution to find the local extremes in a price wave.
Features
A light-weighted oscillator that efficiently identifies the upward and downward crossovers and marks them using vertical lines. It also finds regular and hidden diverg

Last High and Low Indicator
Features
Dynamic High/Low Lines : Automatically plots horizontal lines showing the highest high and lowest low over a selected number of past bars. Customizable Lookback Period : Adjust how many bars the indicator analyzes to find highs/lows. Visual Customization : Choose line colors (red for high, blue for low). Adjust line style (dashed, solid, etc.) and thickness. Price Labels : Displays the exact price and bar count for clarity (e.g., "High (10 bars): 1.1200").
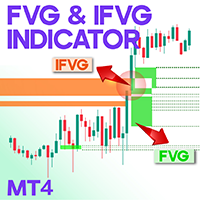
FVG and IFVG Indicator MT4
The Fair Value Gap (FVG) and Improved Fair Value Gap (IFVG) indicator for MetaTrader 4 identifies crucial liquidity zones based on the Inner Circle Trader (ICT) methodology. Fair Value Gaps emerge when rapid price fluctuations create unfilled price regions due to heightened volatility. Over time, prices often revisit these gaps. The Improved Fair Value Gaps (IFVG) function similarly but shift their role upon a breakout, acting as a support or resistance level afterwar

Gold Level MT4 Special offer - https://www.mql5.com/en/users/bossik2810
A great helper for trading Gold.
Levels do not repaint and do not change their data We recommend using it with the indicator - Professional Trade Arrow
Levels are built every day, so you will trade every day with the indicator.
Gold Level.
Price markups are shown on the chart, after reaching TP1 or SL1, close half of the position, and the rest is transferred to breakeven.
Any questions? Need help?, I am always happy to

This indicator is designed to find the difference in RSI price and indicator. This indicator shows the price and indicator difference on the screen. The user is alerted with the alert sending feature. Our Popular Products Super Oscillator HC Cross Signal Super Cross Trend Strong Trend Super Signal
Parameters divergenceDepth - Depth of 2nd ref. point search RSI_Period - Second calculation period indAppliedPrice - Applied price of indicator indMAMethod - MA calculation method findExtInte

Currency Correlation Plus is an expensive version of the indicator. It is equipped with the signal and is more equipped than its cheaper brother. The indicator helps us understand and see a correlation. Second chart makes it easy to analyze and trade multiple currencies. On the chart, you can post multiple pairs. Type in the selected currency pair in the settings and add it to the chart.
Inputs One indicator on chart=True / two or more=False Alert Signal buy and sell for first chart and second

40% off. Original price: $50
Ichimoku Trend Finder is a multi symbol multi timeframe trend dashboard that helps traders to monitor and identify potential market trends from one chart. This panel scans the Ichimoku Kinko Hyo indicator in 28 configurable instruments and 9 timeframes for classic Ichimoku trend signals with a deep scan feature to scan all market watch symbols (up to 1000 instruments!).
Download Demo here (Scans only M1 and M5) Settings description here MT5 version here

This indicator provides the analysis of tick volume deltas. It calculates tick volumes for buys and sells separately, and their delta on every bar, and displays volumes by price clusters (cells) within a specified bar (usually the latest one). This is a limited substitution of market delta analysis based on real volumes, which are not available on Forex. The indicator displays the following data in its sub-window: light-blue histogram - buy (long) volumes; orange histogram - sell (short) volumes
how each of these input fields is used and what happens on your chart when you adjust their values: Custom text for comment : How to use : Type any text you want into the "Value" field. Result : The text you type will appear in the top-left corner of the chart window (known as the Chart Comment). You might use this for the indicator's name, version, or your own short notes. Lookback period for regression calculation : How to use : Enter an integer (e.g., 100, 200, 300). Result : This determines

Currency Strength Meter is the easiest way to identify strong and weak currencies. This indicator shows the relative strength of 8 major currencies + Gold: AUD, CAD, CHF, EUR, GBP, JPY, NZD, USD, XAU. Gold symbol can be changed to other symbols like XAG, XAU etc.
By default the strength value is normalised to the range from 0 to 100 for RSI algorithm: The value above 60 means strong currency; The value below 40 means weak currency;
This indicator needs the data of all 28 major currency pairs

This indicator monitors the vital constants of your trading account to keep it healthy and away from excessive risks. It monitors all trades, absolute exposure, account floating point and leverage currently in use, using different color codes for your interpretation. [ Installation Guide | Update Guide | Troubleshooting | FAQ | All Products ] Amazingly easy to understand The indicator is clean and simple It calculates exposure by pairs and currencies Keep your used leverage controlled at all ti
Multi Timeframe Indicator includes a lot of functions and can be considered as a universal helper for a trader. It's main objective is to display up to 10 indicators at a time using just one small brick per each of them. These indicators involve Awesome Oscillator, CCI, DeMarker, MACD, RSI, RVI, Stochastic, Larry Williams' Percent Range, Bulls Power and Bears Power. An important function of the indicator is an ability to monitor signals from different timeframes. You can choose different combina
The indicator can be used with any time frame and forex pair. One easy to use parameter in the indicator will allow you to adapt the signals to any forex pair and time frame you want to trade.
The Arrows DO NOT REPAINT !
Information Panel: We've equipped this indicator with a user-friendly Panel. one side of the panel, the time frame is displayed, while on the other side, the currency pair is shown. Below that, the direction of the trend is identified, showing whether it is an uptrend or a d
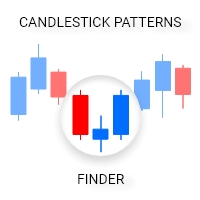
Candlestick Patterns Finder is a great tool to analyze candlestick charts. Indicator contains an advanced search algoritm and friendly graphic interface based on modified EasyAndFastGUI library. Has the ability to recognize 24 candlestick patterns. It was designed with the idea of simple and more efficient use of the indicator. It supports decision-making by automatically identifying candlestick patterns on the chart. The indicator has the ability to run in mode with and without a graphic

Contact me through this email address to download the FREE strategy PDF for this indicator tharindu999lakmal@gmail.com
Download MT5 version here -- >> https://www.mql5.com/en/market/product/119467
Introduction The "VIP Buy Sell Signals MT" is designed to provide BUY and SELL trade signals based on the current market conditions. A Trading Strategy (Chee sheet) has been provided for this trading indicator. (Read the description). This indicator has time tuned e ntry signals . so

The RSI Panel MTF indicator has been created in order to have the ability to monitor the values of the standard RSI indicator from a multitude of timeframes and symbols on a single chart, as well as to receive timely notifications about the trading opportunities using an audio signal or a notification. The indicator can output both the indicator values, and only the indicator signals (confirmed and expected). A user-friendly feature for selecting the required symbol has been implemented - simply

Was: $99 Now: $49
Blahtech Daily Range indicator displays the average daily range alongside the individual session ranges. Using the daily open price as a reference the indicator shows fixed range and dynamic range targets as lines on the charts. These lines clearly show when the average range has been exhausted. Daily and session ranges can be useful for confirming entries or setting targets and is an excellent odds enhancer for many trading systems. Links [ Documentation | Install
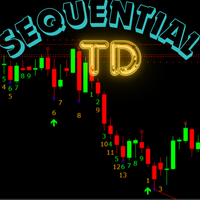
If you are unsure how to use this indicator, please feel free to reach out to me. I will explain it to you and provide reading materials to help you make the most of it. Here’s a brief description of how to use the indicator effectively. How to Use TD Sequential by Tom DeMark The TD Sequential is a technical analysis indicator developed by Tom DeMark, designed to identify potential turning points in market trends. It is widely used by traders to anticipate market reversals and manage trading ris

The Moving Average Convergence/Divergence(MACD) indicator drawn using a tick chart. After launching it, wait for enough ticks to come. Parameters: Fast EMA period - indicator drawn using a tick chart. Slow EMA period - slow period of averaging. Signal SMA period - period of averaging of the signal line. calculated bar - number of bars on the chart for the indicator calculation. The following parameters are intended for adjusting the weight of MACD signals (from 0 to 100). You can find their desc
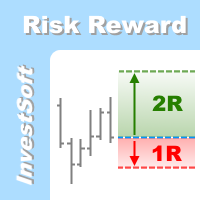
This is the forex visual orders tool & forex position size (lot) calculator with intuitive panel. Risk Reward Ratio Indicator works on all kind of symbols: currency pairs, indices, metals, commodities, cryptocurrencies, etc.
If you want to make sure that Risk Reward Ratio Indicator works on your favorite symbols contact us ( visit our profile ) and ask for 7-day free trial to test this tool without limits. If you want to place orders easier, faster and more intuitive? If you like to mark trad
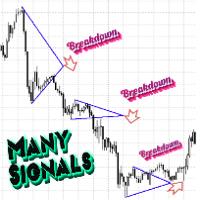
Индикатор уровней треугольник подскажет в какую сторону может двинуться цена при пробитии одной из них.
Если вы сомневаетесь в какую сторону торговать, то этот индикатор вы можете использовать как фильтр на любом инструменте и любом таймфрейме.
Индикатор разработан таким образом , чтобы помочь выявлять направление движения цены.
Стратегия построения прямоугольника работает по авторскому алгоритму нахождения определённых консолидаций.
Цена на индикатор минимальна для первых продаж.
Далее цена 99

Fibonacci Sniper MT4 - No Repaint
Features:
- Indicator sends signals and notifications on key Fibonacci Retracement and Fibonacci Extensions Levels
- Once the buy/sell signal is set, targets ( TP1 TP2 TP3 )and stop loss levels are drawn by the indicator.
- Fibonacci Calculations and Custom Patterns are identified by the last 3 or 5 Zig Zag exterum.
- You can easily identify key harmonic patterns like Gartley, Bat, Butterfly and Crab patterns.
Important Settings: - Choose the Zig Zag Set
EOY Promo - Grab it before Jan 1, 2025 !! Please read before you purchase : - We don't have buyer's detail when purchase was made. In order to get the bonuses, you need to contact me via product comment ( not product review). That way I will contact you back via mql message asking for email. - Please make sure you enable receiving message from non-friend list, otherwise I cannot message you for email. This indicator is not just about Smart Money Concept, with lots of features which I believe cou
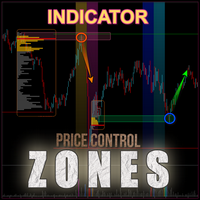
The Bull and Bear Zones indicator is specifically designed for the automatic identification and visual display of support and resistance zones directly on the chart. Its unique algorithm allows it to display not only the zones already tested by the market but also potential target zones that have yet to be tested. The indicator tracks ranges where an imbalance between supply and demand is observed. Key Features: Automatic identification of support and resistance zones : The indicator calculates
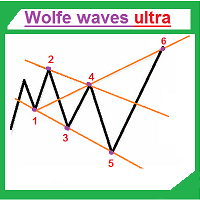
Wolfe waves ultra draws Wolfe Waves automatically. The indicator searches for the Wolfe Waves on three timeframes. This indicator is especially accurate because it waits for a breakout in the wave direction before signaling the trade, resulting in a very high winning ratio.
Features Amazingly easy to trade. The indicator is able to recognize all Wolfe Wave patterns in a specified interval. Thus, we check each extremum for the potential 1,2,3,4,5 points apart from ZigZag vertices. The indicator

True Choppiness Direction determines if the market is choppy (trading sideways) or if it is trending, as well as the trend direction and strength (green=up, red=down, grey=no trend) . The underlying algorithm is designed to detect trend movements even in the presence of noisy market data, please see screenshots. Trend strength is indicated by taller or shorter red/green fill. Choppiness index is range-bound between -50 (very trendy) and +50 (very choppy). This is a custom algorithm designed by u
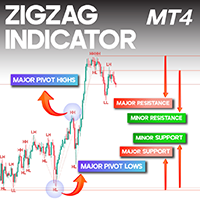
ZigZag with Labels Indicator for MT4
The ZigZag with Labels indicator for MetaTrader 4 highlights key turning points on a price chart where notable fluctuations occur, linking these points to help traders identify market trends. Additionally, it marks pivot points where price direction shifts. These pivots, also referred to as reversal points, arise due to the interaction between supply and demand. There are two main pivot types: major pivots, which indicate substantial price reversals, and min
API TicksVolume mtf - Volume Analysis for Trading The API TicksVolume mtf indicator is a tool for traders who want tick volume analysis to make trading decisions. Designed for MetaTrader 4 , this multi-timeframe (MTF) indicator provides tick volume data with color-coded visual cues , helping traders assess volume strength and possible volume direction across different timeframes. Key Features: Multi-Timeframe Analysis: Monitor tick volume from different timeframes in real time for a broader
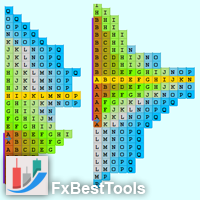
Definition : A Market Profile is an intra-day charting technique (price vertical, time/activity horizontal). Market Profile is best understood as a way to see order in the markets. Market Profile was a way for traders to get a better understanding of what was going on, without having to be on the trading floor. The current indicator is developed based on Easy-to-Use architecture including a wide range of visual settings.
Major Features of Indicator : Various Views of Market Profile The indicat
Special offer! https://www.mql5.com/ru/users/bossik2810
Signal Trend Super Indicator of accurate market entry.
Very good entry indicator for your trading system, I recommend to use it together with - System Trend Pro and Professional Trade Arrow
The indicator does not redraw and does not change its data. Wait until the candle closes.
Any questions? Need help?, I am always happy to help, write me in private messages or
In Telegram
!! FLASH SALE !! Over 80% off !! Now only $47 - normally $297!
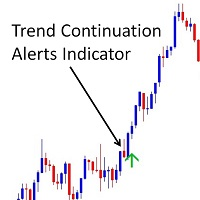
Buy and sell arrows on the chart when the trend is about to continue. Aslo Sends Alerts – On MT4 To Your Phone To Your Email.
Does not repaint.
Works on any pair, any timeframe. (Just ajust the settings for your pair and timeframe.)
10 Activations allowed so you are free from limitations
See an example of alerts from today (23 May 2020) using this and 2 other indicators here . MT5 version here .
Spreads from 0.1pip RAW/

The liquidity swings indicator highlights swing areas with existent trading activity. The number of times price revisited a swing area is highlighted by a zone delimiting the swing areas. Additionally, the accumulated volume within swing areas is highlighted by labels on the chart. An option to filter out swing areas with volume/counts not reaching a user-set threshold is also included.
This indicator by its very nature is not real-time and is meant for descriptive analysis alongside other com
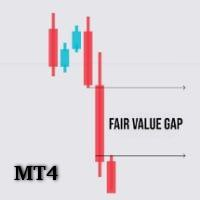
Voici la version coréenne de la description : FVG ANALYZER – 정확한 공정 가치 갭 (FVG) 감지를 위한 궁극적인 도구
FVG Analyzer는 공정 가치 갭(FVG)을 전략에 활용하는 진지한 트레이더들을 위해 설계된 강력하고 완전히 사용자 맞춤화 가능한 지표입니다. 스마트한 감지와 깔끔한 시각화를 통해 이 도구는 가격이 트렌드를 계속하기 전에 돌아올 가능성이 있는 시장 비효율적인 영역을 빠르게 식별할 수 있도록 해줍니다. 주요 기능
캔들 패턴을 기반으로 한 공정 가치 갭(상승 및 하락) 자동 감지 표시할 FVG 유형 선택 가능:
상승만
하락만
둘 다 유연한 시각화 옵션:
채워진 직사각형
중간선
직사각형 + 중간선
직사각형 + 중간선 + 레이블 FVG가 채워질 때까지 동적 확장: 실시간으로 가격 행동을 추적 고급 맞춤화 옵션:
색상, 스타일, 투명도
표시할 최대 FVG 수
각 영역에 선택적 지표 이름
Binary Power Pinbar 2 for MT4 Binary Power Pinbar 2는 모든 통화쌍과 호환되며 모든 시간 프레임에 적합한 바이너리 옵션 지표입니다. 작동 원리 이 지표는 차트에서 "핀바(Pin Bar)" 패턴을 감지합니다. 감지 후: 매수 신호: 가격이 핀바의 최고점을 갱신하면 매수 신호가 생성됩니다. 매도 신호: 가격이 핀바의 최저점을 갱신하면 매도 신호가 생성됩니다. 주요 특징 만료 시간: 기본적으로 1개의 캔들에 설정되어 있지만, 최대 5개까지 선택할 수 있습니다. 권장 설정은 1개 또는 5개입니다. 신호: 버퍼 화살표로 표시됩니다:
빨간색 화살표 — 매도 신호.
파란색 화살표 — 매수 신호. 신호는 이전 캔들에 표시되며 현재 캔들에 적용됩니다. 신호가 늦게 도착한 경우, 시간 프레임에 따라 평가하십시오: M1: 현재 캔들이 열린 후 10초 이상 지난 신호는 무시하십시오. M5: 20초 이내에 도착한 신호를 수락하십시오, 등. 장점 Binary

Binary Options Nuclear Master로 거래를 향상시키세요! 바이너리 옵션 거래를 강화하고 싶으신가요? Binary Options Nuclear Master 는 정교하게 설계된 도구로, 정확한 10분 거래 시간 내에 기회를 포착할 수 있도록 도와줍니다. 2017년부터 2025년 12월까지 평균 72%의 승률 을 자랑하며, 이 지표는 엄격한 백테스팅을 거쳐 시장 변화에 맞춰 지속적으로 업데이트됩니다. Binary Options Nuclear Master를 선택해야 하는 이유: 최적의 거래 시간: 17:55에서 18:05 (MT4 브로커 시간) 사이에 거래를 실행하여 최적의 결과를 얻으세요. 정밀 설정: 정확성을 위해 M1 시간대를 사용하고, 5분 만료 시간을 설정하세요. 사전 경고 기능: Binary Options Nuclear Master는 신호 전 사전 경고 소리와 화살표를 제공하여, 다음 캔들 시작 시 거래를 준비하고 실행

Currency Strength Gauge incicator
The currency strength gauge is an indicator to measure of the strength or weakness of currencies in the Forex market. Comparing the strength of currencies in a graphic representation will lead to a good overview of the market and its future trends. You will see in a graphic chart both the strength of the currencies and their correlation, and this will help you in your decisions to get better trades. -To easy detection of over Overbought and Oversold points,
A real rarity for scalpers.
Are you looking for TFs lower than M1 ?
Do you want to see the price dynamics inside the candle?
This is a tool for you.
Visual Ticks is an indicator that shows the tick chart in a separate window.
He does it in real time waiting for changing ticks.
Thanks to Visual Ticks, we can look inside the traditional candle and see the dynamics of the moving price.
By setting "period_of_model" we can shape a chart made of candles.
"period_of_model" defines how many consecuti

Данный индикатор отмечает участки разворота тренда, в точках разворота давая сигнал на вход в рынок в виде стрелок соответствующего цвета и направления движения в виде линий, а также звукового оповещения. Основан на закономерностях рынка FOREX, точных определениях текущего экстремума и нахождения свечных моделей на вершинах/низах рынка. Универсальный алгоритм помогает определить точки разворота указывая стрелками где осуществить вход в рынок. Дополнительно Индикатор не перерисовывается. Выводит
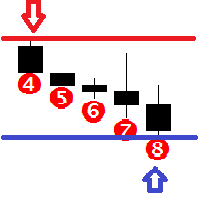
Features This indicator determines consecutive bullish and bearish bars; Determines the High and Low for the last N bars (N can be changed in the settings); It shows the Buy and Sell signals based on the values of other indicators, such as Bollinger Bands, Stochastic and MACD; It graphically displays from 4 to 12 consecutive bullish and bearish bars with an alert; It is possible to disable the alert and unnecessary graphical elements; It is also possible to adjust the number of bars in history,

Trade with Gann on your side!! MASTER CIRCLE 360 CIRCLE CHART, originally created by Gann admitted that this is “The Mother of all charts”. It is one of the last studies that this great trader left for us. The numeric tab le is apparently quite simple like all the tables and is based on square numbers, the SQUARE OF 12 and is by evolution, one of the most important square numbers. Here we can find CYCLE, PRICE AND TIME thanks to angles and grades, to show past and future support and resistance.
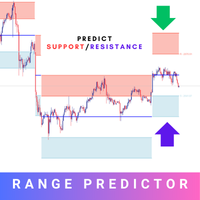
Introducing the Range Predictor : Your Ultimate Guide to Future Trading Ranges! Imagine having the power to see into the future of market moves— Range Predictor brings this dream to life. Designed to deliver real-time, predictive support and resistance levels , this tool goes beyond standard indicators, offering trend direction insights and precise range forecasts . Whether you're a day trader or a swing trader, the Range Predictor is your all-in-one toolkit for mastering the markets. MT5 Ver

The Buyside & Sellside Liquidity indicator aims to detect & highlight the first and arguably most important concept within the ICT trading methodology, Liquidity levels. SETTINGS
Liquidity Levels
Detection Length: Lookback period
Margin: Sets margin/sensitivity for a liquidity level detection
Liquidity Zones
Buyside Liquidity Zones: Enables display of the buyside liquidity zones.
Margin: Sets margin/sensitivity for the liquidity zone boundaries.
Color: Color option for buysid

Kumo Breakout Indicator is a trading system based on Ichimoku Kumo levels.
Parameters
Trader can set Ichimoku parameters like: Tenkan-Sen (tk) Kijun-Sen (kj) Sekou-Span-A (ku) that are the classic parameters allowed on Ichimoku indicator on Metatrader.
Other interesting parameters: "Configure Alerts" PopUpAlert= true or false PushAlert=true or false Mail= true or false and personalized texts for eMails: TextMailUp1="WP Buy "; TextMailUp2="WP Buy write here your text"; TextMailUp3=""; TextM
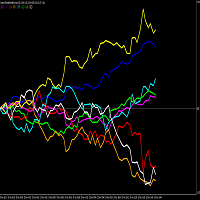
PLEASE NOTE THAT LIKE MANY SUCH INDICATORS ON THIS MARKET, THIS INDICATOR WILL NOT WORK AS A DEMO DOWNLOAD FOR STRATEGY TESTER. Therefore the 1 month option at the lowest cost allowed of $10 is available for you to test. One of the better ways to trade is to analyse individual currencies rather than currency pairs. This is impossible with standard chart indicators on MT4. This currency strength meter allows one to trade the strongest with the weakest currency. The meter includes the curren
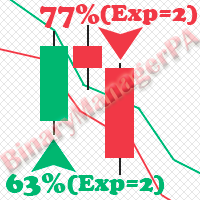
BinaryManagerPA is an indicator for binary options based on the analysis of the Price Action and indicator setups using complex filters. The main advantage of the indicator is that it estimates the current state of the market in advance with using several expiration times. As a result, the indicator generates the statistics on the percentage of successful trades (WinRate) for the selected instrument and timeframe. In addition, the indicator displays the win rate and the recommended expiration fo

Overview: The Candle Pattern Weekly RSI is a powerful MT4 indicator designed to detect high-probability trade setups on the 1h -timeframe chart while aligning with the weekly trend . It filters signals using a unique three-candle pattern and other Pri ce actions , a minimum price move from the weekly open , and RSI confirmation to enhance accuracy and reduce false signals. Key Features: Weekly Trend Confirmation: Only takes buy trades when the Weekly candle is bullish and sell trades when i

Description Candle Power Color indicator which shows when the market is trending and when it is in a sideway movement KEY LINKS: How to Install – Frequent Questions - All Product How is this indicator useful? It allow to detect trend and sideway movements in market NEVER repaints. It adapts to any market and asset. It can support any other trading strategy. Note 1: This indicator should only be considered as a part of any trading strategy. You should complement this with other filters (e.
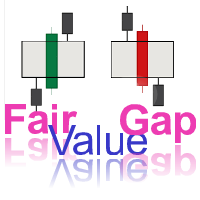
**Added to the Original Text:**
This indicator (Fair Value Gap - FVG) also **has the capability** to display **multiple timeframes** of your choice **simultaneously on a single chart**. This feature allows you to identify **stronger and more accurate signals**, as you can analyze price discrepancies (Gaps) across higher or lower timeframes, helping you make smarter trading decisions.
For example, if you spot a bullish FVG on the **1-hour timeframe** and it is also confirmed on the **4-hour

The indicator displays Renko bars on the chart and uses them to plot the ZigZag - trend lines connecting the local Lows and Highs of the price movement. Renko - specialized display of the price action, in which the graph is displayed not every bar of the time frame, but only under the condition that the price had passed more than the specified number of points. Renko bars are not bound to a time frame, so the indicator can work on any time frame with the same efficiency. This implementation of t
MetaTrader 플랫폼 어플리케이션 스토어에서 MetaTrader 마켓에서 트레이딩 로봇을 구매하는 방법에 대해 알아 보십시오.
MQL5.community 결제 시스템은 페이팔, 은행 카드 및 인기 결제 시스템을 통한 거래를 지원합니다. 더 나은 고객 경험을 위해 구입하시기 전에 거래 로봇을 테스트하시는 것을 권장합니다.
트레이딩 기회를 놓치고 있어요:
- 무료 트레이딩 앱
- 복사용 8,000 이상의 시그널
- 금융 시장 개척을 위한 경제 뉴스
등록
로그인
계정이 없으시면, 가입하십시오
MQL5.com 웹사이트에 로그인을 하기 위해 쿠키를 허용하십시오.
브라우저에서 필요한 설정을 활성화하시지 않으면, 로그인할 수 없습니다.