Gann Method Scanner MT4
- 지표
-
Elif Kaya
 Beware :
I just sell my products on Elif Kaya profile, any other websites are stolen old versions, So no any new updates or support.
If you want to have lifetime update free, guide file and adding in Elif Trader Group, just buy from me.
Contact me for more info. - 버전: 2.1
- 업데이트됨: 5 6월 2026
- 활성화: 5
- Real price is 800$ - 50% Discount (It is 39$ now) - It is enabled for 1 purchase.
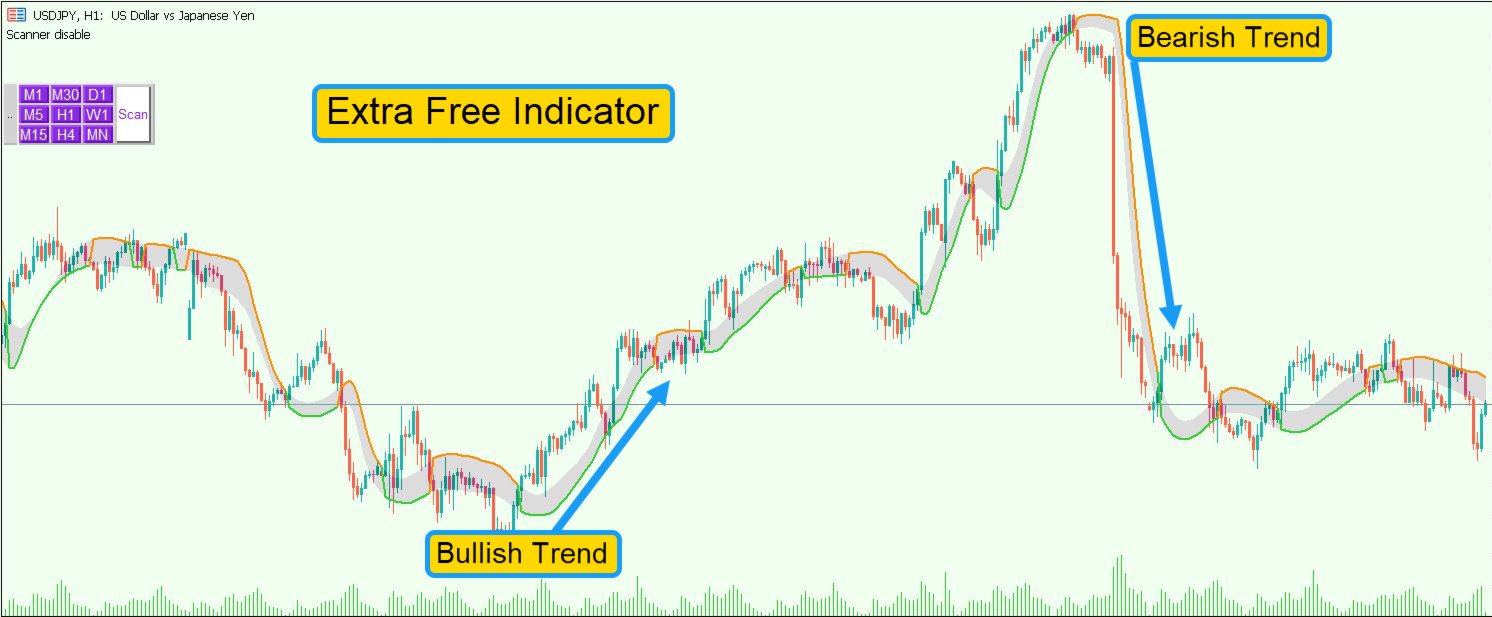
Contact me for extra bonus (Gann Trend indicator), instruction or any questions!
- Non-repaint, No lag
- I just sell my products in Elif Kaya Profile, any other websites are stolen old versions, So no any new updates or support.
- Lifetime update free
Introduction
W.D. Gann’s theories in technical analysis have fascinated traders for decades. It offers a unique approach beyond traditional chart patterns. This method integrates geometry, time cycles, and even astrology to predict market movements accurately.
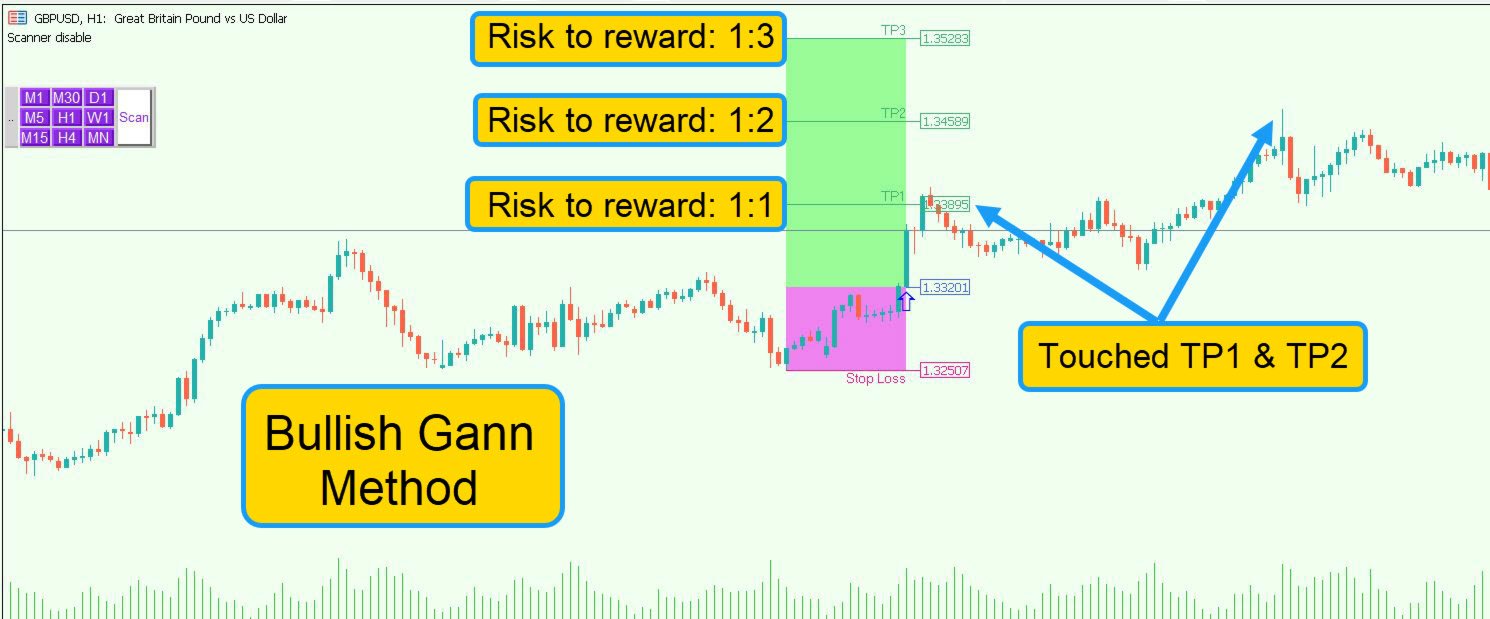
Gann showed the price and time move in harmony. It forms predictable angles and patterns. By analyzing these elements, traders should identify support, resistance, and trend reversals.
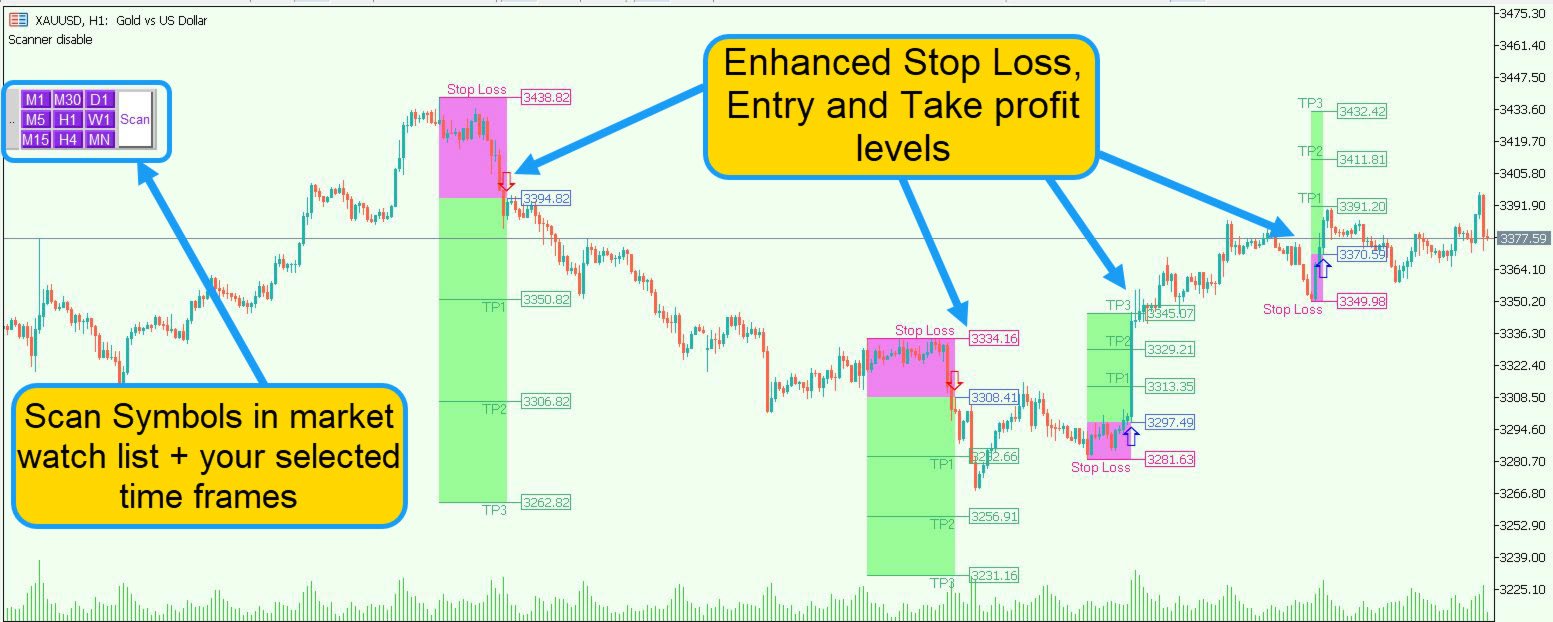
Gann Method Scanner uses Gann techniques with easy signals for traders.
Gann Method Scanner Indicator
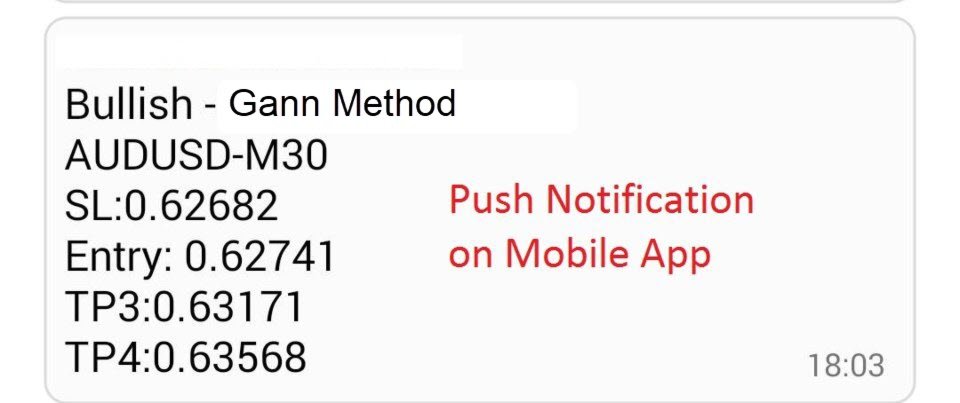
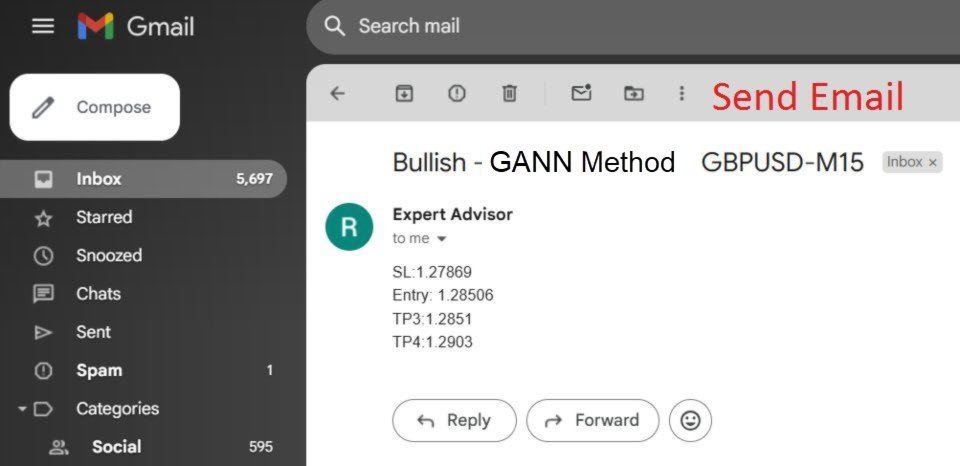
Scan, Fibonacci calculations and pattern recognition are completely done by Gann Method Scanner indicator; All you do is "press the scan button". It sends alert and push notification on your mobile.
Advantages
- Lifetime update free
- Non-repaint
- No lag
How To Work
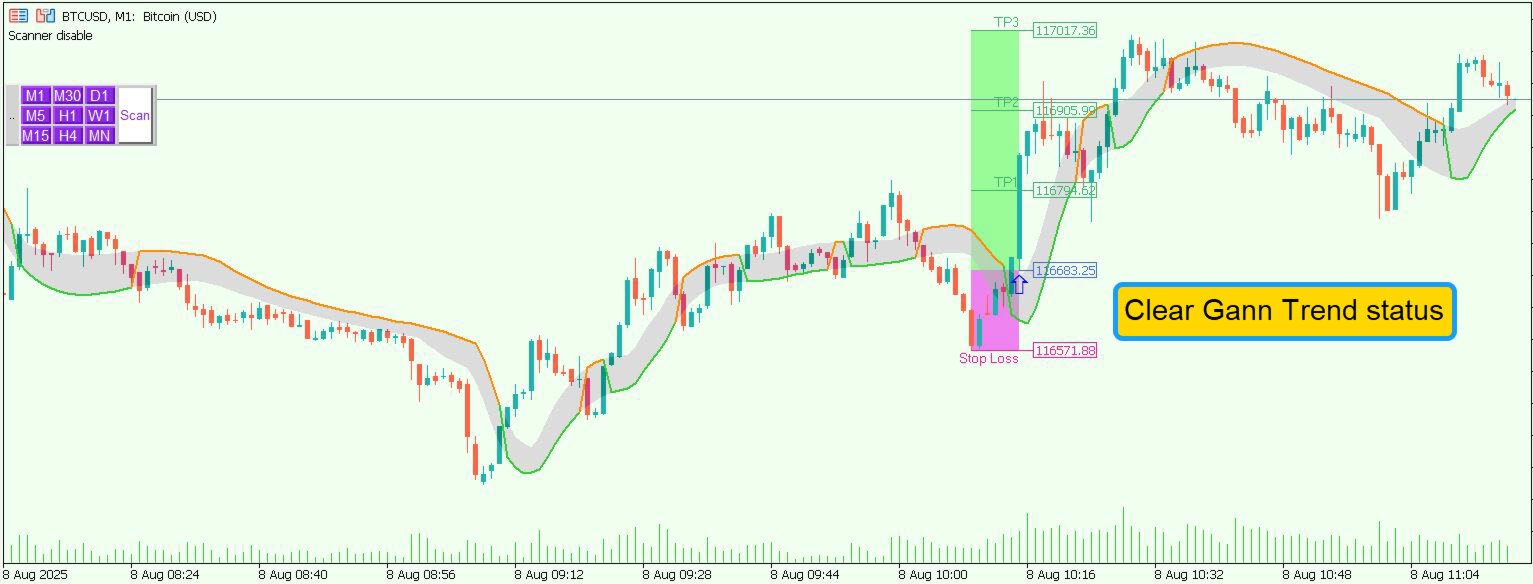


From the days of testing, I noticed how cleanly it filtered out false signals during choppy markets. Instead of repainting or over-fitting, it reacts to price with an almost perfect sensitivity, quick enough to catch strong momentum but stable enough to keep you from being shaken out by minor fluctuations. Really reccomended indicator, good winrate and risk reward ratio.