Prime Trend Pro

PrimeTrend Pro

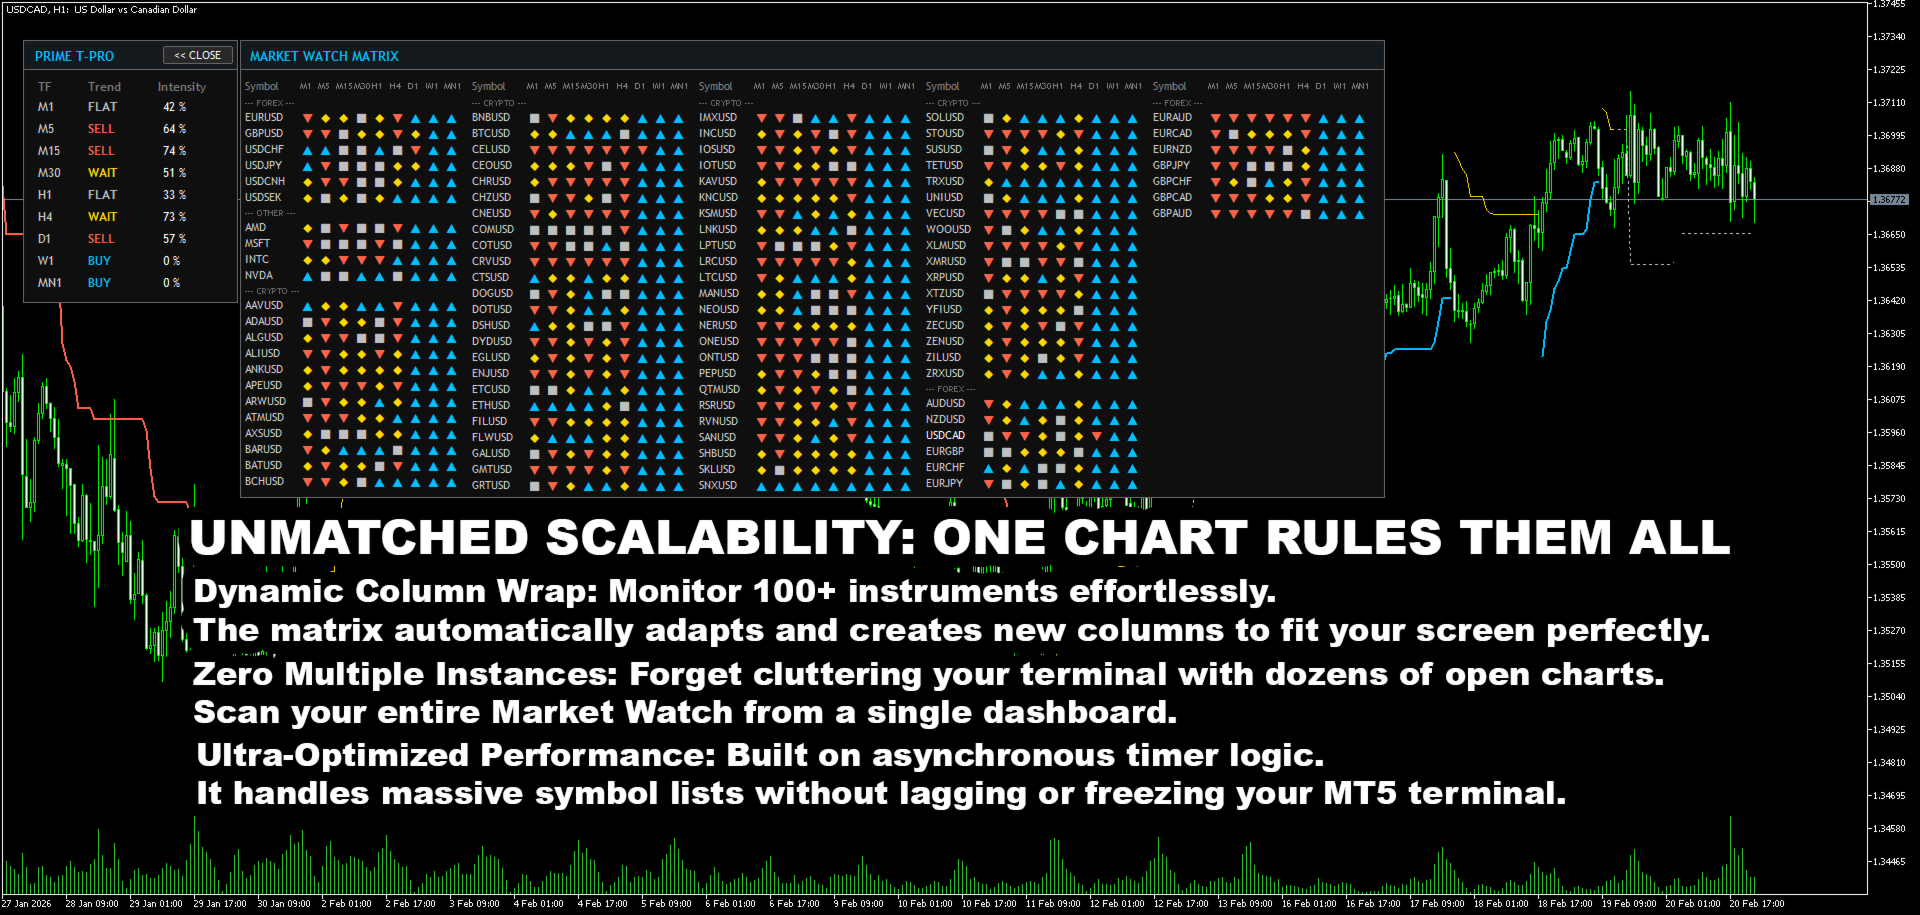
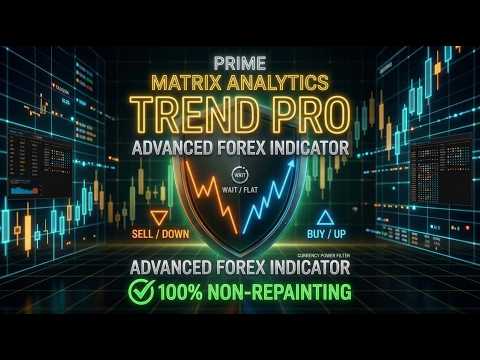
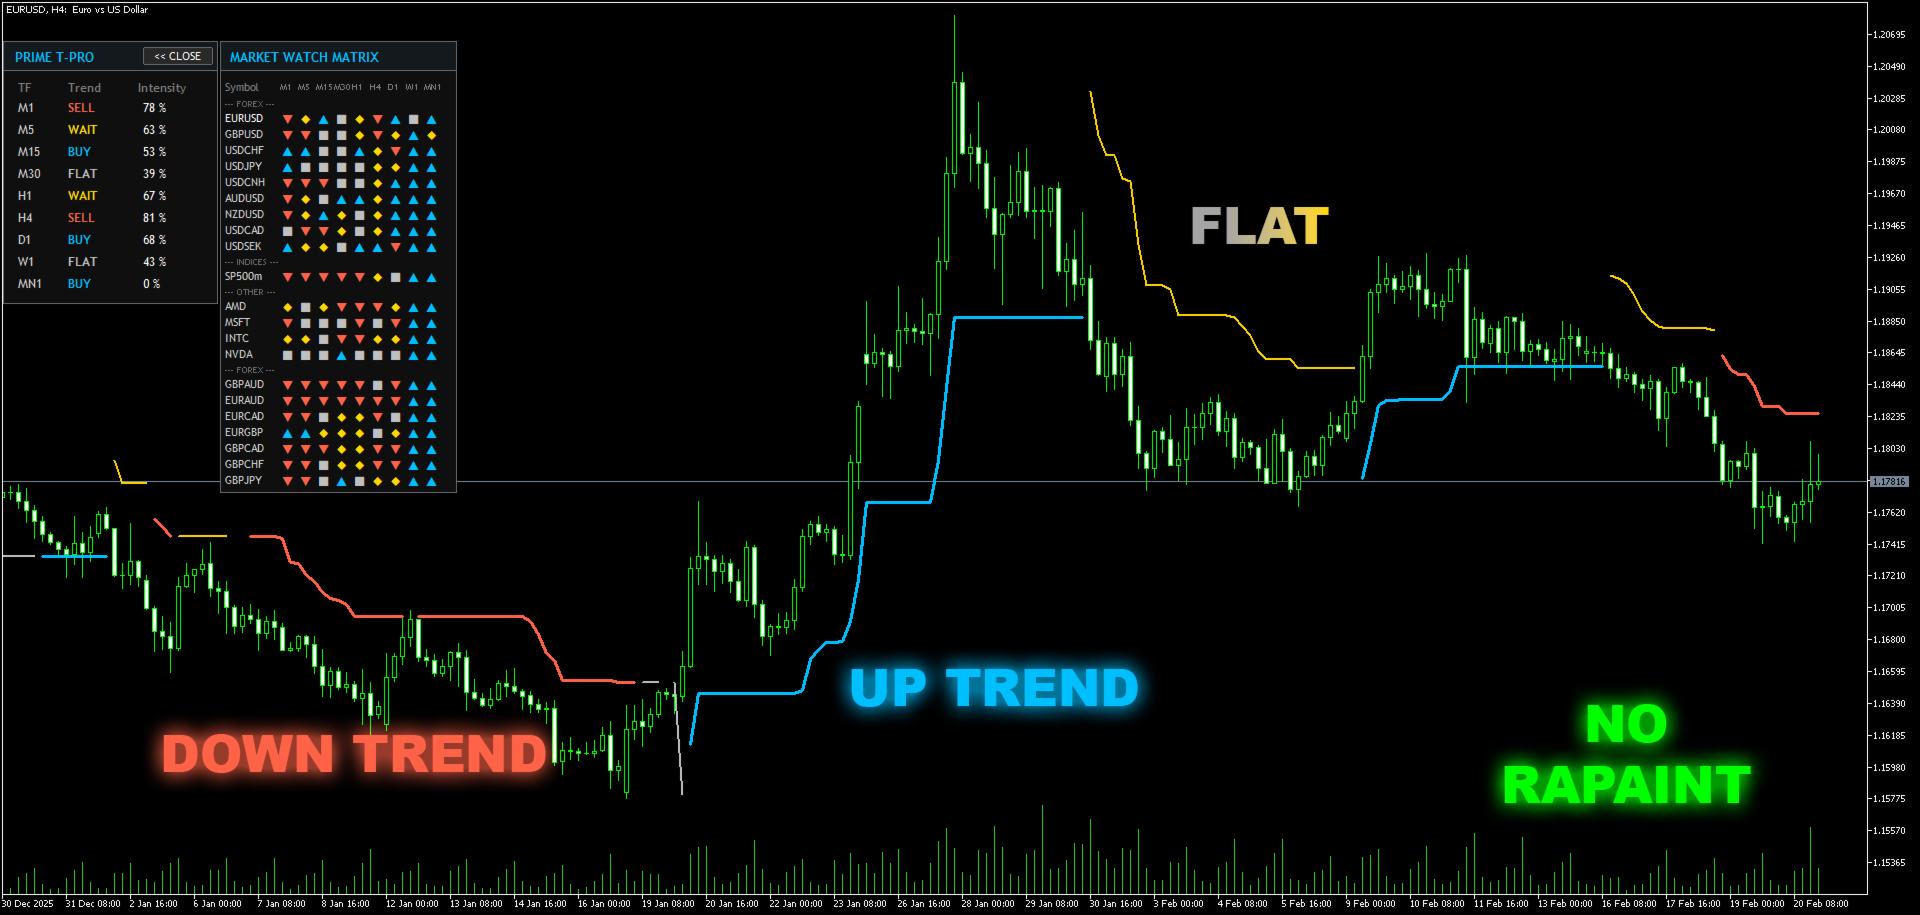
PrimeTrend Pro est un indicateur de suivi de tendance basé sur un moteur de canal ATR à cliquet. Il intègre un ensemble de filtres indépendants de qualité de signal ainsi qu'un tableau de bord multi-symbole et multi-période. L'indicateur est conçu pour afficher trois informations sur un seul écran : la direction actuelle de la tendance, la fiabilité du signal en cours et le degré de concordance avec les autres périodes et symboles.

Il s'agit d'un indicateur. Il n'ouvre, ne modifie ni ne clôture aucune position. Toutes les décisions de trading relèvent de la responsabilité de l'utilisateur. L'indicateur ne garantit aucun résultat de trading. Testez-le sur un compte démo avant toute utilisation.

Moteur

Le cœur du système est un canal ATR à cliquet unidirectionnel : dans une tendance haussière, le niveau de support ne peut que monter ; dans une tendance baissière, le niveau de résistance ne peut que descendre. La version 2.7 ajoute les options suivantes.

Hystérésis de retournement. Un retournement de tendance nécessite que la clôture franchisse le niveau d'une fraction supplémentaire configurable de l'ATR, ce qui réduit les retournements causés par de brefs pics en marché sans tendance.

Confirmation sur deux bougies (optionnelle). La première clôture franchissant le niveau active un état en attente. Le retournement n'est appliqué que si la bougie suivante clôture également au-delà du niveau.

Multiplicateur adaptatif (optionnel). La largeur du canal est ajustée selon le rapport entre l'ATR rapide et l'ATR lent, dans une plage fixe. Le canal s'élargit lorsque la volatilité augmente et se resserre lorsqu'elle diminue.

Deux modes de cliquet. Le mode classique ancre le canal sur la médiane de la bougie. Le mode Chandelier l'ancre sur le plus haut et le plus bas de la période, suivant le prix de plus près lors des tendances fortes.

Initialisation fondée sur les données. La direction initiale de la tendance est déterminée à partir des données de prix plutôt que d'une valeur fixe, de sorte que la ligne historique ne dépend pas de la quantité d'historique chargée.

Filtres de qualité du signal

Chaque filtre peut être activé ou désactivé individuellement. Un signal qui ne passe pas un filtre n'est pas masqué : il est tracé dans une couleur différente, de sorte que la raison de l'absence d'un signal clair d'achat ou de vente reste toujours visible.

Filtre du ratio d'efficacité (Efficiency Ratio). Mesure le caractère directionnel du mouvement récent du prix et marque les mouvements peu efficaces comme neutres.

Filtre ADX. Filtre classique de marché sans tendance, pouvant être utilisé conjointement avec le filtre du ratio d'efficacité ou à sa place.

Confirmation par delta de volume. L'indicateur calcule le delta de volume des ticks en comparant le volume des bougies haussières à celui des bougies baissières sur une fenêtre donnée. Une tendance d'achat sans dominance acheteuse, ou une tendance de vente sans dominance vendeuse, est marquée comme non confirmée.

Filtre de référence. Les signaux allant à l'encontre d'une EMA à longue période sont marqués comme contraires à la tendance.

Filtre de volume. Les signaux formés avec un volume anormalement bas sont marqués comme peu fiables. Le volume de la bougie en formation est ajusté en fonction du temps écoulé, afin d'éviter un marquage injustifié.

Bougie en cours stable

Les filtres fondés sur des fenêtres glissantes génèrent du bruit pendant la formation de la bougie en cours, ce qui peut provoquer plusieurs changements d'état au sein d'une même bougie. L'indicateur enregistre un instantané des résultats des filtres sur la dernière bougie clôturée et fige la classification de la bougie en cours jusqu'à sa clôture. Les bougies clôturées ne sont jamais recalculées.

Tableau de bord

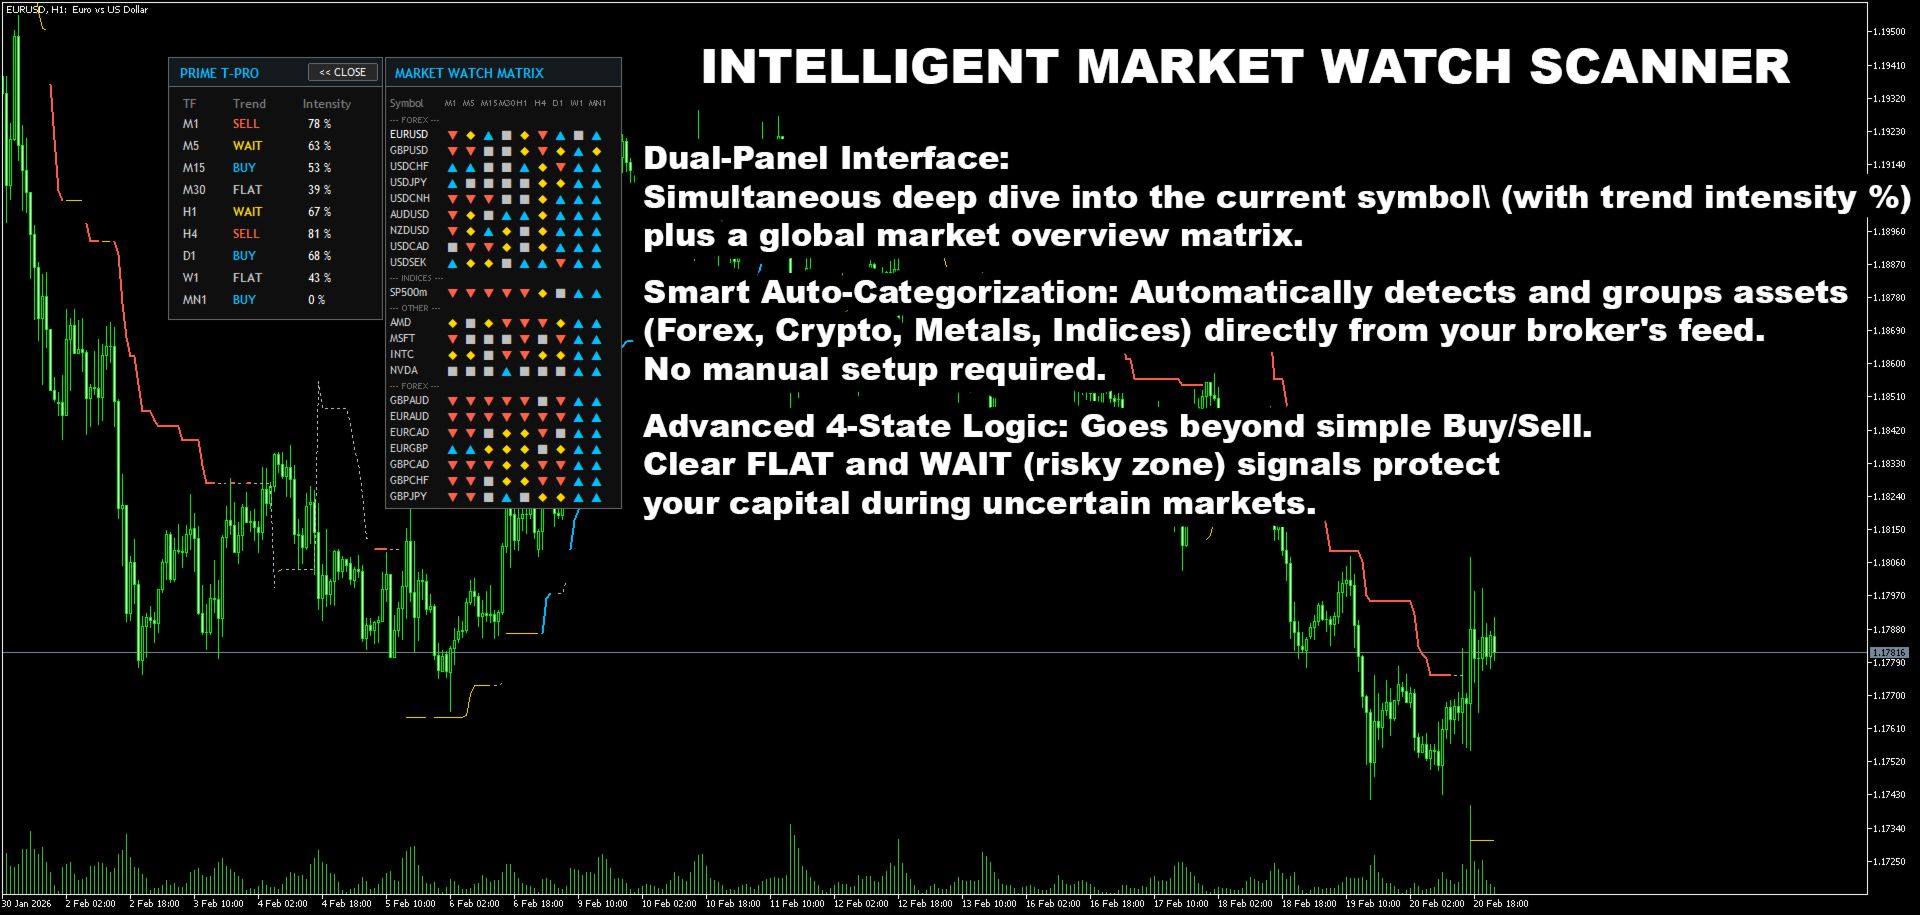
Colonne des périodes. État de la tendance et dominance signée du delta de volume pour le symbole actuel, de M1 à MN1.

Matrice de marché. Le même balayage sur neuf périodes pour chaque symbole de la fenêtre Market Watch ou d'une liste personnalisée, avec regroupement par classe d'actif, tri par catégorie, nom, concordance haussière ou baissière, infobulles pour chaque cellule et mini-graphiques de l'historique du delta. Un clic sur le nom d'un symbole fait basculer le graphique vers ce symbole.

Panneau de delta de volume. Un histogramme de la dominance signée du delta sur les 35 dernières bougies.

Score de confluence. Une valeur unique résumant la concordance entre les neuf périodes. En mode pondéré, les périodes supérieures comptent davantage, ce qui évite que plusieurs graphiques en minutes corrélés ne faussent le résultat. Un mode de comptage simple est également disponible.

Mode bougie confirmée. Lorsque les alertes sont configurées uniquement à la clôture des bougies, l'ensemble du panneau se base sur la dernière bougie clôturée de chaque période et ne change pas en cours de formation.

Le panneau peut être déplacé, sa position est enregistrée par graphique, et il peut être affiché derrière les bougies.

Alertes

Des alertes à l'écran, push et par email peuvent être activées pour les changements de tendance de chaque symbole et période affichés dans la matrice. En mode confirmé, les alertes n'utilisent que les données des bougies clôturées. Le premier balayage suivant l'attachement de l'indicateur enregistre uniquement l'état initial et n'envoie aucune alerte.

Remarques sur les performances

Aucune lecture d'indicateur n'est effectuée dans le chemin de dessin. Toutes les données multi-symboles sont mises en cache et actualisées via un minuteur. Les données des autres symboles ne sont demandées qu'à l'ouverture de la matrice. Le delta de volume, la moyenne de volume et le ratio d'efficacité utilisent un calcul par fenêtre glissante. Le panneau n'est redessiné que lorsque les données changent réellement. Le nombre de symboles balayés est limité par un paramètre d'entrée.

Paramètres d'entrée

Stratégie principale

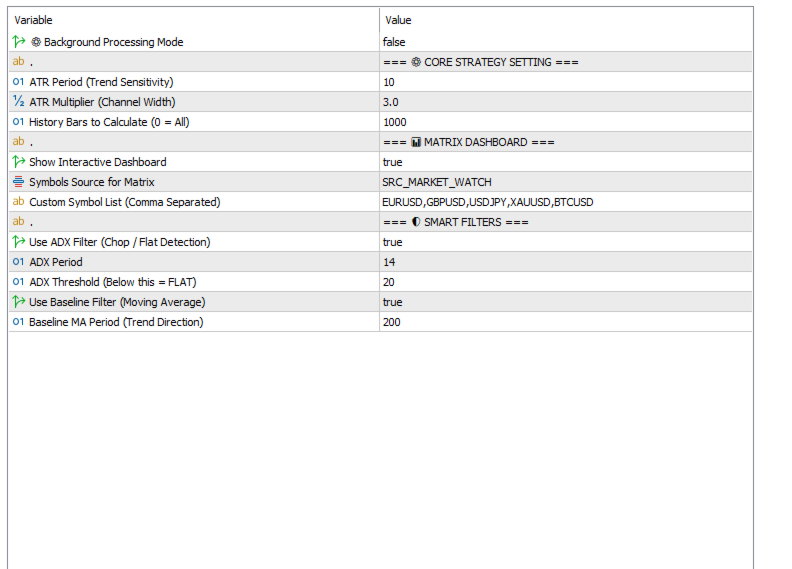
  • ATR Period, valeur par défaut 10. Sensibilité de la tendance. Une valeur plus basse donne une réaction plus rapide et davantage de retournements.
  • ATR Multiplier, valeur par défaut 3.0. Largeur du canal. Une valeur plus basse donne un canal plus étroit et davantage de retournements.
  • History Bars, valeur par défaut 1000. Nombre de bougies à calculer. Zéro signifie tout l'historique.

Moteur

  • Ratchet Anchor Mode, valeur par défaut Classic. Ancrage classique ou Chandelier.
  • Flip Hysteresis, valeur par défaut 0.15. Profondeur de franchissement supplémentaire en unités d'ATR. Zéro désactive l'option.
  • Confirm Bars, valeur par défaut 0. Mettre à 1 pour exiger une deuxième clôture au-delà du niveau.
  • Adaptive Multiplier, valeur par défaut false. Ajuste la largeur du canal selon le régime de volatilité.
  • Slow ATR Period, valeur par défaut 100. Période de référence pour le multiplicateur adaptatif.
  • Min et Max Factor, valeurs par défaut 0.7 et 1.6. Plage de limitation pour l'ajustement adaptatif.
  • Stable Live Bar, valeur par défaut true. Fige les résultats des filtres de la bougie en cours sur les données de la bougie clôturée.

Filtres

  • Use ADX Filter, valeur par défaut false. Un ADX inférieur au seuil marque l'état comme neutre.
  • Use ER Gate, valeur par défaut true. Un ratio d'efficacité inférieur au niveau marque l'état comme neutre.
  • ER Period et Level, valeurs par défaut 20 et 0.30.
  • Use Delta Confirm, valeur par défaut true. Une tendance contraire au delta de volume est marquée comme non confirmée.
  • Delta Min Percent, valeur par défaut 50. Dominance requise du côté de la tendance, de 50 à 100.
  • Use Baseline Filter, valeur par défaut false. Les signaux contraires à l'EMA à longue période sont marqués comme non confirmés.
  • Use Volume Filter, valeur par défaut false. Les signaux à faible volume sont marqués comme peu fiables.

Lecture de la ligne du graphique

L'indicateur trace une ligne de suivi. Sa couleur et son style traduisent l'état.

  • Bleu plein : tendance haussière confirmée, tous les filtres activés ont été validés. La ligne peut servir de référence de suivi.
  • Rouge plein : tendance baissière confirmée, tous les filtres activés ont été validés.
  • Gris pointillé : état neutre selon le filtre du ratio d'efficacité ou de l'ADX.
  • Or plein : une tendance existe, mais l'un des filtres de confirmation n'a pas été validé.

La ligne sur les bougies clôturées ne change pas. La tendance sur la bougie en formation peut évoluer avec la clôture actuelle, ce qui est inhérent à toute logique fondée sur le prix de clôture. Avec les paramètres par défaut, la classification de couleur de la bougie en cours reste figée jusqu'à sa clôture.

Réglages suggérés

Prudent : valeurs par défaut avec Confirm Bars réglé sur 1. Moins de signaux et un décalage d'une bougie lors des retournements. Convient à H1 et au-delà.

Équilibré : valeurs par défaut. Hysteresis 0,15, filtre du ratio d'efficacité activé, confirmation par delta activée. Convient de M15 à H4.

Rapide : Flip Hysteresis réglé sur 0,05, ER Level sur 0,20, confirmation par delta désactivée. Davantage de signaux et de bruit. Destiné aux symboles liquides et aux périodes courtes.

Avant de modifier d'autres paramètres, exécutez le profil choisi sur un graphique démo pendant un certain temps, et ne modifiez qu'un seul paramètre à la fois.

Remarques supplémentaires

Dans le Testeur de stratégie, le panneau n'affiche que le symbole testé, car le testeur ne fournit pas les données des autres symboles à un indicateur multi-symbole. La ligne de signal et l'ensemble de la logique des filtres fonctionnent dans le testeur exactement comme en conditions réelles.

Lors de la première ouverture de la matrice, certaines cellules restent vides jusqu'à ce que le terminal charge l'historique du symbole et de la période correspondants.

Sur les symboles peu liquides, la valeur du delta peut rester brièvement proche de son maximum. Augmenter la période de calcul du delta de volume réduit cet effet.

L'indicateur n'effectue aucune opération de trading. Les valeurs des buffers sont accessibles en lecture depuis un Expert Advisor : les buffers 0 à 3 contiennent les états de la ligne, le buffer 4 la direction de la tendance et le buffer 6 la valeur signée du delta.

Le support et les questions sont traités dans la section commentaires du produit et via le système de messagerie de mql5.com.
추천 제품
Stratos Pali
Michela Russo
4.43 (7)
Stratos Pali Indicator   is a revolutionary tool designed to enhance your trading strategy by accurately identifying market trends. This sophisticated indicator uses a unique algorithm to generate a complete histogram, which records when the trend is Long or Short. When a trend reversal occurs, an arrow appears, indicating the new direction of the trend. Important Information Revealed Leave a review and contact me via mql5 message to receive My Top 5 set files for Stratos Pali at no cost! Dow
PipFinite Razor Scalper
Karlo Wilson Vendiola
4.4 (47)
Pipfinite creates unique, high quality and affordable trading tools. Our tools may or may not work for you, so we strongly suggest to try the Demo Version for MT4 first. Please test the indicator prior to purchasing to determine if it works for you. We want your good reviews, so hurry up and test it for free...we hope you will find it useful. Combo Razor Scalper with Trend Laser Strategy: Scalp in the direction of the trend Watch Video: (Click Here) Features Scalping indicator using a confirme
Indicator MTF Qristalium Arrows is a semi - automatic trading system. It works on all currency pairs.  The indicator uses three rules: 1) we trade only on the trend, 2)"buy when everyone sells and sell when everyone buys", 3) the Price always goes against the crowd.  Indicator MTF Arrows Qristalium filter rules across multiple time frames using the built-in indicators. If the trend matches on the selected time intervals, the indicator will give an arrow to enter the market. Then you make yo
EZZ Zig Zag MT4
Paulo Rocha
5 (1)
EZZ Elite Zig Zag is an indicator for the MetaTrader 4 terminal. This indicator traces the peak of the trend based on the market reversal, thus showing various opportunities in the financial market. EZZ Elite Zig Zag is a visual tool, intuitive, and easy to understand and use.  Test it Yourself by Downloading it for Free. Author Paulo Rocha all rights reserved
Fibonacci retracement and extension line drawing tool Fibonacci retracement and extended line drawing tool for MT4 platform is suitable for traders who use  golden section trading Advantages: There is no extra line, no too long line, and it is easy to observe and find trading opportunities Trial version: https://www.mql5.com/zh/market/product/35884 Main functions: 1. Multiple groups of Fibonacci turns can be drawn directly, and the relationship between important turning points can be seen
ACB Trade Filter MT4
KEENBASE SOFTWARE SOLUTIONS
5 (1)
주문을 넣기 전에 ACB Trade Filter는 한 가지 실용적인 질문에 답하도록 도와줍니다. 시장이 이 거래를 지지하고 있는지, 아니면 엇갈린 조건에서 신호를 억지로 받아들이고 있는지를 확인하는 것입니다. 이 지표는 시장 심리와 추세를 분석한 뒤 색상 히스토그램과 추세 방향으로 결과를 보여줍니다. 기존 진입 신호가 나온 후 확인용으로 사용하고, 진입 시스템을 대신하는 용도로 사용하지 마세요. 세 가지 시장 상태를 한눈에 확인 녹색 히스토그램과 상승 추세: 자신의 전략에 따라 매수 설정을 찾을 수 있는 조건입니다. 빨간색 히스토그램과 하락 추세: 자신의 전략에 따라 매도 설정을 찾을 수 있는 조건입니다. 회색 히스토그램 또는 횡보 추세: 방향이 불분명하므로 해당 설정을 건너뛰는 편이 나을 수 있습니다. 전략 안에서 활용하는 방법 진입 지표가 신호를 만들면 실행하기 전에 ACB Trade Filter를 확인합니다. 히스토그램과 추세가 거래 방향과 일치하면 기존 분석을 계속합니다. 서
Cosmic Diviner X Planet
Olena Kondratenko
4 (2)
This unique multi-currency strategy simultaneously determines the strength of trends and market entry points, visualizing this using histograms on the chart. The indicator is optimally adapted for trading on the timeframes М5, М15, М30, Н1. For the convenience of users, the indicator renders the entry point (in the form of an arrow), recommended take profit levels (TP1, TP2 with text labels) and the recommended Stop Loss level. The take profit levels (TP1, TP2) are automatically calculated for
Blahtech Market Profile
Blahtech Limited
4.53 (15)
Was: $249  Now: $99   Market Profile defines a number of day types that can help the trader to determine market behaviour. A key feature is the Value Area, representing the range of price action where 70% of trading took place. Understanding the Value Area can give traders valuable insight into market direction and establish the higher odds trade. It is an excellent addition to any system you may be using. Blahtech Limited presents their Market Profile indicator for the MetaTrader community. Ins
"다이내믹 플로우 오실레이터"는 MT4를 위한 고급 맞춤형 암호화폐/외환 지표이자 효율적인 트레이딩 도구입니다! - 차세대 오실레이터 - 사용 방법은 그림을 참조하세요. - 다이내믹 플로우 오실레이터는 적응형 과매도/과매수 영역을 제공합니다. - 지표는 가격 및 거래량 데이터를 사용하여 과매도 및 과매수 영역을 식별합니다. - 오실레이터는 과매도/과매수 영역에서 정확한 진입 시점을 찾는 보조 도구입니다. - 과매도 값: 녹색선 아래, 과매수 값: 빨간색선 위. - 일반 오실레이터보다 훨씬 정확합니다.  - PC 및 모바일 알림 기능 제공. 여기를 클릭하여 고품질 트레이딩 로봇과 지표를 확인하세요! MQL5 웹사이트에서만 제공되는 오리지널 제품입니다. .................................................................
Performance Analytics FX
Cesar Jose Perez Beltran
Performance Analytics 1.4 is an advanced real-time performance-tracking and risk-management indicator designed for traders who work with multiple EAs or simultaneous setups and need accurate, persistent, instance-separated metrics. It displays on-screen key statistics for both the entire account and the current EA, including profits, maximum losses, professional performance metrics, and smart alerts. The indicator visually divides the information into two independent blocks : 1. White Block – Ge
Manual Zone Lines Pro는 MT4 차트에서 수동 가격 구간과 오른쪽으로 연장되는 라인을 만들 수 있는 차트 보조 도구입니다. 멀티 타임프레임 표시와 알림 기능도 함께 사용할 수 있습니다. MT4의 기본 수평선과 달리, 이 도구로 만든 라인은 왼쪽으로 무한히 연장되지 않습니다. 라인을 만든 지점에서 시작해 오른쪽의 최신 캔들 부근까지 연장되므로, 차트가 더 깔끔해지고 라인을 어디서부터 그었는지 쉽게 확인할 수 있습니다. 가격 구간도 버튼 한 번으로 만들 수 있습니다. 생성한 구간과 라인은 최신 캔들 부근까지 자동으로 연장되기 때문에, 오른쪽 끝을 반복해서 수동으로 조정할 필요가 없습니다. Pro 버전에서는 최대 2개의 구간과 2개의 라인을 만들 수 있습니다. 또한 멀티 타임프레임 표시를 지원하므로, 한 시간대에서 만든 구간과 라인을 다른 시간대에서도 볼 수 있습니다. 예를 들어 M1에서 만든 구간과 라인을 M5에서 표시할 수 있습니다. Manual Zone Lines P
The Th3Eng PipFinite indicator is based on a very excellent analysis of the right trend direction with perfect custom algorithms. It show the true direction and the best point to start trading. With StopLoss point and Three Take Profit points. Also it show the right pivot of the price and small points to order to replace the dynamic support and resistance channel, Which surrounds the price. And Finally it draws a very helpful Box on the left side on the chart includes (take profits and Stop loss
Gann Square of 144
Taras Slobodyanik
5 (6)
The Gann Box (or Gann Square) is a market analysis method based on the "Mathematical formula for market predictions" article by W.D. Gann. This indicator can plot three models of Squares: 90, 52(104), 144. There are six variants of grids and two variants of arcs. You can plot multiple squares on one chart simultaneously. Parameters Square — selection of a Gann square model: 90 — square of 90 (or square of nine); 52 (104) — square of 52 (or 104); 144 — universal square of 144; 144 (full) — "ful
FX Strength Meter Pro 는 외환 시장에서 최적의 거래 기회를 찾고자하는 트레이더들을 위해 설계된 강력한 지표입니다. 우리의 지표는 실시간으로 주요 통화 쌍 (USD, EUR, GBP, CHF, AUD, NZD, JPY, CAD)의 상대적 강도를 표시하여 거래 전략을 최적화하는 데 도움을 줍니다. 주요 특징은 다음과 같습니다: - 다중 시간대 지원: 분 차트부터 월 차트까지 (M1, M5, M15, M30, H1, H4, D1, W1, MN1), 사용자는 표시할 시간대를 선택할 수 있으며, 왼쪽에 강한 통화가 오른쪽으로 갈수록 약해집니다. - 실시간 업데이트: 초당 업데이트를 통해 사용자는 항상 최신의 통화 강도 데이터를 얻을 수 있습니다. - 명확한 시각화: 강도 관계는 강한 것부터 약한 것까지 명확하게 표시되어 신속한 거래 결정을 지원합니다. - 사용자 정의 가능한 표시: 텍스트 색상, 글꼴 크기 및 줄 간격을 개인의 취향과 필요에 맞게 조정할 수 있습니다.
고급 맞춤형 Crypto_Forex 지표 "적응형 트레이딩 오실레이터" - MT4를 위한 효율적인 보조 트레이딩 도구! - 이 지표는 차세대 오실레이터입니다. 사용 방법은 그림을 참조하세요. - "적응형 트레이딩 오실레이터"는 조정 가능한 적응형 과매도/과매수 영역을 제공합니다. - 이 오실레이터는 동적인 과매도/과매수 영역에서 청산 시점을 정확하게 파악하는 보조 도구입니다. - 과매도 영역: 녹색선 아래 - 과매수 영역: 노란색선 위 - 이 지표는 가격 변동 패턴 및 추세 전략과 함께 사용하기에 적합합니다. - 일반 오실레이터보다 훨씬 정확합니다. - 모든 시간대에서 사용할 수 있습니다. - PC 및 모바일 알림 기능이 내장되어 있습니다. 여기를 클릭하여 고품질 트레이딩 로봇과 지표를 확인하세요! MQL5 웹사이트에서만 제공되는 정품 제품입니다.
캔들의 종가를 예측하는 지표입니다. 지표는 주로 D1 차트에서 사용하기 위한 것이. 이 지표는 전통적인 외환 거래와 바이너리 옵션 거래 모두에 적합합니다. 지표는 독립형 거래 시스템으로 사용하거나 기존 거래 시스템에 추가로 사용할 수 있습니다. 이 표시기는 현재 양초를 분석하여 양초 본체 내부의 특정 강도 요인과 이전 양초의 매개변수를 계산합니다. 따라서 지표는 시장 움직임의 추가 방향과 현재 양초의 종가를 예측합니다. 이 방법 덕분에 지표는 단기 및 중장기 거래 모두에 적합합니다. 지표를 사용하면 시장 상황을 분석하는 동안 지표가 생성할 잠재적 신호의 수를 설정할 수 있습니다. 표시기 설정에는 이를 위한 특별한 매개변수가 있습니다. 또한 인디케이터는 새로운 신호에 대해 차트의 메시지 형태, 이메일 및 PUSH 알림 형태로 알릴 수 있습니다. 구매 후 저에게 꼭 써주세요! 나는 당신에게 지표와 거래에 대한 나의 추천을 줄 것입니다! 또한 보너스를 받으세요!
ZhiBiMACD MT4
Qiuyang Zheng
4.5 (2)
This is a unique MACD indicator that is more accurate and easy to use than traditional MACD. It is suitable for any chart cycle and is suitable for any market variety. The red column is the (Buy) band signal, and the blue column is the (Sell) band signal. The yellow and green lines are trend lines, and the two lines never cross. Buy: In the blue column, look at the green line up through the middle 0 axis. Sell: In the red column, look at the yellow line down the middle 0 axis. The MACD's de
Trade with Gann on your side!! MASTER CIRCLE 360 CIRCLE CHART, originally created by Gann admitted that this is “The Mother of all charts”. It is one of the last studies that this great trader left for us. The numeric tab le is apparently quite simple like all the tables and is based on square numbers, the SQUARE OF 12 and is by evolution, one of the most important square numbers. Here we can find CYCLE, PRICE AND TIME thanks to angles and grades, to show past and future support and resistance.
Buy and sell zones
Evgeniy Zhdan
5 (2)
평면 및 추세를 결정하기 위한 표시기. 가격이 2개의 히스토그램과 2개의 선(빨간색 및 파란색) 중 하나보다 낮으면 판매 영역입니다. 이 버전의 표시기를 구매할 때 하나의 실제 계정과 하나의 데모 계정에 대한 MT4 버전 - 선물로(수신하려면 개인 메시지를 작성하세요)! 가격이 2개의 히스토그램과 2개의 선(빨간색 및 파란색) 중 하나보다 높으면 구매 영역입니다. MT4 버전:   https://www.mql5.com/en/market/product/3793 가격이 두 라인 사이 또는 히스토그램 영역에 있으면 시장에 명확한 추세가 없습니다. 간단히 말해서 시장은 평평합니다. 표시기의 작업은 스크린샷에 더 명확하게 표시됩니다. 지표는 선행 데이터를 얻는 데 사용할 수 있습니다. 또는 현재 추세의 상태를 확인합니다.
Secret Liquidity Zones Indicator User Manual Introduction Unlock the power of hidden market opportunities with the Secret Liquidity Zones Indicator . This cutting‐edge tool is designed to reveal critical price levels where market momentum may shift. With its dynamic adaptability and sleek gold visuals, it offers clear and elegant insights into key trading opportunities—making it the perfect secret weapon for traders who demand precision and clarity. Key Features Dynamic Timeframe Adaptation: A
SMOOTH STRENGTH METER INDICATOR (SMOOTH LINE) it draws Currencies TREND Volatility Power / Strength lines : -       Detects the 2 highly TRENDED Volatile pairs  ( will be the Bold Lines ) - A very Helpful Indicator - It draws smooth lines for up to 20 currencies pairs representing Volatility  strength and power - First it indicates the most powerful trended direction pairs : Strongest / Weaker -       MAIN FUNCTION  :it gives indication of the       UP trend most Volatile Line  and the      DOWN
Infinity Trend Pro
Yaroslav Varankin
1 (1)
This is a trend indicator without redrawing Developed instead of the binary options strategy (by the color of the Martingale candlestick) Also works well in forex trading When to open trades (binary options) A signal will appear in the place with a candle signaling the current candle It is recommended to open a deal for one candle of the current timeframe M1 and M5 When a blue dot appears, open a deal up When a red dot appears, open a trade down. How to open trades on Forex. When a signal is rec
Point61 Indicator
Evgeniy Machok
5 (1)
The Point61 indicator is the result of many years of monitoring of price behavior of currency pairs and metals. It is not a secret, that in times of uncertainty, traders are looking for possible levels of support and resistance - the point, where price should stop its movement. There are 2 possible scenarios at these points: 1. Reverse (correction) to the opposite direction; 2. Breakthrough to continue movement. Very often these points are used to set stop orders - TakeProfit or StopLoss
RSI Speed mp
DMITRII GRIDASOV
MT4용 Crypto_Forex 지표 "RSI SPEED" - 훌륭한 예측 도구, 재도색 불필요 - 이 지표는 물리학 방정식을 기반으로 계산됩니다. RSI SPEED는 RSI 자체의 1차 미분값입니다. - RSI SPEED는 주요 추세 방향으로 스캘핑 진입에 유용합니다. - HTF MA(그림 참조)와 같은 적절한 추세 지표와 함께 사용하세요. - RSI SPEED 지표는 RSI 자체의 방향이 얼마나 빨리 변하는지를 보여주며, 매우 민감합니다. - 모멘텀 거래 전략에는 RSI SPEED 지표 사용을 권장합니다. RSI SPEED 지표 값이 0보다 작으면 가격 모멘텀이 하락하고, 0보다 크면 가격 모멘텀이 상승합니다. - 모바일 및 PC 알림 기능이 내장되어 있습니다. 여기를 클릭하여 고품질 트레이딩 로봇과 지표를 확인하세요! 본 제품은 MQL5 웹사이트에서만 제공되는 정품입니다.
Momentum MTF dashboard
Makarii Gubaydullin
선택한 심볼에 대한 다중 시간대 모멘텀 값: 현재 시장 추세 비교 이 지표는 선택한 모든 시간대 및 심볼의 모멘텀 지표 값을 하나의 표에 표시하여 현재 시장 가격 추세를 빠르게 분석할 수 있습니다. 나의   다기능 도구 : 66+ 기능  |   문의 사항  연락  |   MT5 버전 각 심볼 은 사용자 정의 가능합니다: 제거 / 교체. 최대 40개 심볼 추가 가능. 패널은 차트의 어느 곳으로나 이동 가능합니다 (드래그). 설정 에서 다음을 구성할 수 있습니다: 모멘텀 지표 설정: 기간, 적용 가격 유형 . 각 시간대  활성화 / 비활성화 가능 . 강조   옵션: 활성화 시 - 주요 수준이 사용자 정의 색상으로 강조 표시됩니다. 극값 (주요 수준) : 높은 값과 낮은 값; 알림 : 극값 수준에 대해 활성화 가능: 높은 모멘텀 / 낮은 모멘텀  / 둘 다. 시각적   스타일: 크기, 어두운 / 밝은 테마, 강조 색상. 모멘텀 지표 (Momentum) 는 특정 기간 동안 자산 가격의
MT4용 Crypto_Forex 지표 "FORCE 지수 및 2개 이동 평균". 리페인트 불필요. - 이 지표는 추세 방향의 모멘텀 트레이딩에 매우 유용합니다. - "FORCE 지수 및 2개 이동 평균" 지표를 사용하면 Force 지수의 빠르고 느린 이동 평균을 확인할 수 있습니다. - Force 지수는 가격과 거래량 데이터를 단일 값으로 결합하는 최고의 지표 중 하나입니다. - Force 지수 자체는 가격 변동에 사용된 파워의 양을 측정하는 강력한 오실레이터입니다. - 지표는 추세 변화를 매우 조기에 확인할 수 있는 기회를 제공합니다. - 이 지표는 매개변수를 통해 매우 쉽게 설정할 수 있으며, 모든 시간대에서 사용할 수 있습니다. - 그림에서 매수 및 매도 진입 조건을 확인할 수 있습니다. 여기를 클릭하여 고품질 트레이딩 로봇과 지표를 확인하세요! MQL5 웹사이트에서만 제공되는 오리지널 제품입니다.
PZ Trend Trading
PZ TRADING SLU
4.8 (5)
Capture every opportunity: your go-to indicator for profitable trend trading Trend Trading is an indicator designed to profit as much as possible from trends taking place in the market, by timing pullbacks and breakouts. It finds trading opportunities by analyzing what the price is doing during established trends. [ Installation Guide | Update Guide | Troubleshooting | FAQ | All Products ] Trade financial markets with confidence and efficiency Profit from established trends without getting whips
Gold Strength Index Pro
Pieter Gerhardus Van Zyl
Gold Strength Index Pro (GSI Pro)  is an indicator designed to analyze gold's strength across multiple currency pairs. It aggregates weighted price data from 7 XAU pairs (e.g., XAUUSD, XAUEUR) over a user-defined lookback period, calculating a composite strength value. Key features include: Color-Coded Histogram : Displays bullish (green) and bearish (red) - momentum based on a threshold zone (±0.2 default). Smoothed Lines : A gold-colored EMA (SmoothPeriod) reduces noise, while a DodgerBlue si
MajorAlert
Sergei Vassunov
MajorAlert - is a professional trading indicator for MetaTrader 4 that combines two distinct market analysis approaches into one powerful tool. By integrating a counter‑trend entry logic (upper block) with a trend‑following filter (lower block), the indicator generates high‑probability signals on the chart with clearly separated arrow colors. Key Features Fully self‑contained   – no external indicators required; all calculations are built‑in. Versatile inputs   – adjust all parameters to suit a
SystemBinaryM1
Andrey Spiridonov
SystemBinaryM1 - a professional indicator for trading short-term binary options, is a complete, self-contained author's strategy for working in the binary options market. The unique algorithm for analyzing the foreign exchange market is based on the calculation of reference points on three different time periods M15, M5. M1. Thus, the indicator simultaneously analyzes the long-term, medium-term and short-term price behavior before issuing a signal. The indicator is set in the usual way and work
이 제품의 구매자들이 또한 구매함
Gann Made Easy
Oleg Rodin
4.84 (171)
Gann Made Easy 는 mr.의 이론을 사용하여 최고의 거래 원칙을 기반으로 하는 전문적이고 사용하기 쉬운 Forex 거래 시스템입니다. W.D. 간. 이 표시기는 Stop Loss 및 Take Profit Levels를 포함하여 정확한 BUY 및 SELL 신호를 제공합니다. PUSH 알림을 사용하여 이동 중에도 거래할 수 있습니다. 구매 후 거래 방법 안내 및 유용한 추가 지표를 무료로 받으시려면 저에게 연락주세요! 아마도 Gann 거래 방법에 대해 이미 여러 번 들었을 것입니다. 일반적으로 Gann의 이론은 초보자 거래자뿐만 아니라 이미 거래 경험이 있는 사람들에게도 매우 복잡한 것입니다. Gann의 거래 방식은 이론적으로 적용하기 쉽지 않기 때문입니다. 나는 그 지식을 연마하고 Forex 지표에 최고의 원칙을 적용하기 위해 몇 년을 보냈습니다. 표시기는 적용하기가 매우 쉽습니다. 차트에 첨부하고 간단한 거래 권장 사항을 따르기만 하면 됩니다. 지표는 지속적으로 시장 분석
DayTrader PRO MT4
Davit Beridze
5 (1)
DayTrader PRO DayTrader PRO는 존 에러스(John Ehlers)의 Laguerre 필터와 강력한 자동 최적화 엔진을 결합한 고급 트레이딩 지표입니다. 고정된 파라미터를 사용하는 대신, 최근 시장 상황을 바탕으로 최적의 설정을 자동으로 검색하므로 지속적인 수동 조정 없이도 변화하는 시장 변동성에 대응할 수 있습니다. 이 지표는 명확한 매수(BUY) 및 매도(SELL) 신호를 생성하며, 현재 시장 변동성을 기준으로 계산된 적응형 손절매(Stop Loss) 및 익절(Take Profit) 레벨을 제공합니다. 내장된 추세, 효율성 지수(Efficiency Ratio), 변동성 및 캔들 필터 기능은 저품질의 진입 신호를 제거하여 신호의 정확도를 높여줍니다. 실시간 성능 대시보드에서는 현재 최적화된 설정값, 수익 요인(Profit Factor), 승률(Win Rate), 최대 낙폭(Drawdown) 및 기타 트레이딩 통계를 확인할 수 있습니다. 또한 DayTrader PR
SR Liquidity
Oleg Rodin
5 (1)
SR Liquidity 는 시장 유동성이 집중되고 가격이 가장 강력하게 반응하는 숨겨진 구간을 포착하도록 설계된 트레이딩 지표입니다. 이러한 특수 유동성 구간은 강력한 지지 및 저항선 역할을 하며, 시장 반전 가능성이 가장 높은 지점을 명확하게 보여주는 지도가 되어 줍니다. SR Liquidity는 일반적인 지지 및 저항선을 단순히 그리는 대신, 실제 가격 움직임을 분석하여 매수 및 매도 압력이 집중되는 구간을 포착합니다. 이러한 구간은 실질적인 시장의 흐름을 주도하는 유동성 풀(liquidity pools)에 해당합니다. 이 지표는 해당 구간을 차트에 직접 시각화하여, 가격 반응이 실제로 나타나기 전에 이를 미리 예측할 수 있도록 돕습니다. 즉, 가격 추세가 전환될 가능성을 사전에 파악하게 해주는 것입니다. 결과적으로 이 지표는 가공되지 않은 가격 움직임(price action)을 시장의 핵심 가격대, 다시 말해 추세 전환점이 될 수 있는 지점들을 보여주는 명확하고 실용적인 로드맵
Neuro Poseidon MT4
Daria Rezueva
4.8 (45)
Neuro Poseidon is a new indicator by Daria Rezueva. It combines precise trading signals with adaptive TP/SL levels - creating best possible trades as a result! Message me and get  Neuro Poseidon Assistant  as a gift to automize your trading process! What makes it stand out? 1. Proven profitability on all assets and timeframes 2. Only confirmed BUY and SELL signals present on the chart 3. Adaptive TP & SL levels generated by the software for each trade 4. Easy to understand - suitable for all
M1 Sniper
Oleg Rodin
5 (27)
M1 SNIPER 는 사용하기 쉬운 거래 지표 시스템입니다. M1 시간대에 맞춰 설계된 화살표 지표입니다. 이 지표는 M1 시간대 스캘핑을 위한 단독 시스템으로 사용할 수 있으며, 기존 거래 시스템의 일부로도 사용할 수 있습니다. 이 거래 시스템은 M1 시간대 거래용으로 특별히 설계되었지만, 다른 시간대에도 사용할 수 있습니다. 원래는 XAUUSD와 BTCUSD 거래를 위해 이 방법을 설계했지만, 다른 시장 거래에도 유용하다는 것을 알게 되었습니다. 이 지표의 신호는 추세 방향과 반대로 거래될 수 있습니다. 저는 지표의 신호를 활용하여 양방향으로 거래할 수 있도록 돕는 특별한 거래 기법을 알려드립니다. 이 방법은 특별한 동적 지지선과 저항선 가격 영역을 활용하는 것을 기반으로 합니다. 구매하시면 M1 SNIPER 화살표 지표를 바로 다운로드하실 수 있습니다. 또한, 아래 스크린샷에 표시된 Apollo Dynamic SR 지표는 M1 SNIPER 도구를 사용하는 모든 사용자에게 무료로
BTMM State Engine Pro MT4
Garry James Goodchild
BTMM State Engine Pro by G-Labs — Beat The Market Maker indicator for MetaTrader 4. Asian session range, London and New York kill zones, level progression (L1/L2/L3), peak formation detection (PFH/PFL), entry signals, and a multi-pair scanner from one chart. Stop scanning charts one pair at a time. The State Engine tracks the BTMM daily cycle automatically — Asian box, room boundaries, level blocks, peak formations, and filtered entries — while the scanner dashboard shows level, peak status,
Prop Firm Sniper
Mohamed Hassan
4.33 (6)
Prop Firm Sniper MT4  is a professional market structure indicator that automatically identifies high-probability BUY and SELL opportunities using BOS and CHoCH analysis. Recommended Timeframes: For backtesting, use the indicator on   M5 or M15   for Gold (XAUUSD), and   M15 or H1   for more volatile Forex pairs such as   GBPUSD, USDJPY, EURGBP , and similar markets. CONTACT ME AFTER PURCHASE TO CLAIM YOUR FREE BONUSES! Prop Firm Sniper  is a professional market structure indicator designed t
Dynamic Forex28 Navigator
Bernhard Schweigert
4.43 (7)
Dynamic Forex28 Navigator - 차세대 외환 거래 도구. 현재 49% 할인. Dynamic Forex28 Navigator는 오랫동안 인기 있는 지표의 진화형으로, 세 가지의 힘을 하나로 결합했습니다. 고급 통화 Strength28 지표(695개 리뷰) + 고급 통화 IMPULSE with ALERT(520개 리뷰) + CS28 콤보 신호(보너스). 지표에 대한 자세한 정보 https://www.mql5.com/en/blogs/post/758844 차세대 Strength 지표는 무엇을 제공합니까?  원래 지표에서 좋아했던 모든 것이 새로운 기능과 더 높은 정확도로 강화되었습니다. 주요 기능: 독점적인 통화 Strength 공식.  모든 시간대에 걸쳐 부드럽고 정확한 강도선. 추세와 정확한 진입을 식별하는 데 이상적입니다. 역동적인 시장 피보나치 수준(시장 피보나치).  이 지표에만 있는 고유한 기능. 가격 차트가 아닌 통화 강도에 피보나치가 적용됩니다.
Supply and Demand Dashboard PRO
Bernhard Schweigert
4.81 (21)
현재 30% 할인! 이 대시보드는 여러 기호와 최대 9개의 타임프레임에서 작동하는 매우 강력한 소프트웨어입니다. 주요 지표(최상의 리뷰: 고급 공급 수요)를 기반으로 합니다.   Advanced Supply Demand 대시보드는 훌륭한 개요를 제공합니다. 다음과 같이 표시됩니다.  영역 강도 등급을 포함하여 필터링된 공급 및 수요 값, 영역에 대한/및 영역 내 Pips 거리, 중첩된 영역을 강조 표시하고 모든 (9) 시간 프레임에서 선택한 기호에 대해 4가지 종류의 경고를 제공합니다. 그것은 당신의 개인적인 필요에 맞게 고도로 구성 가능합니다! 당신의 혜택! 모든 트레이더에게 가장 중요한 질문: 시장에 진입하기에 가장 좋은 수준은 무엇입니까? 최고의 성공 기회와 위험/보상을 얻으려면 강력한 공급/수요 영역 내 또는 그 근처에서 거래를 시작하십시오. 손절매를 위한 최적의 장소는 어디입니까? 가장 안전하려면 강력한 수요/공급 구역 아래/위에 정류장을 두십시오.
KURAMA GOLD SIGNAL PRO (MT4) — 7중 필터 · 자동 TP/SL · 품질 점수 · 시그널 기록 저장 | XAUUSD 완전 트레이딩 시스템 실시간 리페인트 없음. 시그널이 나타나는 순간 화살표, 진입, TP, SL이 그 자리에 고정되어 이후 절대 움직이지 않습니다. 여러분이 거래하는 것은 바로 이 실시간 시그널입니다. 그리고 v7.20에서는 실제로 발신된 모든 시그널이 자동 저장되어 재시작 후에도 정확히 복원됩니다. 구매자 전용 보너스 평생 라이선스를 구매하시면 AI Zone Radar($59 상당) + 완전 PDF 매뉴얼을 무료로 드립니다. 제품 가격에 더해 $59 상당의 보너스가 따라옵니다. 구매 후 MQL5로 메시지를 보내주세요. AI Zone Radar: https://www.mql5.com/en/market/product/175834 골드 트레이더 커뮤니티에서 실제로 사용되며 정확성과
IQ Gold Gann Levels
INTRAQUOTES
5 (4)
Presenting one-of-a-kind Gann Indicator for XAUUSD IQ Gold Gann Levels is a non-repainting, precision tool designed exclusively for XAUUSD intraday trading. It uses W.D. Gann’s square root method to plot real-time support and resistance levels, helping traders spot high-probability entries with confidence and clarity. William Delbert Gann (W.D. Gann) was an exceptional market analyst whose trading technique was based on a complex blend of mathematics, geometry, astrology, and ancient calculation
Super Signal – Skyblade Edition 전문가용 노리페인트 / 노래그 트렌드 신호 시스템, 뛰어난 승률 제공 | MT4 / MT5용 1분, 5분, 15분과 같은 낮은 타임프레임에서 가장 좋은 성능을 보입니다. 핵심 기능: Super Signal – Skyblade Edition은 추세 매매를 위해 설계된 스마트 신호 시스템입니다. 이 시스템은 다중 필터 로직을 활용하여, 명확한 방향성과 실질적인 모멘텀이 수반된 고품질 추세만을 감지합니다. 이 시스템은 고점 또는 저점을 예측하지 않으며 , 다음 세 가지 조건이 모두 충족될 때만 신호를 발생시킵니다: 명확한 추세 방향 강화되는 모멘텀 건전한 변동성 구조 또한, 시장 세션 기반의 유동성 분석을 통해 신호의 신뢰성과 타이밍을 더욱 향상시킵니다. 신호 특성: 모든 화살표 신호는 100% 리페인트 없음 / 지연 없음 신호가 한 번 발생하면 고정되며, 깜빡이거나 사라지지 않음 차트 상의 시각적 화살표, 정보 패널, 팝업 알
Atomic Analyst
Issam Kassas
5 (11)
이 제품은 2026년 시장에 맞게 업데이트되었으며 최신 MT5 빌드에 최적화되었습니다. 가격 업데이트 안내: Atomic Analyst는 현재 $99 에 제공됩니다. 다음 30회 구매 후 가격은 $199 로 인상됩니다. 특별 혜택: Atomic Analyst 구매 후 저에게 개인 메시지를 보내시면 Smart Universal EA를 무료 로 받을 수 있으며, Atomic Analyst 신호를 자동 거래로 전환할 수 있습니다. Atomic Analyst는 리페인트 없음, 재그리기 없음, 지연 없음의 Price Action 거래 인디케이터로, 수동 거래, 신호 명확성, EA 자동화를 위해 설계되었습니다. User manual: settings, inputs and strategy.     &   User Manual PDF . 가격 움직임, 강도, 모멘텀, 다중 시간대 방향 및 고급 필터를 분석하여 트레이더가 노이즈를 줄이고 약한 세팅을 피하며 더 체계적인 거래 결정을 내릴 수 있도
A. A2SR이란 무엇입니까 ?   * 선행 기술 지표입니다(재도장 없음, 지연 없음). -- 안내 : https://www.mql5.com/en/blogs/post/734748/page4#comment_16532516 -- 및 https://www.mql5.com/en/users/yohana/blog .. MT5 version:  https://www.mql5.com/en/market/product/140111 A2SR에는 지원(수요) 및 저항(공급) 수준을 결정하는 특별한 기술이 있습니다. 우리가 인터넷에서 본 일반적인 방식과 달리 A2SR은 실제 SR 수준을 결정하는 독창적인 개념을 가지고 있습니다. 원래 기술은 인터넷에서 가져온 것이 아니며 인터넷에 게시된 적도 없습니다. A2SR은 거래 스타일에 따라 SR 수준을 자동으로 선택합니다. 시간 프레임을 변경해도 SR 레벨은 그대로 유지됩니다. 사용하는 시간 프레임에서 실제 SR을 얻지 못하기 때문입니다. A2SR은 거래를
ORB Seeker
Marcela Goncalves De Oliveira
한정 특가! 단돈 99달러! 구매 후 저에게 연락 주시면 보너스 ORB Seeker EA와 개인 최적화 설정 파일을 보내드립니다. 깔끔한 세션 브레이크아웃을 자신감 있게 활용하세요! ORB Seeker는 정확성, 단순성, 유연성 및 명확한 차트 구조를 원하는 트레이더를 위해 개발된 전문적인 시가 범위 돌파(ORB) 지표입니다. 이 프로그램은 모든 금융 상품에 대해 장전 거래 또는 사용자 지정 세션 범위를 자동으로 표시하고, 진입, 손절매, 목표 수익 및 선택적으로 50% 부분 목표 수익 수준을 포함한 명확한 돌파 신호를 제공합니다. 모든 계산은 실시간으로 차트에 직접 표시됩니다. 런던 개장, 뉴욕 세션, 아시아 세션 또는 사용자 지정 시장 시간대를 선택하여 거래하세요. ORB Seeker는 사용자가 선택한 세션 시간에 맞춰 작동하므로 시장 범위, 돌파 수준 및 거래 레벨을 정확하게 확인할 수 있습니다. 모든 구매 시 ORB Seeker EA가 무료 보너스로 제공됩니다. 이 EA는
Advanced Supply Demand
Bernhard Schweigert
4.91 (302)
현재 30% 할인! 초보자나 전문 트레이더를 위한 최고의 솔루션! 이 보조지표는 우리가 다수의 독창적 기능과 새로운 공식을 통합한 독특하고 고품질이며 저렴한 거래 도구입니다. 이 업데이트를 통해 이중 시간대를 표시할 수 있습니다. 더 높은 TF를 표시할 수 있을 뿐만 아니라 차트 TF와 더 높은 TF 모두를 표시할 수 있습니다: 중첩 영역 표시. 모든 Supply Demand 트레이더들이 좋아할 것입니다. :) 중요한 정보 공개 Advanced Supply Demand의 잠재력을 극대화하려면 다음을 방문하십시오. https://www.mql5.com/ko/blogs/post/720245   진입 또는 목표의 명확한 트리거 포인트를 정확히 찾아냄으로 해서 거래가 어떻게 개선될지 상상해 보십시오. 새로운 알고리즘을 기반으로 매수자와 매도자 간의 잠재적인 불균형을 훨씬 더 쉽게 분간할 수 있습니다. 왜냐하면 가장 강한 공급영역과 가장 강한 수요 영역과 과거에 어떻게 진행 되었는지를(이전
Price Action Sniper
Elmira Memish
5 (3)
Price Action Sniper is designed to trade the Price Action on the desired chart time frame. - Trend Reversals. - Trend Continuation. - Brekaouts. - Good tool for Binary Options Price action forms the basis for all technical analysis of a currency pair, commodity or other asset chart. Many short-term traders rely exclusively on price action and the formations and trends extrapolated from it to make trading decisions. Technical analysis as a practice is a derivative of price action since it uses p
Built-in multi-symbol scanner — traffic-light grid for up to 30 pairs across four timeframes. No separate scanner file required. BUY, SELL, WAIT cells with confluence score and recent structure event. Full alignment with AI Trade Idea — current chart cell reads live engine data so scanner, dashboard, and AI panel always show the same verdict, score, and reason. Per-cell explain popup — four-section breakdown of what is happening, how the score was built, what to look for, and what to watch out
PRO Renko System
Oleg Rodin
5 (31)
PRO Renko System 은 RENKO 차트 거래를 위해 특별히 고안된 매우 정확한 거래 시스템입니다. 이것은 다양한 거래 상품에 적용될 수있는 보편적 인 시스템입니다. 체계는 효과적으로 당신에게 정확한 반전 신호에 접근을 주는 소위 시장 소음을 중화합니다. 이 표시기는 사용하기가 매우 쉽고 신호 생성을 담당하는 매개 변수가 하나만 있습니다. 당신은 쉽게 당신의 선택의 어떤 무역 계기에 공구를 적응시킬 수 있고 renko 막대기의 크기. 나는 항상 당신이 내 소프트웨어로 수익성있게 거래 할 수 있도록 추가 지원을 제공 할 준비가되어 있습니다! 나는 당신에게 행복하고 수익성있는 거래를 기원합니다! 구매 후 저에게 연락하십시오! 내 렌코 차트 생성기를 보내드립니다. 또한 내 개인 권장 사항 및 시스템의 다른 모듈을 무료로 공유 할 것입니다!
Currency Strength Exotics
Bernhard Schweigert
4.88 (33)
현재 20% 할인! 초보자 또는 전문가 트레이더를 위한 최고의 솔루션! 이 표시기는 Exotic Pairs Commodities, Indexes 또는 Futures와 같은 기호에 대한 통화 강도를 표시하는 데 특화되어 있습니다. 금, 은, 석유, DAX, US30, MXN, TRY, CNH 등의 진정한 통화 강도를 보여주기 위해 9번째 줄에 모든 기호를 추가할 수 있습니다. 이것은 독특하고 고품질이며 저렴한 거래 도구입니다. 우리는 많은 독점 기능과 새로운 공식을 통합했습니다. 새로운 추세 또는 스캘핑 기회의 정확한 트리거 포인트를 정확히 찾아낼 수 있기 때문에 거래가 어떻게 개선될지 상상해 보십시오. 사용 설명서: 여기를 클릭 https://www.mql5.com/en/blogs/post/708876 모든 시간대에 작동합니다. TREND를 빠르게 확인할 수 있습니다! 새로운 기본 알고리즘을 기반으로 설계되어 잠재적인 거래를 더욱 쉽게 식별하고 확인할 수 있습니다. 8개의
Scalper Inside PRO
Alexey Minkov
4.74 (68)
Scalper Inside PRO helps you read the intraday trend and plan a trade before you enter the market. It is built around three exclusive strategies for a sharper read of the market. The moment a signal appears, the indicator evaluates market direction and calculates the key levels, so you see the potential entry, the expected stop-loss and several profit-taking levels in advance. Detailed performance statistics show how different instruments and strategies performed in history and help you pick ass
PZ Turning Points MT4
PZ TRADING SLU
1 (1)
Identify key turning points with reliable fractal analysis This indicator examines the price structure of fractals of different periods to determine possible reversal points in the market, providing timing to positional traders that already have a fundamental or technical valuation model. Unlike its younger brother, Reversal Fractals , this indicator won't miss reversals because of the period selected, and will find reversal fractals on a zig-zag fashion, ignoring those reversals which do not
Level Breakout Indicator is a technical analysis product that works from upper and lower boundaries, which can determine the direction of the trend. Works on candle 0 without redrawing or delays. In its work, it uses a system of different indicators, the parameters of which have already been configured and combined into a single parameter - “ Scale ”, which performs gradation of periods. The indicator is easy to use, does not require any calculations, using a single parameter you need to select
현재 30% 할인 ! 초보자 또는 전문가 트레이더를 위한 최고의 솔루션! 이 대시보드 소프트웨어는 28개의 통화 쌍에서 작동합니다. 2가지 주요 지표(Advanced Currency Strength 28 및 Advanced Currency Impulse)를 기반으로 합니다. 전체 Forex 시장에 대한 훌륭한 개요를 제공합니다. 고급 통화 강도 값, 통화 이동 속도 및 모든(9) 시간대의 28 Forex 쌍에 대한 신호를 보여줍니다. 추세 및/또는 스캘핑 기회를 정확히 파악하기 위해 차트의 단일 지표를 사용하여 전체 시장을 볼 수 있을 때 거래가 어떻게 개선될지 상상해 보십시오! 잠재적인 거래를 식별하고 확인하면서 강력한 통화와 약한 통화를 더욱 쉽게 식별할 수 있도록 이 지표에 기능을 내장했습니다. 이 표시기는 통화의 강세 또는 약세가 증가 또는 감소하는지 여부와 모든 시간대에서 수행되는 방식을 그래픽으로 보여줍니다. 추가된 새로운 기능은 현재 시장 조건 변화에 적응하는
Noise filtering: the key to mastering trends This indicator tracks the market trend with an unmatched reliability, by ignoring sudden fluctuations and market noise. It has been designed to trend-trade intraday charts and small timeframes. Its winning ratio is around 85%. [ Installation Guide | Update Guide | Troubleshooting | FAQ | All Products ] Amazingly easy to trade Find oversold/overbought situations Enjoy noise-free trading at all times Avoid being whipsawed in intraday charts The indi
Scalper Vault
Oleg Rodin
5 (38)
Scalper Vault 는 성공적인 스캘핑에 필요한 모든 것을 제공하는 전문 스캘핑 시스템입니다. 이 표시기는 외환 및 바이너리 옵션 거래자가 사용할 수 있는 완전한 거래 시스템입니다. 권장 시간 프레임은 M5입니다. 시스템은 추세 방향으로 정확한 화살표 신호를 제공합니다. 또한 상단 및 하단 신호와 Gann 시장 수준을 제공합니다.  이 시스템은 사용하기가 매우 쉽습니다. 원하는 시장 지역의 화살표만 따라가면 됩니다. 엑시트는 가격이 적정 수준에 도달하거나 시장의 고점 또는 저점 신호가 나타날 때 수행됩니다.  표시기는 PUSH 알림을 포함한 모든 유형의 경고를 제공합니다. 인디케이터 구매 후 연락주세요. 내 개인 거래 권장 사항과 훌륭한 보너스 지표를 무료로 공유합니다! 나는 당신에게 행복하고 유익한 거래를 기원합니다!
Trend Catcher ind
Ramil Minniakhmetov
5 (11)
트렌드 캐처 인디케이터 트렌드 캐처 인디케이터는 개발자가 자체 개발한 맞춤형 적응형 트렌드 분석 지표들을 조합하여 시장 가격 움직임을 분석합니다. 단기적인 노이즈를 제거하고 근본적인 모멘텀 강도, 변동성 확대, 가격 구조 움직임에 집중하여 진정한 시장 방향을 파악합니다. 또한 이동 평균, RSI, 변동성 필터와 같은 맞춤형 지표들을 활용하여 가격을 평활화하고 트렌드를 필터링합니다. 실제 운영 모니터링 및 기타 제품은 다음 링크에서 확인하실 수 있습니다: https://www.mql5.com/en/users/mechanic/seller 텔레그램에서는 EA나 설정 파일을 판매하지 않습니다. 사기이니 주의하세요. 모든 설정 파일은 블로그에서 무료로 제공됩니다. 중요! 구매 후 즉시 연락 주시면 사용 방법 및 보너스를 드립니다!
GOLD Impulse with Alert
Bernhard Schweigert
4.67 (12)
이 지표는 Advanced Currency IMPULSE with ALERT  +   Currency Strength Exotics  의 2가지 제품의 슈퍼 조합입니다. 그것은 모든 시간 프레임에 대해 작동하며 8개의 주요 통화와 하나의 기호에 대한 강약의 충동을 그래픽으로 보여줍니다! 이 표시기는 금, 이국적인 쌍, 상품, 지수 또는 선물과 같은 기호에 대한 통화 강도 가속을 표시하는 데 특화되어 있습니다. 금, 은, 오일, DAX, US30, MXN, TRY, CNH 등의 진정한 통화 강도 가속(충동 또는 속도)을 표시하기 위해 9번째 줄에 모든 기호를 추가할 수 있습니다. 새로운 기본 알고리즘을 기반으로 구축되어 잠재적인 거래를 훨씬 더 쉽게 식별하고 확인할 수 있습니다. 이는 통화의 강세 또는 약세가 가속되는지 여부를 그래픽으로 표시하고 가속 속도를 측정하기 때문입니다. 자동차의 속도계처럼 생각하면 됩니다. 가속화할 때 Forex 시장에서 동일한 일이 분명히 더 빠르
Adopt market correlation and indicator resonance Here are some trading recommendations based on the current market conditions: (1) Note: It doesn't mean you have a perfect deal, but rather helps you avoid bad trades (2) Why traditional indicators are prone to distortion. For example, the 10-day moving average is calculated by calculating the average price of the top 10 candlesticks. Result: I prove I want to rise, and the signal is easily distorted. This indicator adopts a self-proof + corrob
Day Trader Master
Oleg Rodin
5 (15)
Day Trader Master 는 데이 트레이더를 위한 완벽한 거래 시스템입니다. 시스템은 두 개의 지표로 구성됩니다. 하나의 지표는 매수 및 매도를 위한 화살표 신호입니다. 얻을 수 있는 화살표 표시기입니다. 2차 지표를 무료로 드립니다. 두 번째 지표는 이러한 화살표와 함께 사용하도록 특별히 설계된 추세 지표입니다. 표시기는 반복하지 않고 늦지 않습니다! 이 시스템을 사용하는 것은 매우 간단합니다. 2색 선으로 표시되는 현재 추세 방향의 화살표 신호를 따라가기만 하면 됩니다. 파란색은 구매 추세입니다. 빨간색은 판매 추세입니다. 파란색 화살표는 매수 신호입니다. 빨간색 화살표는 매도 신호입니다. 추세선의 색상과 일치하려면 화살표의 색상과 신호의 방향이 필요합니다. 화살표 표시기는 주로 시간 간격 M5 및 M15에서 일중 거래를 위해 만들어졌습니다. 그러나 기술적으로 시스템은 다른 시간 간격으로 사용할 수 있습니다. 표시기에는 PUSH 메시지 기능이 있는 팝업 경고가 장착되어 있
제작자의 제품 더 보기
Prime Edge
Artem Koliada
기관 자금의 정확한 발자취를 추적하세요. Prime Edge는 아시아, 런던, 뉴욕 거래 세션 전반에 걸친 유동성 흐름을 해독하도록 설계된 전문적인 분석 매트릭스입니다. 후행성 가격 행동(Price Action) 거래를 중단하세요. 고급 마르코프 체인(Markov Chain) 확률 필터로 구동되는 이 대시보드는 스마트 머니가 한 대륙에서 다음 대륙으로 모멘텀을 전환하는 정확한 순간을 표시하여 확률이 높은 셋업을 자동으로 식별합니다. Prime Edge는 현재 가격 수준에만 집중하는 대신 시장 모멘텀의 방향성 움직임을 분석합니다. 세션 기반 통화 강도 분석과 수학적 확률을 결합함으로써 이 지표는 트레이더가 시장 모멘텀이 이동하거나 궤적을 유지하는 시기를 식별하는 데 도움을 줍니다. 작동 방식 알고리즘은 28개 교차 통화쌍을 스캔하여 8개 주요 통화(USD, EUR, GBP, JPY, CHF, CAD, AUD, NZD)의 상대적 강도를 계산합니다. 그런 다음 세션별로 통화 강도가 어떻게
Markov Prime은 고전적인 기술적 분석과 확률론(마르코프 연쇄) 및 프랙탈 기하학(시간 지수)을 결합한 차세대 전문 분석 지표입니다. "기억"을 가지고 있어 크게 지연되는 대부분의 표준 지표와 달리, Markov Prime은 시장을 다르게 분석합니다. 실시간으로 현재 시장 상태(추세 또는 횡보)가 지속될 확률을 계산합니다. 이 지표는 시장의 노이즈 발생 시 잘못된 진입 신호를 필터링하고 포지션을 열기 위한 가장 확률이 높은 지점을 찾도록 설계되었습니다. 지표는 리페인팅(Non-Repainting)되지 않으며, 마감된 캔들에서 지연이 없고, 차트 내에 편리한 정보 패널을 제공합니다. 핵심 기술: 마르코프 연쇄 필터: 최근 100개의 캔들을 분석하여 상태 전이 행렬을 구축합니다. 신호가 발생하더라도 마르코프에 의한 추세 지속 확률이 낮으면 신호가 차단됩니다. 시간 지수 (Time Exponent, TE): 가격 움직임의 "질"을 평가합니다. 혼란스러운(노이즈가 많은) 움직임을 필
FREE
StealthTrade Commander 는 수동 트레이더, 스캘퍼 및 프랍펌(Prop-Firm) 도전자를 위해 설계된 고급 시각적 거래 패널이자 위험 관리 유틸리티입니다. 이 도구는 차트에서 직접 시각적으로 거래를 실행하고, 브로커에게 손절매(SL) 및 이익 실현(TP) 수준을 숨기며, 일일 드로다운을 엄격하게 통제할 수 있도록 도와줍니다. 이는 프랍펌의 자금 지원 계좌 심사를 통과하고 유지하기 위한 핵심 기능입니다. 주요 기능: Risk Guardian (프랍펌 보호기) 일일 최대 손실 제한: 일일 드로다운이 지정된 한도에 도달하면 자동으로 모든 거래를 종료하고 패널을 잠급니다. 일일 목표 수익: 일일 목표에 도달하면 모든 포지션을 종료하여 수익을 확보합니다. 정밀한 랏(Lot) 계산: 시각적 손절매 선과 사전 정의된 리스크(%, $, 또는 계좌 에퀴티)를 기반으로 정확한 랏 크기를 계산합니다. Stealth & Tactical Engine (스텔스 및 전술 엔진) 스텔스 모드:
FREE
Trend Rapture
Artem Koliada
Trend Rapture는 적응형 변동성 분석을 기반으로 고확률 트렌드 진입 및 청산 지점을 식별하는 고급 알고리즘 지표입니다. 칼만 필터 노이즈 엔진을 사용하여 무작위 가격 변동에서 실제 시장 모멘텀을 분리합니다. 주요 기능 듀얼 전략 엔진: 풀백과 브레이크아웃 로직 간 즉시 전환. 적응형 변동성 채널: 동적 Z-Score를 통한 자동 시장 적응. 내장 트레이드 시뮬레이터: 차트에서 직접 진입·청산·손익 시각화. 완전 커스터마이징 가능한 UI: 설정 창 없이 실시간 전략 관리. 전문 알림: 팝업, 푸시 알림, 이메일 지원. 전략 모드 TACTICAL (풀백): 평균 회귀 트레이딩. 가격이 균형선으로 후퇴할 때 진입 신호. RAPID (브레이크아웃): 트렌드 추종 및 모멘텀 트레이딩. 가격이 변동성 밴드를 돌파할 때 신호. 청산 설정 (RAPID 모드) TREND RIDER: 트렌드 반전까지 포지션 유지. MOMENTUM FADE: 가격이 밴드 내로 복귀 즉시 청산. 호환 타임프레임
FREE
Markov Prime
Artem Koliada
Markov Prime은 고전적인 기술적 분석과 확률론(마르코프 연쇄) 및 프랙탈 기하학(시간 지수)을 결합한 차세대 전문 분석 지표입니다. "기억"을 가지고 있어 크게 지연되는 대부분의 표준 지표와 달리, Markov Prime은 시장을 다르게 분석합니다. 실시간으로 현재 시장 상태(추세 또는 횡보)가 지속될 확률을 계산합니다. 이 지표는 시장의 노이즈 발생 시 잘못된 진입 신호를 필터링하고 포지션을 열기 위한 가장 확률이 높은 지점을 찾도록 설계되었습니다. 지표는 리페인팅(Non-Repainting)되지 않으며, 마감된 캔들에서 지연이 없고, 차트 내에 편리한 정보 패널을 제공합니다. 핵심 기술: 마르코프 연쇄 필터: 최근 100개의 캔들을 분석하여 상태 전이 행렬을 구축합니다. 신호가 발생하더라도 마르코프에 의한 추세 지속 확률이 낮으면 신호가 차단됩니다. 시간 지수 (Time Exponent, TE): 가격 움직임의 "질"을 평가합니다. 혼란스러운(노이즈가 많은) 움직임을 필
FREE
Prime Confluence Engine(PCE)는 3계층 신호 필터링 아키텍처를 활용하는 전문가용 지표입니다. PCE는 단일 알고리즘에 의존하는 대신 시장 상태 감지(Renko), 동적 레벨(SuperTrend) 및 고급 수학적 분석(마르코프 연쇄 및 프랙탈 차원)을 결합하여 확률이 높은 진입점을 식별합니다. 거래 신호는 3개의 독립적인 계층이 모두 같은 방향으로 정렬될 때만 생성됩니다. 이 지표는 완성된 봉(Closed bars)에서만 엄격하게 작동하며 다시 그리지 않습니다(No Repaint). 3계층 아키텍처: 계층 1: 적응형 Renko (시장 상태) 표준 접근 방식과 달리 당사의 Renko 엔진은 지표 로직에 직접 내장되어 있어 오프라인 차트를 생성할 필요가 없습니다. 벽돌 크기는 ATR을 기반으로 동적으로 계산되므로 시스템이 현재 시장 변동성에 자동으로 적응할 수 있습니다. 이 계층은 시장 노이즈를 효과적으로 걸러내고 근본적인 추세를 드러냅니다. 계층 2: Prime
StealthTrade Commander 는 수동 트레이더, 스캘퍼 및 프랍펌(Prop-Firm) 도전자를 위해 설계된 고급 시각적 거래 패널이자 위험 관리 유틸리티입니다. 이 도구는 차트에서 직접 시각적으로 거래를 실행하고, 브로커에게 손절매(SL) 및 이익 실현(TP) 수준을 숨기며, 일일 드로다운을 엄격하게 통제할 수 있도록 도와줍니다. 이는 프랍펌의 자금 지원 계좌 심사를 통과하고 유지하기 위한 핵심 기능입니다. 주요 기능: Risk Guardian (프랍펌 보호기) 일일 최대 손실 제한: 일일 드로다운이 지정된 한도에 도달하면 자동으로 모든 거래를 종료하고 패널을 잠급니다. 일일 목표 수익: 일일 목표에 도달하면 모든 포지션을 종료하여 수익을 확보합니다. 정밀한 랏(Lot) 계산: 시각적 손절매 선과 사전 정의된 리스크(%, $, 또는 계좌 에퀴티)를 기반으로 정확한 랏 크기를 계산합니다. Stealth & Tactical Engine (스텔스 및 전술 엔진) 스텔스 모드:
FREE
Prime Power 는 8개 주요 통화의 실시간 강세와 약세를 식별하도록 설계된 MetaTrader 4용 전문 분석 도구입니다. 단일 통화 쌍만 분석하는 기존 지표와 달리, 이 시스템은 전체 외환 시장을 동시에 모니터링하여 상대적 자본 흐름의 수학적 비교를 통해 강력한 추세와 확률 높은 반전 지점을 보여줍니다. 핵심 기능 및 사용자 지침 1. 스마트 인터랙티브 대시보드 현재 모멘텀을 기준으로 통화를 자동으로 정렬하는 중앙 제어 허브입니다. 실시간 강세 순위: 목록은 동적이며, 가장 강한 통화는 상단에(양수 값), 가장 약한 통화는 하단에(음수 값) 위치합니다. 동적 라인 스위처: 패널에서 직접 통화 이름(예: EUR 또는 JPY)을 클릭하여 차트의 모든 통화 선을 즉시 켜거나 끌 수 있습니다. 드래그 앤 드롭 인터페이스: 상단 헤더를 드래그하여 메인 가격 창을 포함한 화면의 어느 곳으로든 대시보드를 자유롭게 이동할 수 있습니다. 2. 빠른 필터링 모드 [SHOW ALL] (모두 표
FREE
PA Hunter
Artem Koliada
PA Hunter — AI 신호 필터가 있는 프라이스 액션 지표 PA Hunter는 모든 심볼과 시간대에서 13가지 고전적인 Price Action 패턴을 감지하고, 내장된 컨텍스트 규칙과 실제 과거 신호로 훈련된 AI 모델로 필터링합니다. 작동 원리 지표는 다음 패턴을 스캔합니다: 반전 패턴: Pin Bar, Engulfing, Morning Star, Evening Star, Railway Tracks, Tweezer Tops/Bottoms, Piercing Line, Dark Cloud Cover, Three Soldiers, Three Crows 지속/중립: Inside Bar, Doji, Marubozu 감지된 각 신호는 차트에 표시되기 전에 다단계 필터링 시스템을 통과합니다. 신호 품질 점수 (0–7점) 각 신호는 7가지 기준에 따라 품질 점수를 받습니다: 지지/저항 구역에 대한 근접성 S/R 구역 합류 (스윙 + 거래량) EMA 추세 정렬 ATR 대비 캔들 크기 틱 거래
Prime Power
Artem Koliada
Prime Power 는 8개 주요 통화의 실시간 강세와 약세를 식별하도록 설계된 MetaTrader 4용 전문 분석 도구입니다. 단일 통화 쌍만 분석하는 기존 지표와 달리, 이 시스템은 전체 외환 시장을 동시에 모니터링하여 상대적 자본 흐름의 수학적 비교를 통해 강력한 추세와 확률 높은 반전 지점을 보여줍니다. 핵심 기능 및 사용자 지침 1. 스마트 인터랙티브 대시보드 현재 모멘텀을 기준으로 통화를 자동으로 정렬하는 중앙 제어 허브입니다. 실시간 강세 순위: 목록은 동적이며, 가장 강한 통화는 상단에(양수 값), 가장 약한 통화는 하단에(음수 값) 위치합니다. 동적 라인 스위처: 패널에서 직접 통화 이름(예: EUR 또는 JPY)을 클릭하여 차트의 모든 통화 선을 즉시 켜거나 끌 수 있습니다. 드래그 앤 드롭 인터페이스: 상단 헤더를 드래그하여 메인 가격 창을 포함한 화면의 어느 곳으로든 대시보드를 자유롭게 이동할 수 있습니다. 2. 빠른 필터링 모드 [SHOW ALL] (모두 표
FREE
VantageFX Matrix
Artem Koliada
5 (1)
Vantage FX Matrix Vantage FX Matrix is a dashboard indicator designed for monitoring multiple assets. It combines a correlation matrix for 8 major currencies with a custom watchlist for other symbols provided by your broker (e.g., crypto, metals, indices). Key Features: Logic and Calculation: The indicator calculates the relative strength of 8 currencies (USD, EUR, GBP, CHF, JPY, AUD, CAD, NZD) by analyzing 28 pairs across 5 timeframes (M5–D1). The algorithm does not repaint. Momentum Arrows: T
The ultimate market scanner. No Repaint. No Lag. Forex + Crypto Hybrid Mode. Most currency strength meters are ugly, freeze your terminal, and repaint their history.   Vantage FX Matrix   changes the game. It is a next-generation dashboard designed for professional traders who need clarity, speed, and accuracy. It combines a classic   Correlation Matrix   for 8 major currencies with a   Custom Watchlist   for assets like Bitcoin, Gold, or S&P500 — all in one sleek, "Pixel-Perfect" interface.
PrimeTrend Pro는 ATR 래칫(ratchet, 역진 방지 톱니바퀴) 엔진을 기반으로 한 추세 추종 지표입니다. 독립적인 신호 품질 게이트 세트와 다중 심볼·다중 시간대 대시보드를 갖추고 있습니다. 화면 하나에서 세 가지 질문에 답하도록 설계되었습니다: 현재 추세는 무엇인가, 해당 신호는 얼마나 신뢰할 수 있는가, 그리고 나머지 시장이 이에 동의하는가. PrimeTrend Pro는 지표 입니다. 주문을 열거나, 수정하거나, 청산하지 않습니다. 신호를 표시하고 분석 데이터를 제공할 뿐이며, 거래 결정은 항상 사용자 본인의 책임입니다. 엔진 핵심은 단방향 래칫이 적용된 ATR 채널입니다: 상승 추세에서는 지지선이 오직 상승만 가능하고, 하락 추세에서는 저항선이 오직 하락만 가능합니다. 기존 로직에 더해 버전 2.7은 다음을 추가합니다. 반전 히스테리시스(Flip Hysteresis). 추세 반전은 종가가 해당 수준을 ATR의 추가 비율(설정 가능)만큼 더 돌파해야 발생합니다.
StealthTrade Commander ST is a visual trading panel and risk management utility for MetaTrader 5. It is designed for manual traders, scalpers, and Prop-Firm challengers who want precise risk control, fast order execution, and advanced position management. The ST Edition (Strategy Tester Edition) works fully inside the MT5 Strategy Tester with Visual Mode, allowing traders to practice their complete workflow on historical data before applying it in live conditions. The panel handles all the mathe
Prime Confluence Engine(PCE)는 3계층 신호 필터링 아키텍처를 활용하는 전문가용 지표입니다. PCE는 단일 알고리즘에 의존하는 대신 시장 상태 감지(Renko), 동적 레벨(SuperTrend) 및 고급 수학적 분석(마르코프 연쇄 및 프랙탈 차원)을 결합하여 확률이 높은 진입점을 식별합니다. 거래 신호는 3개의 독립적인 계층이 모두 같은 방향으로 정렬될 때만 생성됩니다. 이 지표는 완성된 봉(Closed bars)에서만 엄격하게 작동하며 다시 그리지 않습니다(No Repaint). 3계층 아키텍처: 계층 1: 적응형 Renko (시장 상태) 표준 접근 방식과 달리 당사의 Renko 엔진은 지표 로직에 직접 내장되어 있어 오프라인 차트를 생성할 필요가 없습니다. 벽돌 크기는 ATR을 기반으로 동적으로 계산되므로 시스템이 현재 시장 변동성에 자동으로 적응할 수 있습니다. 이 계층은 시장 노이즈를 효과적으로 걸러내고 근본적인 추세를 드러냅니다. 계층 2: Prime
PCE Oscillator
Artem Koliada
Prime Confluence Engine — Oscillator는 MetaTrader 5용 별도 서브윈도우 지표로, 세 가지 독립적인 분석 레이어를 동시에 활용하여 복합 신호 품질 점수를 시각화합니다.   작동 원리   지표는 -100에서 +100 범위의 합류 점수(Confluence Score)를 계산하며, 세 개의 레이어로 구성됩니다.   레이어 1 — 렌코 필터: ATR 기반으로 자동 계산된 벽돌 크기를 가진 내부 렌코 엔진이 단기 시장 노이즈를 억제합니다. 동일 방향으로 최소 지정 수의 연속 벽돌이 쌓인 후에만 추세가 확인됩니다.   레이어 2 — Prime Trend(ATR SuperTrend): ATR 기반 SuperTrend 알고리즘을 사용하여 현재 추세 방향을 결정합니다. 점수에 방향 부호(+/-)를 제공합니다.   레이어 3 — 마르코프 필터 + 시간 지수: 마르코프 필터는 과거 가격 상태를 기반으로 추세 지속의 통계적 확률을 평가합니다. 시간 지수는 가격 움직임
Markov Prime Pro는 다중 심볼 스캐너를 사용하여 원시 신호를 신뢰도 점수가 매겨진 진입점으로 변환합니다. Markov Prime Pro는 단순히 화살표를 그리는 것 이상의 기능을 제공하는 MetaTrader 5용 분석 도구입니다. 모든 신호에 대해 대부분의 지표가 무시하는 질문에 답합니다. "지금 이 진입을 얼마나 신뢰할 수 있습니까?" 각 신호는 0에서 100 사이의 단일 신뢰도 점수(Confidence Score)로 평가되므로 한눈에 강력한 설정과 약한 설정을 구별할 수 있습니다. 이 도구는 6가지 신호 전략, 최근 가격 행동에서 학습하는 확률 모델, 시장 상태 필터 및 내장형 다중 심볼 스캐너를 깔끔하고 끌어서 이동할 수 있는 하나의 패널에 결합합니다. 주요 기능 신뢰도 점수 (0~100). 각 신호는 방향성 확률, 해당 확률의 과거 신뢰도, 시장 체제의 안정성 및 추세 품질을 혼합하여 평가됩니다. 하나의 숫자가 각 화살표 뒤에 숨겨진 무게감을 알려줍니다. 6가지
필터:
리뷰 없음
리뷰 답변