Conheça o Mercado MQL5 no YouTube, assista aos vídeos tutoriais
Como comprar um robô de negociação ou indicador?
Execute seu EA na
hospedagem virtual
hospedagem virtual
Teste indicadores/robôs de negociação antes de comprá-los
Quer ganhar dinheiro no Mercado?
Como apresentar um produto para o consumidor final?
Pagamento de Indicadores Técnicos para MetaTrader 4 - 6

- Real price is 90$ - 50% Discount ( It is 45$ now )
Contact me for instruction, any questions! Introduction V Bottoms and Tops are popular chart patterns among traders due to their potential for identifying trend reversals. These patterns are characterized by sharp and sudden price movements, creating a V-shaped or inverted V-shaped formation on the chart . By recognizing these patterns, traders can anticipate potential shifts in market direction and position themselves according

Quer tornar-se um comerciante forex de 5 estrelas constantemente lucrativo? 1. Leia a descrição básica do nosso sistema de negociação simples a sua principal actualização estratégica em 2020 2. Envie uma imagem da sua compra para obter o seu convite pessoal para o nosso chat comercial exclusivo
Lighthouse é um incrível indicador preciso e fiável de apoio e resistência.
Apresenta os níveis comerciais mais importantes e desenha-os de acordo com a sua relevância.
Se um nível for

We have combined all of our beloved indicators the likes of: Key level order block , Key level supply and demand , Key level liquidity grab and Key level wedge into one single indicator and dashboard.
Whats new Dashboard : There is an easy access dashboard for all your needs. Multi-timeframe button : There is now a multi-timeframe option for Order Blocks and Supply and demand zones, making it easy to see higher timeframe zones easily on the current timeframe by just clicking the desired timefr

Dark Support Resistance is an Indicator for intraday trading. This Indicator is programmed to identify Support and Resistance Lines , providing a high level of accuracy and reliability.
Key benefits
Easily visible lines Only the most important levels will be displayed Automated adjustment for each timeframe and instrument Easy to use even for beginners Never repaints, never backpaints, Not Lag 100% compatible with Expert Advisor development All types of alerts available: Pop-up, Email, Pus

Este é um indicador de pregões que pode exibir todos os níveis (Aberto-Alto-Baixo-Fechar) durante quatro sessões. O indicador também pode prever os níveis da sessão. As sessões podem ser desenhadas com linhas ou retângulos (vazios ou preenchidos), as linhas podem ser estendidas para a próxima sessão. Você pode facilmente ocultar/mostrar cada sessão pressionando teclas de atalho (por padrão '1', '2', '3', '4').
Você pode ver linhas ASR (intervalo médio de sessão) (tecla de atalho padrão 'A').

Este indicador analisa cada barra de pressão de compra ou venda e identifica 4 tipos de padrões de velas com o maior volume. Essas velas são filtradas usando vários filtros lineares para mostrar sinais de compra ou venda. Os sinais funcionam melhor, em conjunto com a direção do período de tempo mais alto e quando negociados durante as horas de alto volume. Todos os filtros são personalizáveis e funcionam de forma independente. Pode visualizar sinais de uma única direção com o clique de um bot
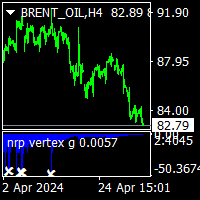
nrp vertex g indicator is no repaint vertex indicator. it works all time frame and all pairs. working princible is wery easy and can use beginners. when histogram up side and there is a white star on it that is buy signal.. and reverse signal sell comes when histogram below zero and white star on it.that is sell signal. indicator hold long time to signal.and it is not neccesary to stay on computer. minimum bar number is 500 bars on chart to work of it. and the cnt nr is minimum 500 can be. but p
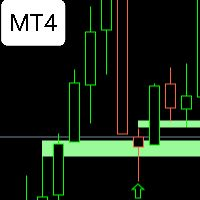
FVG WATCHER is an indicator that helps traders identify fair value gaps in the market. The indicator draws fair value gaps and alerts the user when the fair value gap has been swept. It allows users to specify how it should be swept, what time range to alert, and the size of the fair value gap to alert. It also allows the user to apply a moving average trend filter for better choice of alerts. The indicator also allows push mobile notifications. What makes FVG Watcher special is that it can be
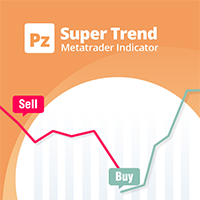
A top-quality implementation of the famous Super Trend indicator, which needs no introduction. It is completely loyal to the original algorithm, and implements many other useful features such as a multi-timeframe dashboard. [ Installation Guide | Update Guide | Troubleshooting | FAQ | All Products ] Easy to trade It implements alerts of all kinds It implements a multi-timeframe dashboard It is non-repainting and non-backpainting Input Parameters
ATR Period - This is the average true range peri

The ACB Trade Filter indicator provides a solution for filtering out the low probability trading setups in a trading strategy. The indicator uses a sophisticated filtration algorithm based on the market sentiment and trend.
Applications Works great with our indicator " ACB Breakout Arrows ". Filter out low probability signals from any indicator. Avoid overtrading and minimize the losses. Trade in the direction of market sentiment and trend. Avoid the choppiness in the market.
How to use Only
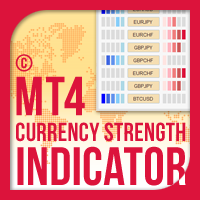
O Indicador de Força da Moeda para MT4 é uma solução inovadora para qualquer trader iniciante ou experiente! Leva o conceito de força da moeda a um nível totalmente novo, uma vez que o combina com a ação do preço e pode ser aplicado em qualquer símbolo / par, além das 28 combinações usuais das 8 moedas principais. Isso significa que você pode negociar a força ou a fraqueza de qualquer par, incluindo todas as moedas, principais, secundárias e exóticas, commodities e criptos (não índices). É um p

Determining the current trend is one of the most important tasks of a trader, regardless of the trading style. The Creative Trend indicator will help you do this with a fairly high probability. Creative Trend is a trend recognition indicator that uses the author's calculation algorithm. The indicator readings do not change under any conditions. The indicator is suitable for any currency pair, any timeframe, as long as there is enough historical data for calculations. Indicator Parameters
Main S

TMA Currency Meter is the ultimate currency meter. Based on the Triangular Moving Average of all available symbols, this indicator shows which currencies are strong, strengthening, weak or weakening. Experienced as well as novice traders will see the strong and weak currencies in the blink of an eye, and know which trade possibilities to explore further. TMA Currency Meter is a true Multi Timeframe indicator. It is easy to show the currency strengths for a higher timeframe than the chart timefra

Este indicador de multitemporal e símbolo múltiplo identifica formações superiores / inferiores duplas ou triplas ou um rompimento do decote seguinte (superior / inferior confirmado). Ele oferece RSI, barra de pinos, engolfante, pinça, filtros de estrelas da manhã / noite, bem como opções de filtro de divergência MACD, Awesome (AO) ou RSI, o que torna possível filtrar apenas as configurações mais fortes. O indicador também pode ser usado no modo de gráfico único. Por favor, leia mais sobre

Breakthrough Solution For Trend Trading And Filtering With All Important Features Built Inside One Tool! Trend PRO's smart algorithm detects the trend, filters out market noise and gives entry signals with exit levels. The new features with enhanced rules for statistical calculation improved the overall performance of this indicator.
Important Information Revealed Maximize the potential of Trend Pro, please visit www.mql5.com/en/blogs/post/713938
The Powerful Expert Advisor Version
Automa

Ou B ermaui A verage C onvergence D ivergence Cloud , que é um oscilador que mostra a direção da tendência e mede sua força em porcentagem. O cálculo da nuvem BACD é o seguinte: 1- Calcule duas médias móveis exponenciais. Um deles é mais rápido que o outro. Vou chamar o primeiro (rápido) e o segundo (lento)
2- Encontre o centro entre eles, onde: Centro MA = (Fast + Slow) / 2
3- Calcule a Linha BACD como segue: BACD = 100 * (Fast / Center MA)
4- Calcule a Linha de Sinal do BACD, que é um

THE ONLY CURRENCY STRENGTH INDICATOR THAT IS BASED ON PRICE ACTION. DESIGNED FOR TREND, MOMENTUM & REVERSAL TRADERS
This indicator reads price action to confirm trend and strength . Advanced multi-currency and multi-time frame indicator that shows you simply by looking at one chart, every currency pair that is trending and the strongest and weakest currencies driving those trends.
For full details on how to use this indicator, and also how to get a FREE chart tool, please see user manual HER

Extreme Value Sniper is a detrended price indicator Indicator finds the potential reversal levels by checking value ranges and price cycles. ***Indicator does NOT repaint so it provides accurate NO REPAINT REVERSAL SIGNALS***
MT5 Version of the product : https://www.mql5.com/en/market/product/114550
It shows the overbought and oversold levels using the average range. Overbought Levels are between 4 and 10 Oversold levels are bewtween -4 and -10
Those levels can be used as a reversal l

volatility level indicator is a volatility oscillator to see trend reversal points. price trends has reverese when volatility inreased . this indicator show trend reversal points volatility. mostly same level up and down volatility is reversal points. red colour shows up points of volatilty.and probably trend will down. blue colour oscillator shows deep point of price when increased volatiliyty. on pictures horizontal lines on oscillator has drawed by hand.to see the before level and compare now

Max Payne é um indicador de sinal de reversão/tendência que emite sinais em forma de seta, este indicador emite seu sinal no fechamento da mesma barra, este indicador pode cair várias vezes no gráfico com períodos diferentes para obter confirmação dupla/tripla dos sinais o indicador é altamente ajustável para se adequar a qualquer estilo de negociação, embora nunca seja repintado ou pintado de volta. Você obterá o sistema completo mostrado nas capturas de tela após a compra, juntamente com os m

CONGESTION BREAKOUT PRO
This indicator scans the breakout of congestion zones . This indicator unlike any other congestion indicator you will find in the market right now, it uses an advanced algorithm not peculiar to most traditional congestion indicators available today . The advanced algorithm used to define the congestions is greatly responsible for the high rate real congestion zones and low rate fake congestion zones spotted by this product.
UNDERSTANDING CONGESTION
Congestion are

There is No use in the Testing Demo. You will understand nothing from running flashing numbers. It is a Dashboard. Just try to understand idea, get it and I will help in everything further. Symbols must be separated by commas (,) and entered into the parameters exactly as displayed by your broker to ensure they are recognized in the dashboard. These symbols will be used for analysis by the indicator.
With one click open any pair any timeframe directly from dashboard The MA Speedometer Dashboar
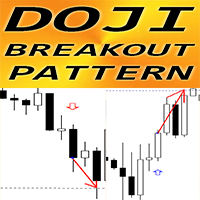
Indicador Forex "Doji Breakout Standard" para MT4
O indicador "Doji Breakout Standard" é pura negociação de Price Action: sem repintura, sem atrasos; O indicador deteta o rompimento do padrão Doji na direção da tendência, em que a vela Doji está no meio do padrão e a última vela é o rompimento: Padrão Doji Breakout de alta - sinal de seta azul no gráfico (ver fotos) Padrão de quebra Doji de baixa - sinal de seta vermelha no gráfico (ver fotos) Alertas de PC, telemóvel e e-mail estão incluídos

Did You Have A Profitable Trade But Suddenly Reversed? In a solid strategy, exiting a trade is equally important as entering.
Exit EDGE helps maximize your current trade profit and avoid turning winning trades to losers.
Never Miss An Exit Signal Again
Monitor all pairs and timeframes in just 1 chart www.mql5.com/en/blogs/post/726558
How To Trade You can close your open trades as soon as you receive a signal
Close your Buy orders if you receive an Exit Buy Signal. Close your Sell orde
Candlestick pattern system finds 40 candle formations. Features Has the feature to send the notification. It has candlestick patterns feature. Bullish patterns feature. Bearish patterns feature. Trend filter and reliability features.
Parameters Show alert - Send alert Send email - Send alerts to mail address. Look back - Retrospective calculation === PATTERN SETUP === Show bullish patterns - Open close feature Show bearish patterns - Open close feature Trend filter - Open close feature

Prevê o mais provável movimento de preços a curto prazo baseado em cálculos matemáticos avançados.
Características Estimativa imediata do movimento de preços; Cálculo da tendência real do mercado; Cálculo dos níveis de suporte e resistência mais importantes; Algoritmos otimizados para fazer cálculos matemáticos complexos com um dreno mínimo de recursos do sistema; Auto-ajustável para um melhor desempenho, por isso é capaz de funcionar corretamente em qualquer símbolo (não importa o quão exótic

Signal Bands is a sensitive and convenient indicator, which performs deep statistical processing of information. It allows to see on one chart (1) the price trend, (2) the clear price channel and (3) latent signs of trend change. The indicator can be used on charts of any periods, but it is especially useful for scalping due to its high sensitivity to the current market state.
The functions of the indicator : First, the Signal Bands indicator draws channels into which all price fluctuations ex
The indicator shows points for the continuation of the trend for currency pairs with the participation of the USD dollar with a probability of more than 80%. The algorithm is based on comparing the momentum of the current currency pair with the momentum of the DX dollar index at the current time. Using the dollar index allows us to evaluate not only the current pair, but the entire picture for all major currencies at once. This approach increases the reliability and reduces the number of false p

Próxima geração de zonas automatizadas de oferta e demanda. Algoritmo novo e inovador que funciona em qualquer gráfico. Todas as zonas estão sendo criadas dinamicamente de acordo com a ação do preço do mercado.
DOIS TIPOS DE ALERTAS --> 1) QUANDO O PREÇO ATINGE UMA ZONA 2) QUANDO UMA NOVA ZONA É FORMADA
Você não recebe mais um indicador inútil. Você obtém uma estratégia de negociação completa com resultados comprovados.
Novas características:
Alertas quando o preço ati

Renko, Heiken Ashi, Ticks Bar, Range Bar. Easy switching, easy setup, all in one window. Place the Custom Chart indicator and view Renko, Heiken Ashi, Tick bar, Range bar charts in real time at real chart. Position the offline chart window so that the indicator control panel is visible. Switch the chart mode by click of a button. Connect to the output chart any indicator, expert advisor without any restrictions. No, it doesn't work in the tester. Yes, you can use an

Indicador para negociação manual e análise técnica para Forex.
Consiste em um indicador de tendência com o nível de abertura do dia de negociação e um indicador de seta para determinar os pontos de entrada.
O indicador não muda de cor; funciona quando a vela fecha.
Contém vários tipos de alertas para setas de sinalização.
Pode ser configurado para funcionar em qualquer gráfico, instrumento de negociação ou período de tempo.
A estratégia de trabalho baseia-se na busca de movimentos de pr

The balance of supply and demand is a simple and effective market analysis method. The supply and demand diagram can show you in advance, even before the trend reversal, where the supply ends and the demand is already emerging, where the demand ends and the supply is emerging, while substantially increasing the probability of making a deal in the right direction and with a high profit factor.
Indicator Signals The indicator uses the price/volume values to generate signals: ED – excess demand.

Please send me Direct message on MQL5 CHAT after purchasing the Indicator for Training and Installation Support There are some additional files that is important to use with the Indicator . So be sure to contact me after purchasing the Indicator So that I can add you for training and support .
If you find any difficulty with installation then send me Direct message here So that I can connect with you via Anydesk or Teamview for the product installation. " Smart Order Block Indicator " to find
The Controversial 5-Step System That Professional Traders Use To Unlock Trading Success!
Reversal Pro effectively combines price action, ideal location and reliable statistics in one smart algorithm. Understanding the market in this unique perspective allows you to recognize reversals professionally.
Discover The Secret Of Professional Traders
Get instant access www.mql5.com/en/blogs/post/716077 Copy & Paste what professional traders are doing right now!
How To Trade Step 1: Trade Setu

Se você está procurando um indicador confiável para negociar o conceito ICT, a Estrutura de Mercado ICT fornece um manual do usuário para traders que usam estratégias mais avançadas. Este indicador tudo-em-um se concentra em Conceitos ICT (Conceitos de Dinheiro Inteligente). A Estrutura de Mercado ICT tenta entender como as instituições negociam, ajudando a prever seus movimentos. Ao entender e utilizar esta estratégia, os traders podem obter informações valiosas sobre os movimentos do mercado e

O indicador " Moving Average Crossover Dashboard " é uma ferramenta técnica que exibe os cruzamentos de 2 médias móveis selecionadas no gráfico de preços, indicando se é um cruzamento de alta ou de baixa. Além disso, como o próprio nome indica, mostra um painel de sinais que indica em qual mercado e período ocorre o cruzamento das duas médias móveis. Na janela de configuração o usuário pode selecionar os mercados e prazos que podem ser exibidos no painel. Você também tem a opção de ativar uma j

Definition : TPO is a Time Price Opportunity. Instead of using bars or candles with an Open, High, Low, and Close price, each "bar" in a Market Profile is represented by horizontal bars against the price It is called Market Profile terminology.
In other words time-price-opportunity (TPO) profiles are histograms of how much time was spent at each price within the span of the profile.
By using a TPO chart, you are able to analyze the amount of trading activity, based on time, for each price lev
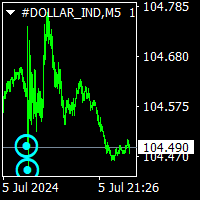
norepaint buy sell indicator is norepaint indicator.and works all pairs and all timeframes. Indicator hold too long way to signals. And show major and minor cycles.and gives signals Minor cycles are indicating with x signs. Major cycles are indicating big arrows. So 5m chart and 15m chart more suitable For major cycles, 1 h and 4h chart suitable for minor cycles. using is wery simple ,it puts arrow on price probably buy sell arrows. thise indicator is suitable for beginner and experienced trader
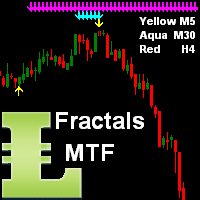
This indicator shows arrows as Support and Resistance from current time frame (Yellow arrows) and 2 higher TF by your choice (TF2 = Aqua arrows, TF3 = Magenta arrows and TF4 = Blue arrows). When all 3 color arrows are appearing in the same place then this is a good time to enter a new position.
Inputs NumOfBars - number of Bars where the indicator will show all arrows; DistanceArrow - you can increase the distance (vertically) between arrows especially on higher TF.
Wicks UpDown Target
Choppy movement up and down on the opening range every day. Trading breakouts on London session and New York session is recommended. Wicks UpDown Target is specialized in all forex pairs.
Guideline Entry Strategy Idea:
Step 1 - Breakout Forming (Warning! Trade on London Session and New York Session) Step 2 - Breakout Starting (Take Action on your trading plan) Step 3 - Partial Close your order & set breakeven (no-risk) Step 4 - Target complete Step 5 - Don't trade in

Bonosu Toon is Binary Indicator Highly Winrate No Repaint, No Delay from BONOSU SYSTEM Result look on https://t.me/BonosuProBinary Pair : All Forex Pairs Time Frame : M1 Expaired : 1-2 Minutes Trade Time Once Time a Day Backtester, Alert Avaliable Average Signals Generate 5 - 20 Signals All Pair A Day Broker Time Zone GMT+3 Default Setting [Example Broker GMT+3 : Alpari, ICMarkets] Support Broker : Deriv, IQOption, Alpari, Binomo Olymtrade, etc Support Auto Trading : MT2 Trading, Binary Bot, I
Super Cross Strong Signal is an indicator that generates trade arrows. It generates trade arrows with its own algorithm. These arrows give buying and selling signals. The indicator certainly does not repaint. Can be used in all pairs. Sends a signal to the user with the alert feature.
Trade rules Enter the signal when the buy signal arrives. In order to exit from the transaction, an opposite signal must be received. It is absolutely necessary to close the operation when an opposite signal is r

O indicador permite determinar instantaneamente a tendência atual por cor e níveis de Fibonacci. O painel HTF mostra a tendência atual de períodos mais altos, ajudando a determinar a força da tendência. Negocie na tendência ao mudar a cor das velas ou negocie contra a tendência quando o preço rompe os níveis extremos do indicador FIBO Trend PRO Benefícios do FIBO Trend PRO: O indicador nunca repinta ou altera seus valores Muito fácil de usar e intuitivo Aplicável a qualquer símbolo: FX-moedas, a
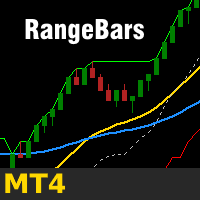
The robust charting solution enables creating custom live range bar charts on the MetaTrader 4 trading platform. You can apply all of the standard and custom indicators and technical studies directly to the range bar charts and you can run EAs directly on these charts as well* (for details see text below the input summary). To create a range bar chart you need to attach the Range Bar indicator to a standard time frame (1 minute is recommended) and use the indicator's settings to generate a live

Correct market entries and exits are essential for any Forex trader. MasterArrow indicator addresses this issue. It has no redundant elements and draws only buy/sell arrows. The up arrow is a BUY signal, while the down arrow is a SELL one. The indicator is simple to configure. Change the Strength parameter to configure the signals frequency. The product is based on standard indicators (MA, RSI, ATR, etc.). But it also features the custom algorithm allowing to combine them into a single tool and

You get Ea based on MRA Index for free as a Bonus in case of indicator purchase. For sc alping I optimize sets on period of l ast 12 months and use it next 1 month, this w ay it works very well ! Def ault settings are just for vizu alis ation, it c an not be profit able with it, recommendations about Correct optimization process I sh are with buyers. The "MRA Index" forex indicator is a versatile tool that combines various technical elements to provide traders with valuable insights into pot

The indicator shows the channel in which the price moves The algorithm for calculating the indicator is based on Fibonacci numbers, and also depends on the volatility of the instrument. Corrections and price reversals are most likely near the channel borders. Allows you to conduct trend and counter trend trade within the channel It works on all timeframes, on any currency pairs, metals and cryptocurrency Can be used when working with binary options
Distinctive features Shows clear boundaries o

Quarterly Cycles
Quarterly Cycles is based on the Quarterly Theory developed by Daye ( traderdaye on X ) T his is an aid to the user to find Cycles and it is NOT automatic detected, user can select AMDX or XAMD in each Cycle and it will be visually draw on the chart. Quarterly Cycles: Yearly, Monthly, Weekly, Daily, 6 Hour (90 minutes)
Yearly Cycle: The year is divided in four sections of three months each Q1 - January, February, March Q2 - April, May, June Q3 - July, August, September Q4

View the institutional support and resistance on every time frame with alerts on and off buttons for each timeframe for instant chart decluttering. Monthly, Weekly, Daily, 4hour, 1hr, 30 min, 15min,5min etc. Ability to change colors each timeframe Solid or Outline Use bottom or top of Order Blocks as stop loss = defined risk
My Trading Story Began in 2013 in the wild west of the crypto market, I’ve spent over $10,000 on trading courses and what I've learned from this experience is that man

MCDX Pro is based on Buyer and Seller Volume analysis . Buyer also known as Banker is represented by GREEN BAR Seller also known as Retailer is represented by RED BAR The indicator is showing STACKED BAT representing BANKER (Green) and RETAILER (Red) activities Height of GREEN bar > 50% means Bull is in control while RED bar > 50% means Bear is in control. DARKER GREEN COLOR - STRONG BANKER - Active Buying Activity LIGHTER GREEN COLOR - STRONG Down - Weak Buying (Pullbac
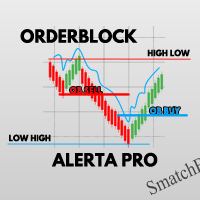
OrderBlock ALERTA PRO O OrderBlock ALERTA PRO é a ferramenta definitiva para identificar os melhores pontos de entrada no mercado financeiro. Com ele, você encontrará os pontos de equilíbrio ideais para ordens, detectando quando a liquidez começará a aumentar ao quebrar a estrutura de alta ou baixa. Receba notificações PUSH diretamente no seu Meta Trader, mantendo você sempre informado. Além disso, o OrderBlock ALERTA PRO identifica as zonas HIGH LOW (HL) e LOW HIGH (LH), fornecendo a você o pr

The indicator is designed to work on any trading platform. The program is based on proprietary algorithms and W.D.Ganna's mathematics, allowing you to calculate target levels of price movement based on three points with the highest degree of certainty. It is a great tool for stock trading. The indicator has three buttons: NEW - call up a triangle for calculation. DEL - delete the selected triangle. DELS - completely remove all constructions. The probability of achieving the goals is more than 80

O Oscilador de Índice de Precisão (Pi-Osc) de Roger Medcalf da Precision Trading Systems
A Versão 2 foi cuidadosamente reconfigurada para carregar rapidamente em seu gráfico, e algumas outras melhorias técnicas foram incorporadas para aprimorar a experiência.
O Pi-Osc foi criado para fornecer sinais precisos de temporização de negociações projetados para encontrar pontos de exaustão extremos, os pontos para os quais os mercados são forçados a ir apenas para tirar as ordens de todos.
Este

up down stars indicator is no repaint indicator. it hold long way to signals. suitable all pairs and all timeframes. it needs at least 1000 bars on charts. 1 is critical level for signals. if red line reach 1 it gives red star to sell.. if blue line reach 1 it gives blue star to buy.. signals comes mostly exact time. sometimes lower timeframes it makes consecutive signals.
Um indicador de seta sem repintura para ajudar nas entradas Melhores sinais são dados em mercados em tendência Aguarde a barra atual fechar para travar a seta no lugar Basta carregar no gráfico sem configurações para confundir A cor e o tamanho da seta podem ser ajustados O indicador pode ser usado com qualquer par ou período de tempo - Forex, criptografia ..... Melhor negociar com a tendência de prazo maior -------------------------------------------------- ----------------------
Use the indicator only in retest zones The newly formed zone should be used for scalping only New zones are repainted or recalculated When supports and resistances are violated, they are deleted as they no longer function. Recommended on M30 and higher timeframes You will see the trading zones and identify the most profitable points to open positions. The indicator marks the supply and demand zones. With this show you will now make profitable trades that will set the trends. Shows all support a
Day Trader Edge is a Range Breakout Correlation With Multi Symbol Lookup (NON-REPAINT Enhance your trading strategy with our cutting-edge Indicator! This versatile tool is designed to provide precise breakout signals and comprehensive analysis to help you make informed trading decisions. Discover the features that make our indicator a must-have for any forex trader: -INDEPENDENT COMPLETE DAY TRADING SYSTEM- Key Features: Range Breakout Time-Based Analysis: Accurately identifies breakout level
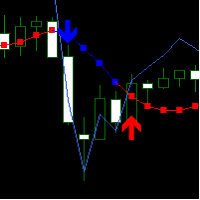
O indicador desenvolvido para a negociação utiliza a volatilidade do mercado, permitindo prever os movimentos dos preços logo no início.
Ao ler a volatilidade e a dinâmica dos preços, constrói duas linhas, rápida e suave. Quando a linha rápida cruza a linha suave, o movimento da tendência altera-se.
Os sinais não aparecem no momento em que as linhas se cruzam, mas sim com um indicador adicional gerado por um gerador de sinais baseado no movimento da linha rápida.
Se a linha rápida estiver aci

Volume Delta is a very powerful indicator that reads the supply on the Market. It calculates the Delta from movement of the price and the difference of BUY and SELL Tick volumes. Its special structure allows you to get all timeframe values available on the MT4 platform. A good observation of this instrument can suggest great entry points and possible reversal. We are confident that this tool will help you to improve your trading timing. See also for MT5: https://www.mql5.com/en/market/product/5

Extract Candle Power é um indicador extrator de volume em tempo real que fornece informações valiosas sobre o comportamento de vendedores e compradores durante cada vela. Ao analisar os dados de volume, os traders podem tomar decisões mais informadas sobre as tendências do mercado e possíveis reversões, superando as capacidades dos indicadores tradicionais de média móvel. Esta poderosa ferramenta permite extrair e analisar o volume dos vendedores e compradores da vela atual, bem como compará-l

This scanner is monitoring the entire market for trade opportunities for all symbols and for all time frames. This scanner will alert you on your computer, or on your mobile, when a trade opportunity has been found. Three moving average strategy
The three moving average strategy is a very popular and proven strategy. The slowest moving average is used to determine the direction of the trend. If the price is above the slowest moving average, we are in a Bullish market and if the price is belo

O indicador Overlay do gráfico exibe a ação do preço de vários instrumentos no mesmo gráfico, permitindo avaliar como os pares de moedas diferem entre si. [ Guia de instalação | Guia de atualização | Solução de problemas | FAQ | Todos os produtos ]
Encontre pares de moedas sobrecomprados ou sobrevendidos facilmente Plote até seis pares de moedas sobrepostos no mesmo gráfico Exibir símbolos invertidos, se necessário Adapte-se ao tamanho, zoom e prazo do gráfico Cálculo automático do nível de

Ultimate Double Top Scanner (Multi Pair And Multi Time Frame) : ---LIMITED TIME OFFER: NEXT 25 CLIENTS ONLY ---46% OFF REGULAR PRICE AND 2 FREE BONUSES ---SEE BELOW FOR FULL DETAILS Any major price level that holds multiple times, is obviously a level that is being defended by
the large institutions. And a strong double top pattern is a clear indication of institutional interest.
Double top patterns are widely used by institutional traders around the world. As they allow you to manage

Modificação multimoeda e multitimeframe do indicador Moving Average (MA). No painel você pode ver o estado atual do indicador - rompimentos e toques (por preço) do MA Rápido e MA Lento, bem como a intersecção das linhas MA entre si (cruzamento da média móvel). Nos parâmetros você pode especificar quaisquer moedas e prazos desejados. Além disso, o indicador pode enviar notificações sobre o preço tocando as linhas e sobre o seu cruzamento. Ao clicar em uma célula com ponto final, este símbolo e p

Apresentando o indicador técnico Fibo Channels Ultimate , uma ferramenta poderosa projetada para revolucionar sua estratégia de negociação Fibonacci. Com sua funcionalidade avançada, este indicador desenha automaticamente todos os canais anteriores de Fibonacci em seu gráfico, economizando tempo e esforço. O que diferencia o Fibo Channels Ultimate são seus recursos excepcionais de personalização, permitindo que os traders profissionais desenhem qualquer nível de Fibonacci que desejarem. Esse

** All Symbols x All Timeframes scan just by pressing scanner button ** *** Contact me to send you instruction and add you in "All Divergences scanner group" for sharing or seeing experiences with other users. Introduction Divergence is a main technique used to determine trend reversing when it’s time to sell or buy because prices are likely to drop or pick in the charts. All Divergence indicator can help you locate the top and bottom of the market. This indicator finds Regular divergences for

This indicator is SO SIMPLE… when the green Rise Coming arrow appears, a price drop may be on the way! Plain and easy profits! As you receive more than one 'Rise Coming' text signal in a downtrend, it means momentum is building larger for a bull run. HOW TO USE 1. When the green "Rise Coming" text appears, a price jump may be on the way! This indicator Never Repaints! To get the best setting it's a matter of tweaking the indicator until it gives you the best results. Our recommendation, and what

RSI Divergence Full +10 other divergence indicators
Contact me after payment to send you the User-Manual PDF File. Download the MT5 version here. Also you can download the >>> Hybrid Trading EA <<< that is designed and implemented based on RSI Divergence Indicator. RSI is a pretty useful indicator in itself but it's even more effective when you trade divergence patterns with that. Because the divergence signal of the RSI indicator is one of the most powerful signals among the indicators. D
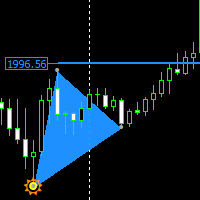
Non-repaint price action pattern based indicator works on all timeframe the indicator is based on a 123 Triangle pattern that happens everyday on the market the indicator will point out the pattern for you and you can turn on Fib level to see your take profit. Blue triangle is a buy signal Red triangle is a sell signal horizonal blue and red lines is an indication to place your trail stop loss one price has reached that area only entry when the triangle has fully formed

Este indicador de vários períodos e vários símbolos envia um alerta quando um ou mais padrões de velas de reversão de tendência foram identificados em vários períodos de tempo. Ele pode ser usado com todos os intervalos de tempo de M5 a MN. É possível habilitar a média móvel ou o filtro de tendência RSI para filtrar apenas as configurações mais fortes. Combinado com suas próprias regras e técnicas, este indicador permitirá que você crie (ou aprimore) seu próprio sistema poderoso. Recursos
Pode
O Mercado MetaTrader oferece um local conveniente e seguro para comprar aplicativos para a plataforma MetaTrader. Faça download de versões de demonstração gratuitas de Expert Advisors e indicadores a partir do seu terminal para testes no Testador de Estratégia.
Teste os aplicativos em diferentes modos para monitoramento do desempenho e assim fazer um pagamento para o produto que você deseja, usando o sistema de pagamento MQL5.community.
Você está perdendo oportunidades de negociação:
- Aplicativos de negociação gratuitos
- 8 000+ sinais para cópia
- Notícias econômicas para análise dos mercados financeiros
Registro
Login
Se você não tem uma conta, por favor registre-se
Para login e uso do site MQL5.com, você deve ativar o uso de cookies.
Ative esta opção no seu navegador, caso contrário você não poderá fazer login.