당사 팬 페이지에 가입하십시오
- 조회수:
- 4634
- 평가:
- 게시됨:
-
이 코드를 기반으로 한 로봇이나 지표가 필요하신가요? 프리랜스로 주문하세요 프리랜스로 이동
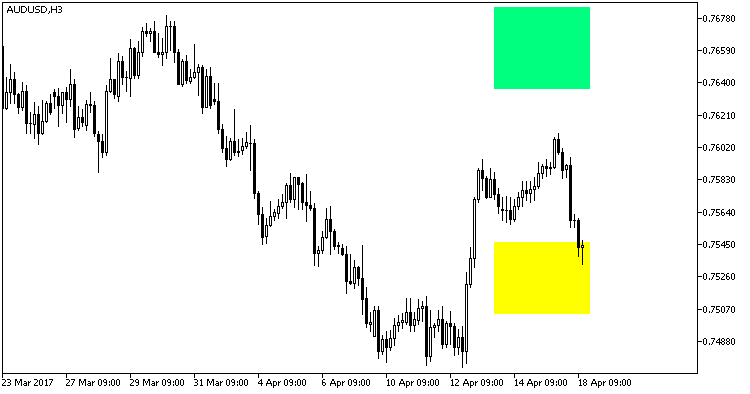
Two colored filled rectangles drawn between the values of two GRFLeadingEdger indicator channels on one bar.
Indicator input parameters:
//+------------------------------------------------+
//|  Indicator input parameters                    |
//+------------------------------------------------+
input string Symbols_Sirname="GRFLeadingEdger_Pivot_";  // Name for the indicator labels
input uint Samples=60;
input int  LookAhead=0;
input double StdLevel1=2.0;
input double  StdLevel2=4.0;
input color Up_Color=clrSpringGreen;                    // The color of the upper band of the indicator
input color Dn_Color=clrYellow;                         // The color of the lower band of the indicator
input uint SignalBar=0;                                 // Bar index to get the indicator values
input uint SignalLen=40;                                // The length of the indicator bands
The indicator uses SmoothAlgorithms.mqh library classes (copy it to <terminal_data_folder>\MQL5\Include). The use of the classes was thoroughly described in the article Averaging Price Series for Intermediate Calculations Without Using Additional Buffers.

Fig1. Indicator GRFLeadingEdger_Pivot
MetaQuotes Ltd에서 러시아어로 번역함.
원본 코드: https://www.mql5.com/ru/code/18145
 XMA_Keltner_Pivot
Two colored filled rectangles drawn between the values of two Keltner channels on one bar.
 XMA_BB_Pivot
Two colored filled rectangles drawn between the values of two Bollinger channels on one bar.
 WmiVol_HTF
The WmiVol indicator with the timeframe selection option available in input parameters.
 Sets Chart Scale
The indicator sets the "Fixed scale" property to a chart window and holds the first bar in the middle of the window.