거래 로봇을 무료로 다운로드 하는 법을 시청해보세요
당사를 Telegram에서 찾아주십시오!
당사 팬 페이지에 가입하십시오
당사 팬 페이지에 가입하십시오
스크립트가 마음에 드시나요? MetaTrader 5 터미널에서 시도해보십시오
- 조회수:
- 6975
- 평가:
- 게시됨:
- 업데이트됨:
-
이 코드를 기반으로 한 로봇이나 지표가 필요하신가요? 프리랜스로 주문하세요 프리랜스로 이동
Real author:
FX5
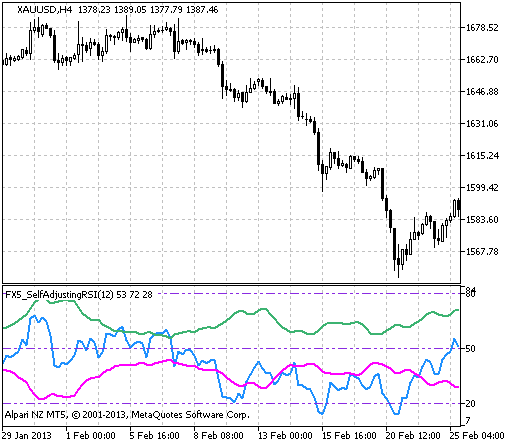
The RSI oscillator with the boundaries of the overbought/oversold areas expressed by Bollinger Bands.
Indicator input parameters:
//+-----------------------------------+
//|  INDICATOR INPUT PARAMETERS       |
//+-----------------------------------+
input uint Length=12; // RSI period
input ENUM_APPLIED_PRICE   RSIPrice=PRICE_CLOSE; // RSI timeseries price
input double BandsDeviation=2.0; // deviation
input bool MA_Method=true; // used smoothing for Bollinger Bands
input int Shift=0; // Horizontal shift of the indicator in bars
This indicator was first implemented in MQL4 and published in Code Base at mql4.com on 29.04.2008.

Figure 1. The FX5_SelfAdjustingRSI indicator
MetaQuotes Ltd에서 러시아어로 번역함.
원본 코드: https://www.mql5.com/ru/code/1731
 RSICandle
The RSI indicator implemented as a sequence of candlesticks
 BBflat_sw
A simple interpretation of the Bollinger Bands indicator in a separate window.
 OnChart_Stochastic
A stochastic oscillator located directly on the chart
 OnChart_RSI
The RSI oscillator located directly on the chart