당사 팬 페이지에 가입하십시오
- 조회수:
- 9933
- 평가:
- 게시됨:
- 업데이트됨:
-
이 코드를 기반으로 한 로봇이나 지표가 필요하신가요? 프리랜스로 주문하세요 프리랜스로 이동
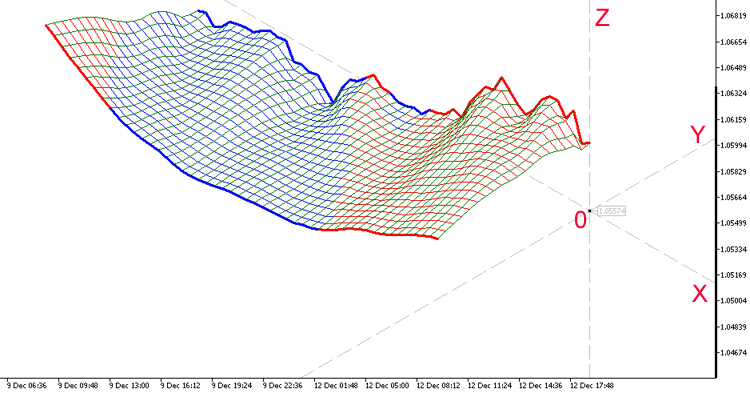
Demonstration of three-dimensional visualization possibilities in MetaTrader 5.
A surface is generated using a series of iMA indicators. The surface is displayed in a three-dimensional coordinate system.
The coordinate system can be rotated about the vertical Z axis by changing the slope of the X or Y axes. Moving the center of coordinates along the Z axis will change the coloring of the grid lines: red color — nodes are above the XY plane, blue means they are below the plane.

Fig. 1. Demonstration of the 3D Moving Average
Note:- Formation of a 3D surface requires some time.
- Select the minimum chart scale.
MetaQuotes Ltd에서 러시아어로 번역함.
원본 코드: https://www.mql5.com/ru/code/17183
 Fractal_WeightOscillator_HTF
The Fractal_WeightOscillator indicator with the timeframe selection option available in input parameters.
 Aroon oscillator 2
Aroon oscillator, next version.
 JK BullP AutoTrader
The Expert Advisor uses the iBullsPower (Bulls Power) indicator.
 Gandalf_PRO
The creation of the Expert Advisor stems from the topic "Neural networks - where to start studying them".