Volatility Limit Trend

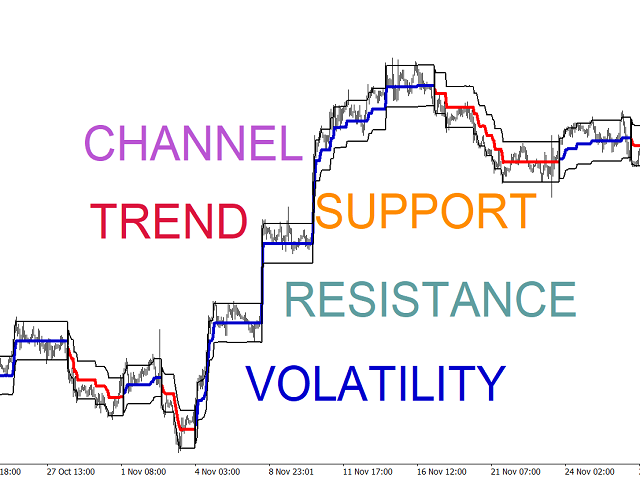
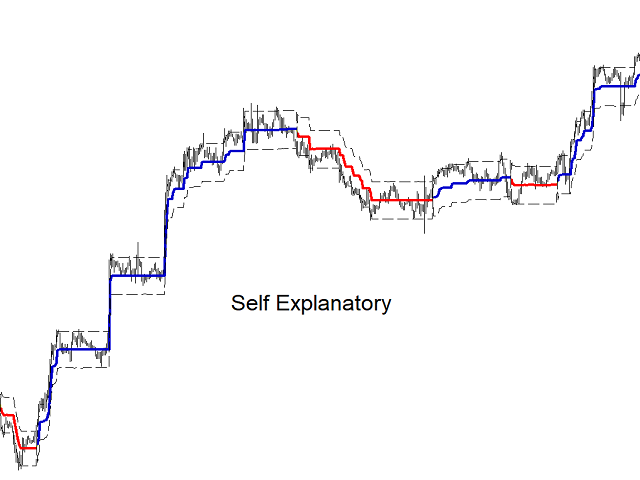
Volatility Limit Trend Indicator (VLT), an original indicator by this developer,  is a trend indicator based on setting a fixed volatility limit as a percentage of price. Volatile price is allowed to wander between two channel lines defining the fixed volatility about a central line. The price crossing one of the channel lines defines an exceeding of the allowed volatility, and ushering in one of two situation : either a continuation or a reversal of trend.

The first buffer of the indicator (not plotted) is a trading signal. +10 for going long, and -10 for going short. This signal is accessed by using the iCustom function call.


おすすめのプロダクト
Add indicator "Symbol Name Drawer " on chart. Indicator creates text object with name of current symbol. You can change symbols on chart and indicator automatically changes text. Free to use. Simple tool. If you have any suggestion you can write me about it in comments. I try to improve this tool in future versions. Thanks for using my indicator. If you want to order something special in mql4 or mql5 message.
FREE
Discover the power of precision and efficiency in your trading with the " Super Auto Fibonacci " MT4 indicator. This cutting-edge tool is meticulously designed to enhance your technical analysis, providing you with invaluable insights to make informed trading decisions. Key Features: Automated Fibonacci Analysis: Say goodbye to the hassle of manual Fibonacci retracement and extension drawing. "Super Auto Fibonacci" instantly identifies and plots Fibonacci levels on your MT4 chart, saving you tim
FREE
Master the Forex Market with Powerful Currency Analysis! LIVE MONITORING OF SIGNAL USING CCY POWER Take your forex trading to the next level with a comprehensive and fully customizable tool designed to analyze currency trends, identify strong and weak currencies , and enhance your decision-making process. Key Features: Multi-Timeframe Analysis Analyze currency strength from short-term (1-minute) scalping to long-term (1-month) trends—adaptable to any trading style. Customizable Ca
FREE
Fisher Yur4ik Indicator is a momentum indicator originated by Yuri Prokiev (Russian). I combined the Fisher Test indicator with other indicators to sieve/filter signals. It is not used as a standalone indicator but in combination to filter out Price Action signals.  I have uploaded this indicator (Fisher test) for download alongside the 3Bar_Play signal indicator for signals to appear. It is free.
FREE
This indicator is a useful tool for visualising cyclic components in price. It calculates the Discrete Fourier Transform (DFT) of a price chart data segment selected by the user. It displays the cycles, the spectrum and the synthesised signal in a separate window.  The indicator is intended as a learning tool only, being unsuitable for providing actual trade signals. Download the file -  it is a free toy. Play with it to understand how signals can be transformed by controlling their cyclic comp
FREE
QualifiedEngulfing - は ProEngulfing インジケーターの無料版です。 ProEngulfing - は Advance Engulf インジケーターの有料版で、 こちらからダウンロードできます。 ProEngulfing の無料版と有料版の違いは何ですか?無料版は1日に1つのシグナルの制限があります。 QualifiedEngulfingをご紹介します - あなたのMT4用のプロフェッショナルエンゴルフパターンインジケーター Precisionの力を解放して、QualifiedEngulfingを使用して外国為替市場での資格のあるエンゴルフパターンを特定および強調する先進的なインジケーターです。MetaTrader 4用に開発されたQualifiedEngulfingは、外国為替市場のエンゴルフパターンを確認およびハイライトするために設計された切り立ったアプローチを提供し、取引の決定に対して最も信頼性の高いシグナルのみを受け取ることを確認します。 QualifiedEngulfingの動作方法: QualifiedEngulfingは、エンゴルフパター
FREE
Ppr PA
Yury Emeliyanov
4.5 (2)
"Ppr PA" is a unique technical indicator created to identify "PPR" patterns on the currency charts of the MT4 trading platform. These patterns can indicate possible reversals or continuation of the trend, providing traders with valuable signals to enter the market. Features: Automatic PPR Detection:   The indicator automatically identifies and marks PPR patterns with arrows on the chart. Visual Signals:   Green and red arrows indicate the optimal points for buying and selling, respectively. Ar
FREE
FFx Force Index
Eric Venturi-Bloxs
5 (1)
The purpose of this new version of the MT4 standard indicator provided in your platform is to display in a sub-window multiple timeframes of the same indicator. See the example shown in the picture below. But the display isn’t like a simple MTF indicator. This is the real display of the indicator on its timeframe. Here's the options available in the FFx indicator: Select the timeframes to be displayed (M1 to Monthly) Define the width (number of bars) for each timeframe box Alert pop up/sound/ema
FREE
Rainbow MT4 is a technical indicator based on Moving average with period 34 and very easy to use. When price crosses above MA and MA changes color to green, it’s a signal to buy. When price crosses below MA and MA changes color to red, it’s a signal to sell. The Expert advisor ( Rainbow EA MT4) based on Rainbow MT4 indicator, as you can see in the short video below is now available here .
FREE
MACD is well known indicator that still can be use for prediction where price will go next few minutes, hours or even weekly  With colored bar of Macd, your eyes can easily catch when color is changed based what market price movement to find any early trend on market. here is the parameter of the indicator: TF_MACD , default is 1 Hour , this mean you can see clearly MACD of 1 Hour TimeFrame on Lower TimeFrame. InpPrice , default is Price Close , this is original MACD parameter from Metaquotes st
FREE
The tool that will help you calculate the lot accurately for the risk you need, if you want to risk 1% of your account, just enter the entry, target and stop values ​​ and you will have the lot size to use and only lose the chosen percentage. You can also choose a fixed value. This tool will help you with consistency, because you can only be consistent if you operate consistently and enter with fixed loss values, it is an INFALLIBLE way to be consistent!!!!
FREE
Smart FVG インジケーター MT4 – MetaTrader 4 向け高度なフェアバリューギャップ検出 Smart FVG インジケーター MT4 は、MetaTrader 4 上で Fair Value Gap(FVG)をプロフェッショナルレベルで検出・監視し、アラートまで行うツールです。ATR ベースのフィルタリングと相場構造を考慮したロジックを組み合わせることで、ノイズを取り除き、流動性に応じて適応し、本当に重要な不均衡だけを残して精度の高い判断をサポートします。 主な特長 正確な FVG 検出:単なるローソク足のギャップではなく、市場の本質的な非効率を捉えます。 ATR ベースの精度:市場や時間軸が変わっても、低品質なシグナルを自動的にフィルタリング。 有効性のリアルタイム追跡:価格がゾーンを埋める/ブレイクすると、ゾーンが自動で延長・調整・削除されます。 カスタマイズ可能な表示:色・ラインスタイル・塗りつぶしを自由に設定し、どんなテンプレートにも合わせられます。 実用的なアラート:新規 FVG や、埋められた/無効化されたゾーンをリアルタイム通知。 パフォーマンス
FREE
MT4 の R 2EMA Color インジケーターは、2 つの EMA のクロスオーバーに基づく堅実な取引シグナルを提供します。 キーポイント 価格が 2 つの緑色の EMA を超えて閉じると、買いトレード シグナルが作成されます。 価格が 2 つの赤い EMA を超えて閉じると、売りトレード シグナルが作成されます。 R 2EMA Color Forex インジケーターにより、売買のタイミングをより簡単に判断できます 2 つの EMA ラインが緑色に変わると、買いシグナルが発生します。 2 つの EMA ラインが赤くなると、売りシグナルが発生します。 それと取引する方法は? 2 つの EMA シグナル ラインが赤色から緑色に変わるとすぐに買い取引を開始します。トレンドは現在ポジティブです。 2 つの EMA シグナル ラインが緑色から赤色に変わるとすぐに売りトレードを開始します。トレンドは現在ネガティブです。 チャート上で反対の取引シグナルが発生したら、取引を終了します。 R 2EMA Color インジケーターで取引を開始および終了するために、お好みの取引方法を自由に使用
FREE
Key Price Levels
Wafa Mohammed Omar Abou Alwafa
Key Price Levels Indicator Indicator that shows the highs and lows for the significant price levels for past periods that could be potentially considered as reaction levels. The indicator displays the following price levels: Yesterday high and low The day before yesterday high and low Two days back high and low Last week high and low Last month high and low Last three month high and low (Quarter) Last year high and low
FREE
MA Reminder Overview MA Reminder is a versatile moving average indicator that provides visual cues and background coloring to help traders identify trend direction and potential trading opportunities based on MA crossovers. Key Features Multiple Moving Averages : Displays up to 4 configurable moving averages on the chart Background Coloring : Highlights chart background based on MA1 and MA2 crossovers Timeframe Flexibility : Choose between dynamic (follows chart timeframe) or fixed timeframe mod
FREE
Check out other great products from  https://www.mql5.com/en/users/augustinekamatu/seller   This indicator is the best so far at determining the currency strength of each pair. It provides stable values and is highly adaptive to market changes. It is a great tool to add to your arsenal to make sure you are on the right side of the trend at all times. No inputs required, it is simple plug and play. A Winning Trading Strategy This article describes the components and logic needed to develop a tra
FREE
DF Fib Trader Pro DF Fib Trader Proは、MetaTrader 4向けに設計された自動取引システムです。 フィボナッチベースの価格水準とトレンドおよびストラクチャー分析を組み合わせ、エントリーポイントとエグジットポイントを決定します。このEAはロングポジションとショートポジションの両方をサポートし、リスク管理パラメータも組み込まれています。 主な機能: • フィボナッチ・リトレースメントとエクステンション・ロジックを用いて、エントリーポイント、SLポイント、TPポイントをプロットします。 • ロットサイズと損切り/利益確定レベルを設定可能 • エントリーポイントは1つまたは2つから選択可能 • 市場状況に応じて、固定または動的な損切り/利益確定をサポート • 複数の時間枠と通貨ペアに対応 • 最大スプレッド、スリッページ、取引頻度の制御オプションを搭載 • 自動取引管理:損益分岐点、トレーリングストップ、部分決済オプション • 希望に応じて成行注文もサポート入力項目の概要: • リスク管理:ロットサイズ、取引ごとのリスク、最大取引回数 • エントリー
FREE
This indicator alerts you when/before new 1 or 5 minute bar candle formed. In other words,this indicator alerts you every 1/5 minutes. This indicator is especially useful for traders who trade when new bars formed. *This indicator don't work propery in strategy tester.Use this in live trading to check functionality. There is more powerful Pro version .In Pro version,you can choose more timeframe and so on. Input Parameters Alert_Or_Sound =Sound ----- Choose alert or sound or both to notify y
FREE
YOU CAN NOW DOWNLOAD FREE VERSIONS OF OUR PAID INDICATORS . IT'S OUR WAY OF GIVING BACK TO THE COMMUNITY ! >>>    GO HERE TO DOWNLOAD   The system is a free open source pine script originally published on TradingView by everget   . It was converted to Mt4 by Forex Robot Makers. This system is a  popular trend indicator based on ATR ( Average True Range ) , Moving Averages and the Donchian channel . System BackGround ATR The average true range is an indicator of the price volatility of an asse
FREE
EMA Spectrum - Multi-Timeframe EMA Indicator Display multiple EMAs from different timeframes on a single chart. Perfect for traders who use multi-timeframe analysis. FEATURES • 5 Customizable EMA Periods (default: 5, 10, 20, 60, 120) • 4 Timeframes: M5 / M15 / M30 / H1 • Individual transparency control for each timeframe • Different line styles (Solid / Dash / Dot) to distinguish timeframes • Interactive collapsible panel •
Trend Reversal pro is a histogram type indicator that give long and short signals, the indicator can be traded on its own with following entry rules . Buy Rule, histogram gives green bar. Sell Rule, histogram gives red bar. This indicator doesn't repaint or back paint, this indicator signals are not delayed. -------------------------------------------------------
FREE
FFx ParabolicSAR
Eric Venturi-Bloxs
4.67 (3)
The purpose of this new version of the MT4 standard indicator provided in your platform is to display in a sub-window multiple timeframes of the same indicator. See the example shown in the picture below. But the display isn’t like a simple MTF indicator. This is the real display of the indicator on its timeframe. Here's the options available in the FFx indicator: Select the timeframes to be displayed (M1 to Monthly) Define the width (number of bars) for each timeframe box Alert pop up/sound/ema
FREE
Tipu Heikin-Ashi Panel is the modified version of the original Heiken Ashi indicator published by MetaQuotes here . A professional version of this indicator is available here . Features An easy to use Panel that shows the Heiken Ashi trend of selected timeframe. Customizable Buy/Sell alerts, push alerts, email alerts, or visual on-screen alerts. Customizable Panel. The panel can be moved to any place on the chart or minimized to allow more space. Heikin means "the average", and Ashi means "foot
FREE
Have you ever wondered which currency is the strongest at any particular time? Or which currency pair is trending the most. Well, the currency strength meter helps with just that.  It compares  USD ,  EUR ,  AUD ,  CHF ,  GBP ,  CAD  and  NZD  depending on the timeline you have chosen in settings, and ranks them on the number of pips each has moved compared to the rest. N/B:   All currency charts of the above pairs must have loaded. You can do this by highlighting all major and minor currencies
FREE
Are you tired of drawing trendlines every time you're analyzing charts? Or perhaps you would like more consistency in your technical analysis. Then this is for you. This indicator will draw trend lines automatically when dropped on a chart. How it works Works similar to standard deviation channel found on mt4 and mt5. It has 2 parameters: 1. Starting Bar 2. Number of bars for calculation The   starting bar   is the bar which drawing of the trend lines will begin, while the   number of bars for c
FREE
*This is tradingview indicator converted to mql5* The Trend Magic Indicator is a popular technical analysis tool used to identify the direction of a market trend and potential trend reversals. It is a versatile indicator that can be applied to various financial instruments and timeframes. The Trend Magic Indicator consists of a combination of moving averages and a volatility-based filter. It aims to smooth out price fluctuations and provide a clearer visualization of the underlying trend. Here
Multi Divergence Indicator for MT4 - User Guide Introduction Overview of the Multi Divergence Indicator and its capabilities in identifying divergences across multiple indicators. Importance of divergence detection in enhancing trading strategies and decision-making. List of Indicators RSI CCI MACD STOCHASTIC AWSOME MFI ACCELERATOR OSMA MOMENTUM WPR( Williams %R) RVI Indicator Features Indicator Selection:  How to enable/disable specific indicators (RSI, CCI, MACD, etc.) for divergence detectio
FREE
Accuracy Meter
Ashkan Hazegh Nikrou
5 (2)
精度メーターの紹介: 精度メーターは、戦略の勝率を決定する強力なツールであり、メタトレーダー戦略テスターのようなすべてのトレードのエントリーポイントとエグジットポイントを示します。チャート上のインジケーターとしてシンプルなストラテジーテスターを使用し、さまざまなペアとタイムフレームにアタッチして調べることができます。戦略の正確さのパーセンテージ、ストップロスとリスクを報酬要素に変更し、それがトレーディングのアイデアにどのように影響するかを確認します。 Accuracy Meterはシンプルな戦略テスターです。この製品は、戦略テスターと同じチャート上の戦略の入口と出口にアクセスするのに役立ちます。この製品を使用すると、コストを節約し、不利益なEAを構築するためにお金を無駄にすることがありません。 よくある質問 : どのように私はこの指標に私の戦略を定義できますか? 精度メーターには、カスタムインジケーターのパスと名前を調整できる入力設定があり、買いバッファーと売りバッファーの番号も定義できます。 以下の設定を使用できます。     カスタム指標名     バッファ番号を購入
FREE
Vanexio
Sayan Vandenhout
VANEXIO USES THE TREND WAVE INDICATOR AND IT CAN IDENTIFY THE BEGINNING AND THE END OF A NEW WAVE TREND MOVEMENT. AS AN OSCILLATOR, THE INDICATOR IDENTIFIES THE OVERBOUGHT AND OVERSOLD ZONES. IT WORKS GREAT TO CATCH THE SHORT TERM PRICE REVERSALS AND USES A MARTINGALE STRATEGY TO CLOSE ALL TRADES IN PROFIT. USE DEFAULT SETTINGS ON H1 OR HIGHER TIME FRAME ON ANY PAIR FOR MORE ACCURATE TRADES WHY THIS EA : Smart entries calculated by 5 great strategies The EA can be run on even a $20000 acco
FREE
The Starting Points indicator for MetaTrader 4 is a technical analysis tool that shows the monthly, weekly, and daily starting points, as well as the 1000-point and 500-point levels, in the forex market. The indicator is displayed as a series of horizontal lines that represent the starting points and levels. Benefits of Using the Starting Points Indicator Identify potential trend changes:   The Starting Points indicator can help traders identify potential trend changes by highlighting areas wher
FREE
このプロダクトを購入した人は以下も購入しています
Precautions for subscribing to indicator This indicator only supports the computer version of MT4 Does not support MT5, mobile phones, tablets The indicator only shows the day's entry arrow The previous history arrow will not be displayed (Live broadcast is for demonstration) The indicator is a trading aid Is not a EA automatic trading No copy trading function The indicator only indicates the entry position No exit (target profit)  The entry stop loss point is set at 30-50 PIPS Or the front hi
Gann Made Easy は、ミスター・ギャンの理論を使用した取引の最良の原則に基づいた、プロフェッショナルで使いやすい外国為替取引システムです。 W・D・ガン。このインジケーターは、ストップロスとテイクプロフィットレベルを含む正確な買いと売りのシグナルを提供します。 PUSH通知を利用して外出先でも取引可能です。 購入後に私に連絡して、取引のヒント、ボーナス、および「GANN MADE EASY」EA アシスタントを無料で入手してください。 おそらく、ギャンの取引手法についてはすでに何度も聞いたことがあるでしょう。通常、ギャンの理論は初心者のトレーダーだけでなく、すでにある程度の取引経験がある人にとっても非常に複雑なものです。なぜなら、ギャンの取引手法は理論的にはそれほど簡単に適用できるものではないからです。私はその知識を磨き、最良の原則を私の外国為替インジケーターに組み込むために数年を費やしました。 このインジケーターは非常に簡単に適用できます。必要なのは、それをチャートに添付し、簡単な取引推奨事項に従うだけです。このインジケーターは常に市場分析の仕事を行い、取引の機会を探しま
Meravith
Ivan Stefanov
5 (2)
マーケットメーカーのためのツール。 Meravith は次の機能を提供します: すべての時間足を分析し、現在有効なトレンドを表示します。 強気と弱気の出来高が等しくなる流動性ゾーン(出来高均衡)を強調表示します。 異なる時間足のすべての流動性レベルをチャート上に直接表示します。 テキスト形式の市場分析を生成し、参考情報として表示します。 現在のトレンドに基づいて目標値、サポートレベル、ストップロスを計算します。 取引のリスクリワード比を算出します。 口座残高に基づいてポジションサイズを計算し、潜在的な利益を推定します。 また、市場に大きな変化があった場合には警告を表示します。 インジケーターの主要ライン: 強気/弱気の出来高エグゾーストライン ― 目標値として機能します。 市場のトレンドを示すライン。市場が強気か弱気かによって色が変わり、トレンドのサポートとして機能します。主にその色が市場センチメントを示します。 出来高均衡ライン(Eq)。Eq(Volume Equilibrium)ラインはシステムの中核です。これは買い手と売り手の出来高のバランスポイントを表します。市場の流動性を示し
M1 SNIPER は使いやすいトレーディングインジケーターシステムです。M1時間足向けに設計された矢印インジケーターです。M1時間足でのスキャルピングのためのスタンドアロンシステムとして、また既存のトレーディングシステムの一部としても使用できます。このトレーディングシステムはM1時間足での取引に特化して設計されていますが、他の時間足でも使用できます。元々、この手法はXAUUSDとBTCUSDの取引用に設計しましたが、他の市場においても役立つと考えています。 インジケーターのシグナルは、トレンドの方向と逆方向に取引できます。インジケーターのシグナルを利用して両方向に取引するのに役立つ特別な取引テクニックをご紹介します。この手法は、特別な動的なサポートとレジスタンスの価格帯を利用することに基づいています。 ご購入後、M1 SNIPER矢印インジケーターをすぐにダウンロードできます。さらに、M1 SNIPERツールのすべてのユーザーに、以下のスクリーンショットに表示されているApollo Dynamic SRインジケーターを無料で提供しています。この2つのインジケーターを組み合わせることで
Game Changerは、あらゆる金融商品で使用できる革新的なトレンドインジケーターです。MetaTraderを強力なトレンドアナライザーへと変貌させます。あらゆる時間枠で動作し、トレンドの特定、反転の可能性のシグナル、トレーリングストップ機能、そして迅速な市場反応のためのリアルタイムアラートを提供します。経験豊富なプロでも、優位性を求める初心者でも、このツールは自信と規律、そして根本的なトレンドダイナミクスを明確に理解した上で取引を行うための力となります。このインジケーターはリドロー機能も備えています。 購入後すぐにご連絡いただければ、個人ボーナスを進呈いたします。Strong SupportとTrend Scannerインジケーターの無料コピーを入手できます。[email protected]までプライベートメッセージを送ってください。 私のEAや特別なセットはTelegramでは販売しておりません。MQL5でのみ販売しており、セットファイルは私のブログでのみ公開しています。詐欺師にはご注意ください。他の方からセットを購入しないでください。 設定 トレンド変化時のアラート
Miraculous Indicator – ガン・スクエア・オブ・ナインに基づく100%非リペイントのFXおよびバイナリーツール この動画では、FXおよびバイナリーオプションのトレーダー向けに特別に開発された、非常に正確で強力な取引ツールである Miraculous Indicator を紹介しています。このインジケーターがユニークなのは、伝説的な ガン・スクエア・オブ・ナイン と ガンの振動の法則 に基づいている点で、現代の取引で利用できる最も正確な予測ツールの一つとなっています。 Miraculous Indicatorは 完全に非リペイント であり、ローソク足が確定した後にシグナルが変化したり消えたりすることはありません。つまり、見たものがそのまま利用できます。これにより、トレーダーは自信を持ってエントリーおよびエグジットを行うための信頼性と一貫性のある根拠を得ることができます。 主な特徴: ガン・スクエア・オブ・ナインとガン理論に基づいて構築 100%非リペイントのシグナルシステム すべての時間枠(M1、M5、H1、H4、日足、週足)で機能 FXおよびバイナリーオプション取引
Looking for a powerful yet lightweight swing detector that accurately identifies market structure turning points? Want clear, reliable buy and sell signals that work across any timeframe and any instrument? Buy Sell Arrow MT Swing is built exactly for that — precision swing detection made simple and effective. This indicator identifies Higher Highs (HH) , Higher Lows (HL) , Lower Highs (LH) , and Lower Lows (LL) with remarkable clarity. It is designed to help traders easily visualize market str
ゴールドラッシュ・トレンド・アロー・シグナル ゴールドラッシュ・トレンド・アロー・シグナル 指標は、XAU/USDにおける高速・短期スキャルパー向けに最適化された、正確でリアルタイムのトレンド分析を提供します。 1分足専用に設計されたこのツールは、明確なエントリーポイントを示す方向矢印を表示し、スキャルパーが変動の激しい市場状況でも自信を持って取引できるよう支援します。 この指標は、PRIMARY(主要)とSECONDARY(補助)のアラート矢印で構成されています。PRIMARYシグナルは、トレンドの方向転換を示す白と黒の方向矢印であり、SECONDARYシグナルは、PRIMARY矢印が示す方向を確認し、潜在的なエントリーポイントを示す青と赤の矢印です。 注意:トレンド方向の変化後にPRIMARYアラート矢印が1つだけ表示される場合、複数のSECONDARY青/赤矢印が表示される点に注意が必要です。SECONDARYシグナルは、シグナル基準を満たす任意のローソク足後に表示されます。したがって、長期的なトレンド移動の場合、画面に多くのSECONDARY矢印が表示されます(添付の
First 25 copies at $80, after that price becomes $149 (3 copies left) Gold Signal Pro is a powerful MT4 indicator designed to help traders spot strong price reactions in the market. It focuses on clear wick rejections , showing when price strongly rejects a level and often continues in the same direction. Gold Signal Pro is mainly built for scalping gold (XAUUSD) and works best on lower timeframes like M5 and M15 , where timing matters most. That said, it can also be used on any forex pair, a
Trend indicator AI
Ramil Minniakhmetov
4.66 (80)
Trend Ai indicatorは、トレンドの識別と実用的なエントリポイントと反転アラートを組み合わせることで、トレーダーの市場分析を強化する優れたツールです。 この指標は、ユーザーが自信と正確さで外国為替市場の複雑さをナビゲートすることを可能にします トレンドAiインジケーターは、主要なシグナル以外にも、プルバックやリトレースメント中に発生するセカンダリエントリポイントを識別し、トレーダーが確立されたトレンド内の価格修正を活用できるようにします。 重要な利点: *MT4およびMT5の仕事 *明確な買いまたは売りシグナル *再描画しません ·すべての資産で動作します 私はeaやセットをtelegram it詐欺で販売しないように注意してください。 すべての設定はここでブログで無料です。  重要! 指示とボーナスを得るために購入後すぐに私に連絡してください! 私の他のプロダクトと同様、実質操作の監視はここに見つけることができます: https://www.mql5.com/en/users/mechanic/seller&nbsp ; 設定および入力: すべての
An exclusive indicator that utilizes an innovative algorithm to swiftly and accurately determine the market trend. The indicator automatically calculates opening, closing, and profit levels, providing detailed trading statistics. With these features, you can choose the most appropriate trading instrument for the current market conditions. Additionally, you can easily integrate your own arrow indicators into Scalper Inside Pro to quickly evaluate their statistics and profitability. Scalper Inside
このインジケーターは、反転ポイントと価格戻りゾーンを正確に表示します。     主要プレーヤー 。新たなトレンドが形成される場所を把握し、最大限の精度で意思決定を行い、すべての取引をコントロールします。 TREND LINES PRO インジケーターと組み合わせることで、その潜在能力を最大限に発揮します。 インジケーターが示す内容: 新しいトレンドの始まりに活性化する反転構造と反転レベル。 リスクと報酬の比率を最小限に抑えた利益 確定 と 損失停止の レベルの表示     RR 1:2   。 インテリジェントな削減ロジックによるストップロス。 指定されたインジケーターから 2 つのトレンド タイプの反転パターンを表示します。 指標: トレンドを追う   TREND LINES PRO   (世界的なトレンドの変化) TREND PRO   (クイックトレンド変更) シンプルで効果的   スキャナー   リアルタイムトレンド(新機能)。 マルチタイムフレームのインストゥルメント フィルタリング。 画面   利益     LOGIC AI信号の後。 当日プラス方向に動いた銘柄のリスト。
PRO Renko Systemは、特別にRENKOチャートを取引するために設計された高精度の取引システムです。 これは、様々な取引商品に適用することができる普遍的なシステムです。 システムは効果的に正確な逆転信号へのアクセスを与えるいわゆる市場の騒音を中和する。 表示器は非常に使いやすく、信号の生成に責任がある1つの変数だけがあります。 あなたは簡単にお好みの任意の取引ツールとレンコバーのサイズにツールを適応させることができます。 私はいつもあなたが私のソフトウェアで収益性の高い取引を支援するために余分なサポートを提供する準備ができています! 私はあなたに幸せで収益性の高い取引をしたいです! ご購入後にご連絡ください! 私はあなたに私のレンコチャートジェネレータを送信します。 私はまた、私の個人的な推奨事項やシステムの他のモジュールを無料で共有します!
通貨強さウィザードは、取引を成功させるためのオールインワン ソリューションを提供する非常に強力な指標です。このインジケーターは、複数の時間枠のすべての通貨のデータを使用して、このまたはその外国為替ペアのパワーを計算します。このデータは、使いやすい通貨インデックスと通貨パワーラインの形式で表され、特定の通貨のパワーを確認するために使用できます。 必要なのは、取引したいチャートにインジケーターを接続することだけです。インジケーターは、取引する通貨の実際の強さを示します。このインジケーターは、トレンドに合わせて取引するときに有利に利用できる売買高の圧力の極値も示します。このインジケーターには、フィボナッチに基づく可能なターゲットも表示されます。 このインジケーターは、PUSH 通知を含むあらゆるタイプのアラートを提供します。 購入後ご連絡下さい。私の取引のヒントをあなたと共有し、素晴らしいボーナスインジケーターを無料で提供します! 幸せで有益な取引をお祈りします。
"Dragon's Tail" is an integrated trading system, not just an indicator. This system analyzes each candle on a minute-by-minute basis, which is particularly effective in high market volatility conditions. The "Dragon's Tail" system identifies key market moments referred to as "bull and bear battles". Based on these "battles", the system gives trade direction recommendations. In the case of an arrow appearing on the chart, this signals the possibility of opening two trades in the indicated directi
Gold Scalper Super is an easy-to-use trading system. The indicator can be used as a standalone scalping system on the M1 time frame, as well as part of your existing trading system. Bonus: when purchasing an indicator, Trend Arrow Super is provided free of charge, write to us after purchase. The indicator 100% does not repaint!!! If a signal appears, it does not disappear! Unlike indicators with redrawing, which lead to the loss of a deposit, because they can show a signal and then remove it.
Apollo SR Master は、サポート/レジスタンスゾーンを利用した取引をより容易かつ確実にする特別な機能を備えたサポート/レジスタンスインジケーターです。このインジケーターは、ローカル価格の高値と安値を検出することで、タイムラグなしでリアルタイムにサポート/レジスタンスゾーンを計算します。そして、新たに形成されたSRゾーンを確認するために、インジケーターは特別なシグナルを表示します。このシグナルは、SRゾーンを実際の売りまたは買いシグナルとして考慮して使用できることを示します。この場合、SRゾーンの強度が高まり、SRエリアからの取引が成功する確率も高まります。これがこのインジケーターの基本的な考え方です。 SRゾーンは、ストップロスとテイクプロフィットの設定を容易にします。シグナルの方向に応じて、SRゾーンの上または下のスペースをストップロスとして設定できます。さらに、反対側のSRゾーンは、潜在的なテイクプロフィットエリアとして設定できます。 また、Apollo SRマスターインジケーターをご利用のすべてのユーザーには、「Apollo Price Action System」
Scalper Vault は、スキャルピングを成功させるために必要なすべてを提供するプロフェッショナルなスキャルピング システムです。このインジケーターは、外国為替およびバイナリー オプションのトレーダーが使用できる完全な取引システムです。推奨される時間枠は M5 です。 システムは、トレンドの方向に正確な矢印シグナルを提供します。また、トップとボトムのシグナルとギャン マーケット レベルも提供します。 インジケーターは、プッシュ通知を含むすべてのタイプのアラートを提供します。 インジケータの購入後にご連絡ください。私の個人的な取引の推奨事項と素晴らしいボーナス指標を無料で共有します! 幸せで有益な取引をお祈りします!
Presenting one-of-a-kind Gann Indicator for XAUUSD IQ Gold Gann Levels is a non-repainting, precision tool designed exclusively for XAUUSD/Gold intraday trading. It uses W.D. Gann’s square root method to plot real-time support and resistance levels, helping traders spot high-probability entries with confidence and clarity. William Delbert Gann (W.D. Gann) was an exceptional market analyst whose trading technique was based on a complex blend of mathematics, geometry, astrology, and ancient calcul
Super Signal – Skyblade Edition プロ仕様のノンリペイント / ノーラグ・トレンドシグナルシステム。卓越した勝率を実現 | MT4 / MT5 対応 1分足、5分足、15分足などの低い時間足で最も効果を発揮します。 主な特徴: Super Signal – Skyblade Edition は、トレンド取引に特化したスマートなシグナルシステムです。マルチレイヤーのフィルターロジックを用いて、明確な方向性と実際のモメンタムに支えられた強力なトレンドのみを検出します。 このシステムは 天井や底を予測するものではありません 。次の3つの条件がすべて満たされた場合にのみシグナルを発生させます: 明確なトレンド方向 モメンタムの増加 健全なボラティリティ構造 市場セッションに基づく流動性分析と組み合わせることで、シグナルの精度とタイミングがさらに向上します。 シグナルの特性: すべての矢印シグナルは 100% 非リペイント / 遅延なし 一度出現したシグナルは固定され、点滅・消失しません チャート上の矢印、情報パネル、ポップアップ通知、音声アラート、プッシュ通知
Pulse Scalping Line - an indicator for identifying potential pivot points. Based on this indicator, you can build an effective Martingale system. According to our statistics, the indicator gives a maximum of 4 erroneous pivot points in a series. On average, these are 2 pivot points. That is, the indicator shows a reversal, it is erroneous. This means that the second signal of the indicator will be highly accurate. Based on this information, you can build a trading system based on the Martingale
MetaForecast M4
Vahidreza Heidar Gholami
5 (2)
MetaForecastは、価格データのハーモニクスに基づいて、どんな市場の未来を予測し視覚化します。市場が常に予測可能ではありませんが、価格にパターンがある場合、MetaForecastは可能な限り正確な未来を予測できます。他の類似製品と比較して、MetaForecastは市場のトレンドを分析することでより正確な結果を生成することができます。 入力パラメータ Past size (過去のサイズ) MetaForecastが将来の予測を生成するために使用するバーの数を指定します。モデルは選択したバー上に描かれた黄色の線で表されます。 Future size (将来のサイズ) 予測すべき将来のバーの数を指定します。予測された将来は、ピンクの線で表示され、その上に青い回帰線が描かれます。 Degree (程度) この入力は、MetaForecastが市場で行う分析のレベルを決定します。 Degree 説明  0 Degree 0の場合、価格の全てのピークや谷、そして詳細をカバーするために、「Past size」の入力に大きな値を使用することが推奨されています。  1 (推奨) Degre
説明書(ロシア語)  /  説明書 (英語)  /  バージョン MT5 主な機能: 売り手と買い手のアクティブなゾーンを表示します。 このインジケーターは、買いと売りの適切な最初のインパルスレベル/ゾーンをすべて表示します。これらのレベル/ゾーンがアクティブになると、エントリーポイントの探索が始まり、レベルの色が変わり、特定の色で塗りつぶされます。状況をより直感的に把握できるように、矢印も表示されます。 LOGIC AI - テンプレートをアクティブ化するときにエントリポイントを検索するためのゾーン(円)の表示 視認性を向上させるため、人工知能を用いて進入ポイントを探索したゾーンを表示する機能が追加されました。 より高い時間枠からのレベル/ゾーンの表示(MTFモード) より長い時間間隔でレベル/ゾーンを表示する機能を追加しました。また、インジケーターに自動トレンド検出機能(   TPSproTREND PRO   )を実装しました。 取引のための個別の専門的なステップバイステップのアルゴリズム このアルゴリズムは、トレンドの方向と逆方向の両方でデイトレードを行うために設計されていま
Volatility Trend System - a trading system that gives signals for entries. The volatility system gives linear and point signals in the direction of the trend, as well as signals to exit it, without redrawing and delays. The trend indicator monitors the direction of the medium-term trend, shows the direction and its change. The signal indicator is based on changes in volatility and shows market entries. The indicator is equipped with several types of alerts. Can be applied to various trading ins
FX Power: 通貨の強弱を分析して、より賢い取引を実現 概要 FX Power は主要通貨と金の実際の強弱をあらゆる市場状況で理解するための必須ツールです。強い通貨を買い、弱い通貨を売ることで、 FX Power は取引の意思決定を簡素化し、高い確率の取引機会を見出します。トレンドを追従する場合でも、極端なデルタ値を使用して反転を予測する場合でも、このツールはあなたの取引スタイルに完全に適応します。ただ取引するだけではなく、 FX Power で賢く取引をしましょう。 1. なぜ FX Power がトレーダーにとって非常に有益なのか 通貨と金のリアルタイム強弱分析 • FX Power は主要通貨と金の相対的な強弱を計算し、マーケットダイナミクスに関する明確な洞察を提供します。 • どの資産がリードしているか、または後れを取っているかを監視して、取引するペアを賢く選びましょう。 マルチタイムフレームの包括的なビュー • 短期、中期、長期のタイムフレームで通貨と金の強弱を追跡し、マーケットトレンドに基づいて取引戦略を調整できます。 • スキャルピングからスイングトレード
まず第一に、この取引インジケーターは再描画されず、再描画されず、遅延しないことを強調する価値があります。これにより、手動取引とロボット取引の両方に理想的なものになります。 ユーザーマニュアル:設定、入力、戦略。 アトミックアナリストは、価格の強さとモメンタムを利用して市場でより良いエッジを見つけるためのPA価格アクションインジケーターです。ノイズや誤ったシグナルを除去し、取引ポテンシャルを高めるための高度なフィルターを備えています。複雑なインジケーターの複数のレイヤーを使用して、アトミックアナリストはチャートをスキャンし、複雑な数学的計算をシンプルなシグナルと色に変換します。これにより、どのような初心者トレーダーでも理解して使用し、一貫した取引の決定を行うことができます。 「アトミックアナリスト」は、新規および経験豊富なトレーダー向けにカスタマイズされた包括的な取引ソリューションです。プレミアムインジケーターとトップノッチの機能を1つの取引戦略に組み合わせ、すべてのタイプのトレーダーにとって汎用性のある選択肢にします。 デイリートレーディングとスキャルピング戦略:高速で正確な
Full Fledged EA and Alert plus for alerts will also be provided in this offer along with the purchase of Indicator. Limited copies only at this price and Ea too. Grab your copy soon Alert plus for indicator with set file is kept in comment section with the image  SMC Blast Signal with FVG, BOS and trend Breakout The SMC Blast Signal is a Precise trading system for Meta Trader 4 that uses Smart Money Concepts (SMC), including Fair Value Gaps (FVG) and Break of Structure (BOS), to identify high-pr
現在40%OFF! 初心者やエキスパートトレーダーのためのベストソリューション! このダッシュボードソフトウェアは、28の通貨ペアで動作しています。それは私達の主要な指標(高度な通貨の強さ28と高度な通貨インパルス)の2に基づいています。それは全体の外国為替市場の大きい概観を与えます。それは、すべての(9)時間枠で28の外国為替ペアのための高度な通貨の強さの値、通貨の動きの速度と信号を示しています。チャート上で1つのインディケータを使用して市場全体を観察し、トレンドやスキャルピングの機会をピンポイントで見つけることができたら、あなたのトレードがどのように改善されるか想像してみてください。 このインディケータには、強い通貨と弱い通貨の識別、潜在的な取引の識別と確認がより簡単になるような機能が搭載されています。このインディケータは、通貨の強さや弱さが増加しているか減少しているか、また、すべての時間枠でどのように機能しているかをグラフィカルに表示します。 新機能として、現在の市場環境の変化に適応するダイナミックなマーケットフィボナッチレベルが追加され、すでに当社のAdvanced
This indicator depends on some secrets equations to draw Signals with Stop loss and maximum 4 Take profits. There is a free EA depends on this indicator as a gift when you purchase/rent it. Features Simply it gives you entry point as Ready sign (Buy / Sell) and arrow (Buy / Sell) after candle closed, also SL line and 4 TP lines or less. Once SL-TP lines are shown with the arrow, they remains as they are until signal change. It is historical indicator. No Repaint. user manual for V5 please click
トレンドラインプロ   市場の真の方向転換点を理解するのに役立ちます。この指標は、真のトレンド反転と主要プレーヤーが再び参入するポイントを示します。 分かりますか     BOSライン   複雑な設定や不要なノイズなしに、より長い時間足でのトレンドの変化と重要なレベルを把握できます。シグナルは再描画されず、バーが閉じた後もチャート上に残ります。 VERSION MT 5     -     RFI LEVELS PRO インジケーター と組み合わせることで、その潜在能力を最大限に発揮します。 インジケーターが示す内容: 本当の変化   トレンド(BOSライン) 一度シグナルが現れたら、それは有効です!これは、リペイント機能を持つインジケーターとの重要な違いです。リペイント機能を持つインジケーターは、シグナルを発した後、それを変更し、資金の損失につながる可能性があります。これにより、より高い確率と精度で市場に参入できます。また、矢印が現れた後、目標値(利益確定)に達するか、反転シグナルが現れるまで、ローソク足の色を変更する機能もあります。 繰り返しエントリ       主要プレーヤーの
作者のその他のプロダクト
True Momentum LPD
Safwan Rushdi Khalil Arekat
MT5 Version : Pre Note : The indicator uses the Open price value for calculations. This indicator represents a genuine momentum oscillator according to the true definition of "Momentum", and as realised by the techniques of digital filters. Scholarly papers   on the subject   by the current developer can be found   here  and here , but in this description we shall borrow only the minimum of conceptual and mathematical framework needed. In the process, we expose some long-held myths about indica
FREE
True Momentum
Safwan Rushdi Khalil Arekat
5 (7)
This indicator represents a genuine momentum oscillator according to the true definition of "Momentum", and as realised by the techniques of digital filtering. ( Note : download a complete set of true momentum oscillators  here ). A scholarly paper on the subject   by the current developer can be found here , but in this description we shall borrow only the minimum of conceptual and mathematical framework needed. In the process, we expose some long-held myths about indicators supposedly measurin
FREE
Jerk Indicator
Safwan Rushdi Khalil Arekat
5 (1)
In physics, "Jerk" is the third time-derivative of position, with acceleration being the second derivative and velocity the first derivative. In technical analysis, the first derivative of price is the price momentum, with the second derivative,acceleration, being seldom used and the third derivative virtually unknown. The magnitude frequency response of a digital differentiator is a positive-slope straight line passing through zero frequency. Therefore, every instance of a digital signal differ
FREE
This indicator demonstrates that the price change of financial instruments is NOT a random walk process, as advocated by the "Random Walk Hypothesis", and as popularised by the bestselling book "A Random Walk Down Wall Street". I wish that were the case!  It is shown here that the real situation with price change is actually much worse than a random walk process!  Deceptive market psychology, and the bulls-bears tug of war, stack up the odds against traders in all instruments, and all time frame
FREE
Top Gun Oscillators
Safwan Rushdi Khalil Arekat
5 (2)
Note : New in 1.6: the indicator now exports the trade signal (but not displayed). Go long with light blue. Go short with red. Exit otherwise. Signal to be imported to your EA using iCustom. This indicator provides Best of the Best linear filter momentum oscillators that I am aware of (Low Pass Differentiators, LPD's) . All of them are  recent developments by this developer, or other researchers. The oscillator line is the first buffer of the indicator, and can be called  in other indicators or
FREE
This indicator is a useful tool for visualising cyclic components in price. It calculates the Discrete Fourier Transform (DFT) of a price chart data segment selected by the user. It displays the cycles, the spectrum and the synthesised signal in a separate window.  The indicator is intended as a learning tool only, being unsuitable for providing actual trade signals. Download the file -  it is a free toy. Play with it to understand how signals can be transformed by controlling their cyclic comp
FREE
Latest Changes in 1.6 :  Added Signal Modes input. Mode 1 : HPF positive go long blue, HPF negative go short red. Mode 2 : slow envelope only, HPF above upper envelope go long blue, HPF below lower envelope go short red. Mode 3 : HPF above both upper envelopes - go long blue, HPF below both lower envelopes go short red. Mode 4 : Go long blue if HPF crosses above upper slow, but fast upper should be below slow upper at the time, exit when HPF crosses below upper fast, reverse logic for short red
FREE
This indicator resolves an unrecognised defect in the Commodity Channel Index Oscillator (CCI). The CCI is based on a high pass filter calculated by subtracting the p-period simple moving average of a price signal (usually typical value) from the price signal itself. Then, the result is divided by the absolute mean deviation of the same period. The frequency response of a signal minus its simple moving average is shown in the first screen shot (in Blue). (see my free indicator : Q n D Frequency
FREE
This indicator provides trading signals based on the polarity of the dynamical parameters of two digital signals. The dynamical parameters (momentum-acceleration) are derived by applying a high quality momentum oscillator, MTEMA LPD ( see Top Gun Oscillators ) to two digital signals. The MTEMA momentum oscillator is first applied to the price itself. Then, a rectification procedure is applied to the price based on the signals from the momentum oscillator yielding a rectified price signal. This s
FREE
This indicator applies the  biquad high pass filter to the price-chart data, and displays the filter output for the OHLC as candlesticks. The candlesticks corresponds to the actual calculations of the filter value  during the formation of each price bar (not from all historical highs lows or closes). The shape of the bars therefore corresponds directly to the shape of each price bar. High pass filters are an underappreciated type of oscillator that are seldom used in technical analysis in the st
FREE
This indicator does not process the price chart data and does not provide trading signals. Instead, it is  an application to compute and display the frequency response of many conventional indicators. Moving averages like the SMA, LWMA and EMA, and  oscillators like the MACD, CCI, Awsome Osc, all have the form of digital filters. Electronic engineers use a special method to characterise the performance of these filters by studying their frequency response. Two important quantities of the freque
FREE
MUST READ CAUTION BEFORE PURCHASE This  one-of-a-kind indicator displays the instantaneous high resolution High Time Frame Relative Strength Index  (HTF RSI), where  up to three higher time-frame RSI's can be displayed simultaneously on the current chart. The indicator differs drastically from previous multi-time-frame RSI indicators in that it displays  the high resolution bar-by-bar calculation of the HTF RSI - and not just the discrete values at the HTF bar closings. This allows for earlier
フィルタ:
Anpex
399
Anpex 2024.01.07 10:41 
 

ユーザーは評価に対して何もコメントを残しませんでした

レビューに返信