Pivot Points Daily
- Indicatori
- Versione: 1.3
- Aggiornato: 21 gennaio 2023

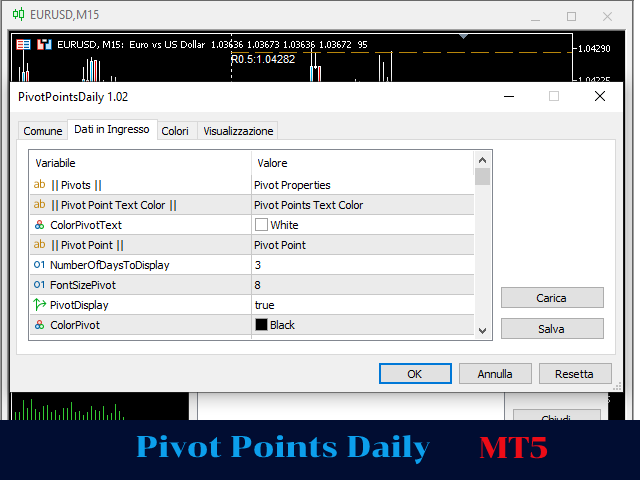
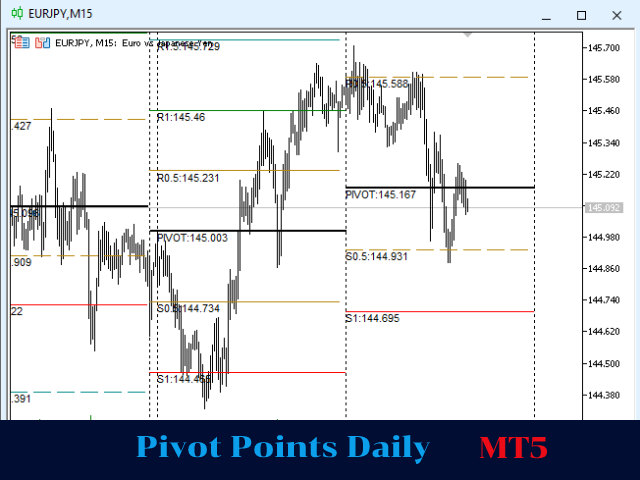
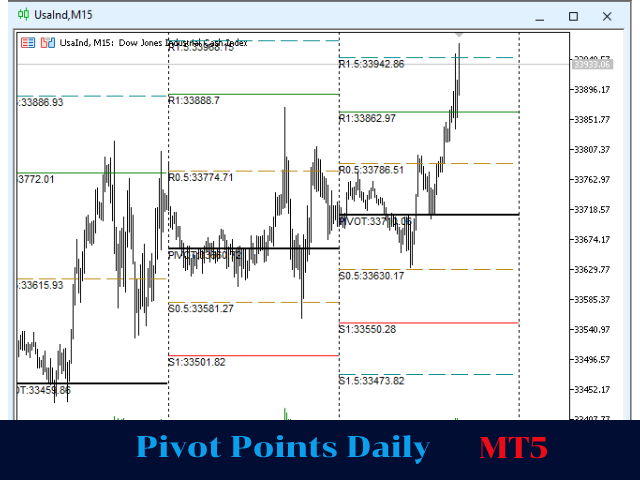
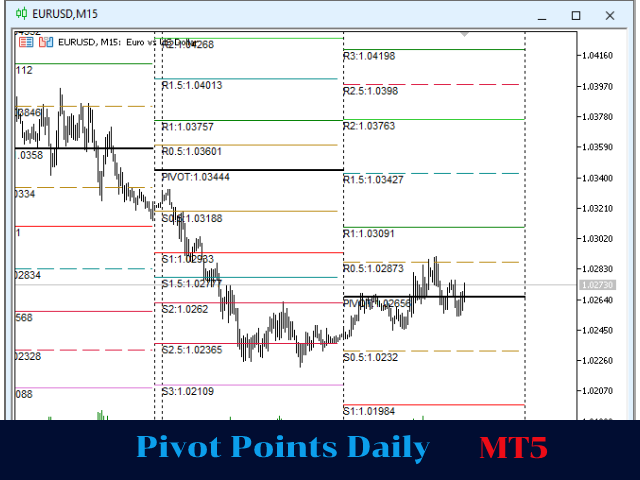
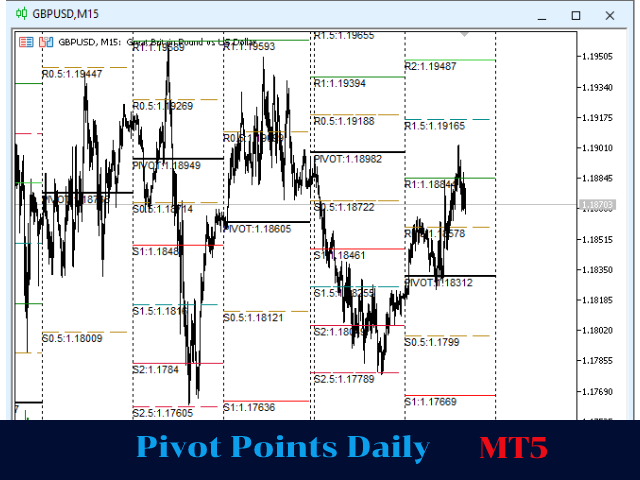
L'indicatore rappresenta i Livelli di Pivo Points. E' possibile specificare il numero dei giorni per il quale l'indicatore viene visualizzato. Per il Forex non viene considerata la sessione di Domenica. E' possibile modificare per ogni livello colore, tipo e spessore linea. La visualizzazione avviene meglio con timeframe inferiori all'H1. Vengono graficati 4 livelli di supporto e resistenza con anche i livelli intermedi che è possibile disabilitare.

Simple and works well, please add R4 R5 S4 S5 are usefull in volatile instruments.
Which kind of pivot is used? I can't understand if is a classic, traditional, fibonacci... etc... can you give the possibility to select it? I need the classic.