DailySessions
- インディケータ
- バージョン: 1.1
- アップデート済み: 4 4月 2024

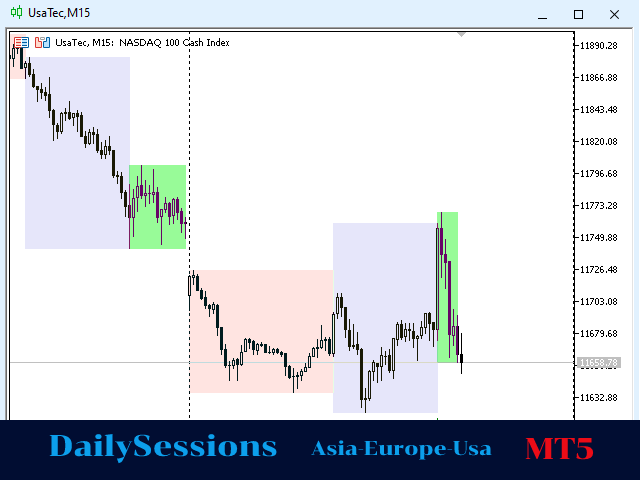
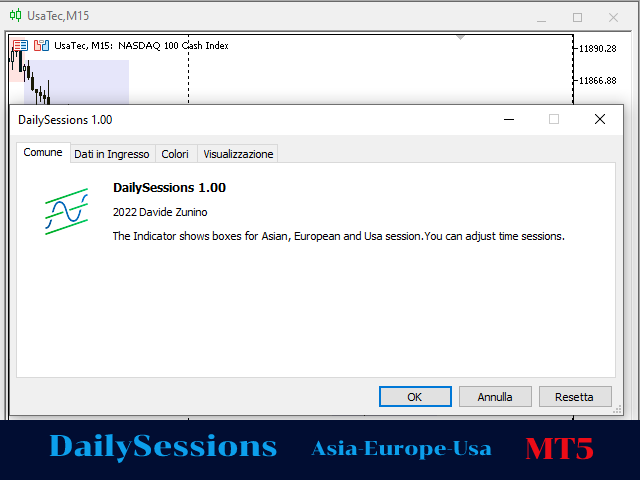
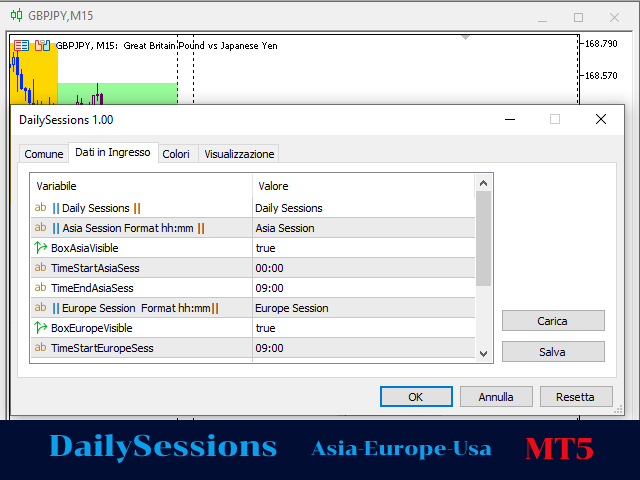
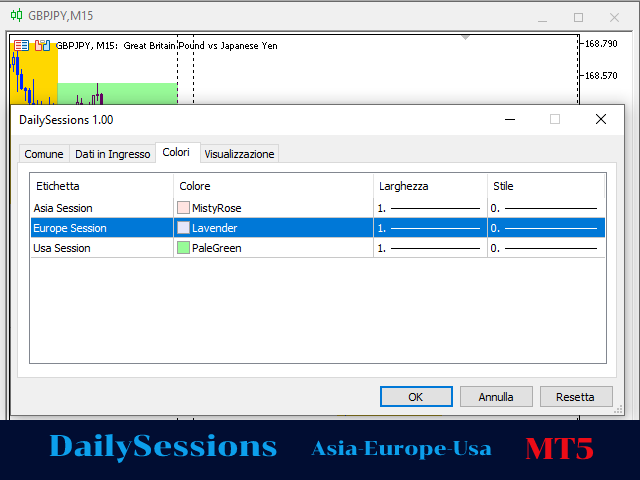
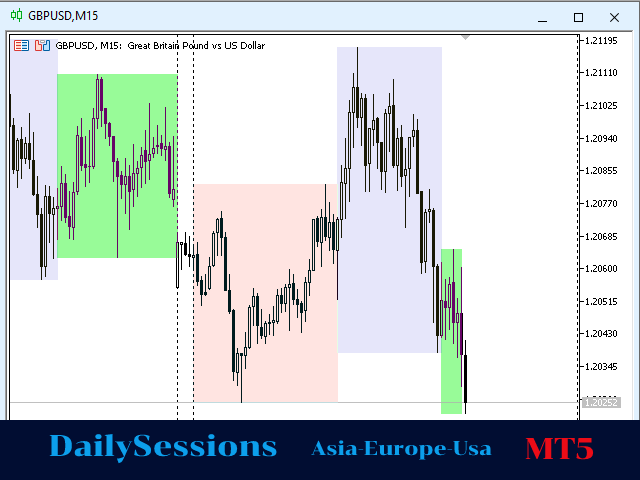
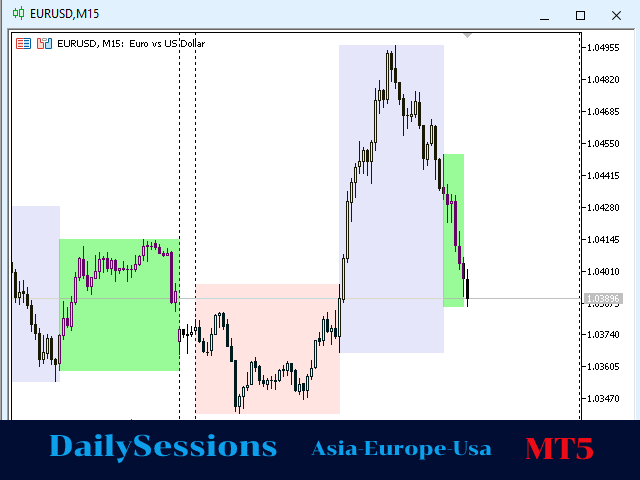
The indicator represents the session boxes for the Asian, European and American sessions. It is possible to change the time of each session, such as color. It is also possible to disable the display of each session. You will find in input parameters variables to modify in format hh:mm. In Colors tab you can change the color of boxes of each sessions. If you need some implementations please contact me.


Works exactly as expected, great job, thank you