• 概要
  • レビュー
  • コメント (4)
  • 最新情報

Wizard Poverty Sanitizer


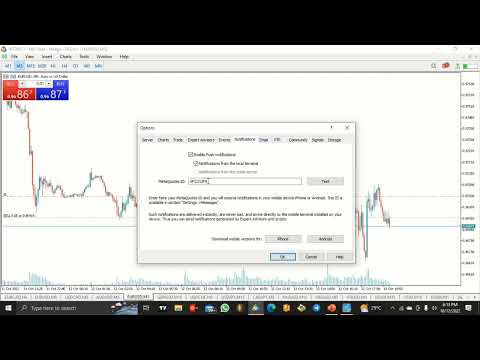
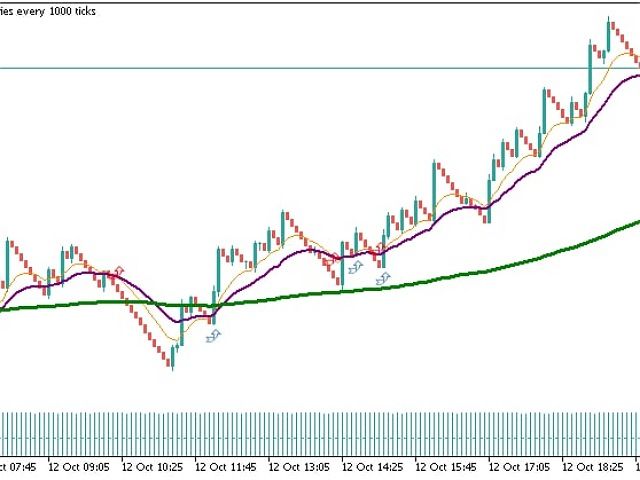
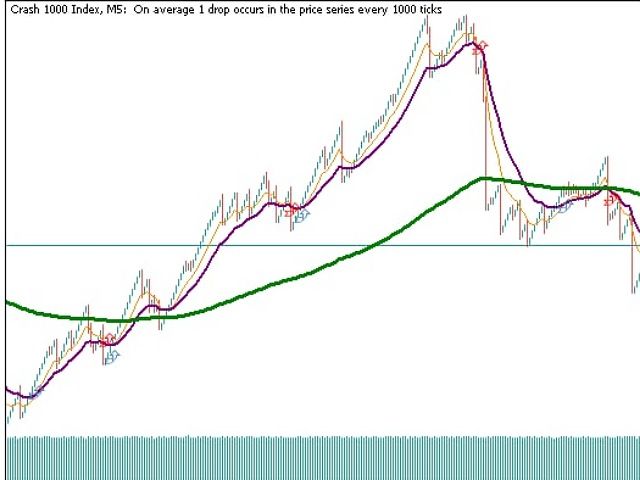
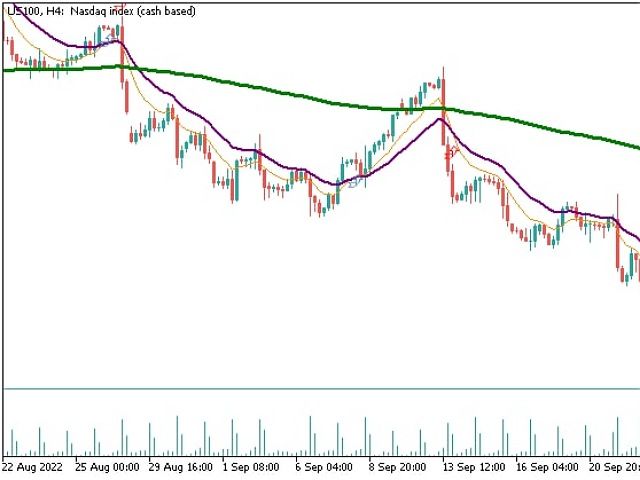
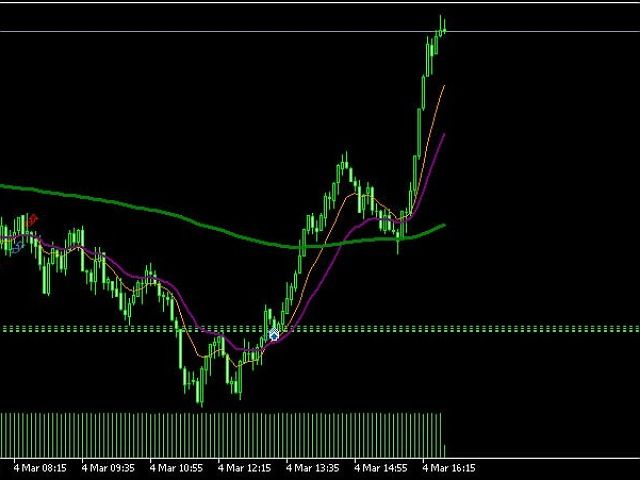
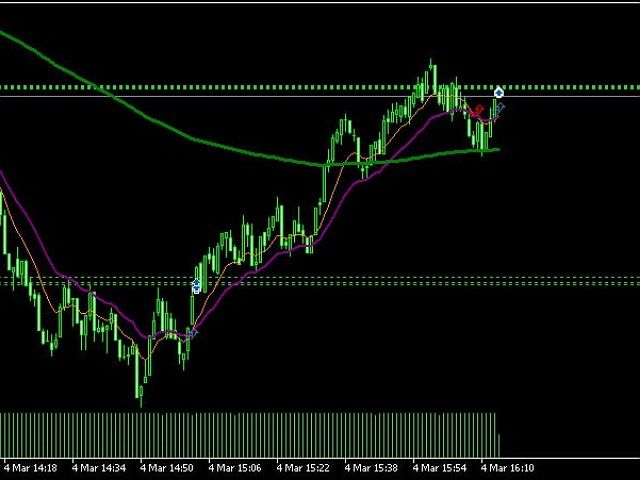
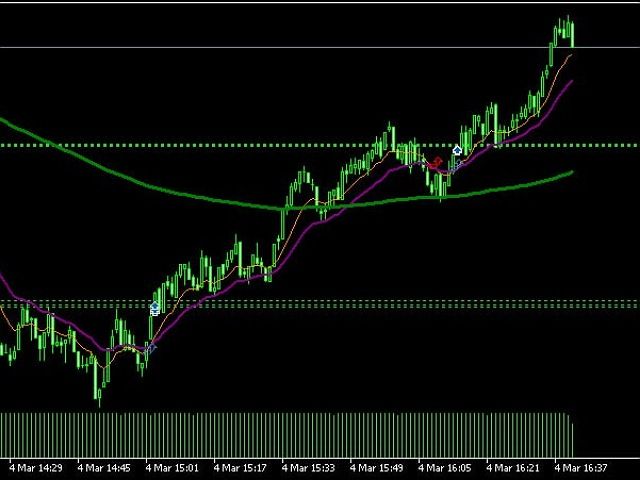
Wizard Poverty Sanitizer is a moving average based indicator, using three EMA'S being 2OO EMA which is the slow EMA, the 21 EMA which is the median and the 10 EMA which is the fast. When the median and the fast EMA cross a signal is given, when the fast EMA goes above the Median EMA a buying signal is given and when the fast cross below the median a selling is given. Note that you can change the moving averages to you own choices of moving averages, allowing you to set your own MA strategy.  and  signals can be received in 10 different languages : English, Sepedi, isizulu, Tshivenda, XiTsong, Afrikaans, French, Spanish, Portuguese, and Russian.

Join mql5 Wizard Poverty Sanitizer channel https://www.mql5.com/en/channels/wizardpovertysanitizer

Recommendations

  • Always buy when the median and fast EMA are above the slow EMA
  • Always sell when the median and fast EMA are below the slow EMA
  • Use the EMA to get the trend of the market.
  • Use the EMA as support or resistance.

Note that indicator will keep being updated constantly check for updates.  

おすすめのプロダクト
The   CAP Channel Trading   is a volatility-based indicator that makes use of the “advanced envelope theory”. These envelopes consist of two outer lines. Envelope theory states that the market price will generally fall between the boundaries of the envelope (or channel). If prices move outside the envelope, it is a trading signal or trading opportunity. Benefits of the Channel Trading Indicator CAP Channel Trading works with any asset It can be applied to any financial assets: forex, cryptoc
FREE
Bollinger Bands B
Flavio Javier Jarabeck
5 (3)
John Bollinger created this indicator in 2010 as a way to read the original indicator (Bollinger Bands) in a more "technical" way, shown as an oscillator. The typical range of the Bollinger Bands %B is 0 - 0.5 - 1.0, where "0" represents the lower band, the "0.5" the middle band, and "1" the upper band. The line on the indicator represents the Closing prices. As simple as that. SETTINGS Bollinger Bands period of analysis Standard Deviation multiplier Shift Price type to be analyzed If you
FREE
AoMA is an indicator based on analytical geometry calculations, where the average price angle of a given period is calculated. Being a powerful indicator of reversal points and supports, supports and resistances become objective with the formation of well-defined "plateau" areas. It can be used for trend monitoring and the anticipation of trend reversal points. Two levels of periods are available, a short and a long one, and period crossings can be used as indicative of buying and selling
SchaffTrendCycle
Juan Manuel Rojas Perez
5 (2)
Schaff Trend Cycle (STC)  "CON ALERTAS" El Indicador Schaff Trend Cycle (STC) es una herramienta técnica utilizada en el trading e inversión para identificar tendencias y generar señales de compra o venta. ¿Qué es el Schaff Trend Cycle? El STC fue desarrollado por Doug Schaff para mejorar las medias móviles incorporando análisis de ciclos. Su objetivo es identificar tendencias y cambios de tendencia midiendo la fuerza y velocidad de los cambios de precio. Es un oscilador que mide la velocida
FREE
SST Vwap
Eduardo Sergio Wolff Garufi
5 (8)
VWAP, or volume-weighted average price, helps traders and investors observe the average price that major traders consider the "fair price" for that move. VWAP is used by many institutions to set up large operations. In this indicator, you can enjoy the following features: Daily VWAP, with option to display your current price next to the chart VWAP Weekly, with option to display your current price next to the chart Monthly VWAP, with option to display your current price next to the chart
FREE
トレーダーは、異なる市場活動時間や取引量が通貨ペアのボラティリティや取引機会に直接影響するため、取引時間帯の影響に注意を払う必要があります。市場状況を包括的に把握し、より良い取引戦略を立てるために、当社では取引セッションインジケータを開発しました。 このインジケータは、アジア、ロンドン、ニューヨーク市場の取引時間を表示します。ユーザーは、より便利な使用のために異なる取引時間帯を表示または非表示に設定できます。さらに、設定に基づいて取引セッションの名前を表示または非表示にすることができ、最大表示数を制限することもできます。 実際の使用プロセスは非常に簡単です。インジケータを購入したら、MetaTrader 5プラットフォームのインジケータフォルダにインジケータファイルをコピーし、MetaTrader 5プラットフォームで適用したいチャートを開き、インジケータリストからインジケータを選択し、チャートにドラッグアンドドロップします。 インジケータが正常に適用されると、アジア、ロンドン、ニューヨーク市場の取引時間が表示される表が表示されます。個人設定に基づいて異なる取引時間帯を表
FREE
Este Indicador esta basado en el rebote de un soporte o resistencia fuerte con un indicador que tiene interno de fuerza de movimiento. Tiene la opción de ver el soporte y resistencia actual y ver la fuerza que tiene dicho soporte o resistencia.(Activando el parámetro Ver_Sop_Res ) Parámetros: Sop o Res, Fuerza Mayor a...: Con este parámetro podrás ajustar la fuerza del soporte o resistencia, con la cual el indicador evaluara si es una señal bajista o alcista. Velas Historial: Con este parámetro
The PriceActionOracle indicator greatly simplifies your trading decision-making process by providing accurate signals about market reversals. It is based on a built-in algorithm that not only recognizes possible reversals, but also confirms them at support and resistance levels. This indicator embodies the concept of market cyclicality in a form of technical analysis. PriceActionOracle tracks the market trend with a high degree of reliability, ignoring short-term fluctuations and noise around
The Predicting Donchian Channel MT5 indicator allows predicting the future changes in the levels of the Donchian channel based on the channel position of the price. The standard ZigZag indicator starts drawing its ray in 99% of the time the opposite Donchian channel is touched. The forecast of the channel boundary levels will help in finding the points, where the correction ends or the trend changes, an also to estimate how soon those events can occur. Configurations Period - Donchian channel
MACDは類似性と差異の移動平均と呼ばれ、二重指数移動平均から作成されます。高速指数移動平均(EMA12)を低速指数移動平均(EMA26)から差し引いて、高速DIFを取得し、次に2× (Express DIF-DIFの9日間の加重移動平均DEA)MACDバーを取得します。 MACDの意味は、基本的に二重移動平均と同じです。つまり、高速移動平均と低速移動平均の分散と集約は、現在のロングショートステータスと株価の開発傾向の可能性を特徴づけますが、読む方が便利です。 MACDの変化は市場動向の変化を表し、さまざまなKラインレベルのMACDは、現在のレベルサイクルにおける売買傾向を表します。 1.このインジケーターは、MACDの2行表示を追加します。 2.そしてエネルギーカラムに4つの異なる勾配を適用します! トレンドインジケーター、 波動標準の自動計算 、 MT5バージョンの波動標準の自動計算を強くお勧めします   Necessary for traders: tools and indicators Waves automatically calculate indicators
FREE
The best time to trade Using this Indicator is when the time reach exactly hour,half,45 minutes,15 minutes and sometimes 5 minutes.. This indicators is helpful to those who trade boom and crash indecies.How to read this indicator first you'll see Blue allow and Red allow all these allows used to indicate or to detect the spike which will happen so the allow happens soon before the spike happen.This indicator works properly only in boom and crash trading thing which you have to consider when
CRIANDO OPORTUNIDADE COM ROBÔ INVESTIDOR O curso “Criando Oportunidade com Robô Investidor” é destinado para pessoas que acreditam serem capazes de gerar suas próprias oportunidades no mercado digital , através da programação de sistemas automatizados você será capaz de criar seus próprios robôs e executar suas operações operando seu próprio capital ou de terceiro, além de descobrir onde e como vender seus robôs.
Necessary for traders: tools and indicators Waves automatically calculate indicators, channel trend trading Perfect trend-wave automatic calculation channel calculation , MT4 Perfect trend-wave automatic calculation channel calculation , MT5 Local Trading copying Easy And Fast Copy , MT4 Easy And Fast Copy , MT5 Local Trading copying For DEMO Easy And Fast Copy , MT4 DEMO Easy And Fast Copy , MT5 DEMO 砖图 Renko PRO->>>   The display of the brick map on the main map. The Renko chart ideal
FREE
This Indicator draws Fibonacci Extension levels in two different ways. You can select whether to draw Fibonacci Extension levels based on your favourite ZigZag settings or you can let the indicator to draw Fibonacci Extension  level based on given number of Bars or Candles.  You can also set Mobile and Email notification for your favourite Extension  levels individually. With this indicator you will not have to feel lonely as the it can generate Voice alerts, which will keep you focused on your
Just learning how to create an indicator from this tutorial . its just a garbage text to fill the descriptions. Hello there. Hello there Hello there Hello there Hello there Hello there Hello there Hello there Hello there Hello there Hello there Hello there Hello there Hello there Hello there Hello there Hello there Hello there Hello there Hello there Hello there
FREE
Introduction The PF Maximizer is a game-changing non-repainting technical tool engineered to help traders distinguish genuine trend signals from erratic market fluctuations. By employing sophisticated algorithms and cutting-edge data analysis, this indicator efficiently filters out unwanted noise, empowering traders to identify the precise starting and ending points of substantial market moves. Signal Potential buy signal is generated when moving average is going up and the blue line c
FREE
This Indicator draws Fibonacci Arc levels in two different ways. You can select whether to draw Fibonacci Arc levels based on your favourite ZigZag settings or you can let the indicator to draw Arc levels based on given number of bars or candles.  You can also set Mobile and Email notification for your favourite Arc levels individually. With this indicator you will not have to feel lonely as the it can generate Voice alerts, which will keep you focused on your trading and remove boredom.  Produc
Necessary for traders: tools and indicators Waves automatically calculate indicators, channel trend trading Perfect trend-wave automatic calculation channel calculation , MT4 Perfect trend-wave automatic calculation channel calculation , MT5 Local Trading copying Easy And Fast Copy , MT4 Easy And Fast Copy , MT5 Local Trading copying For DEMO Easy And Fast Copy , MT4 DEMO Easy And Fast Copy , MT5 DEMO The homeopathic indicator is also called the CCI indicator. The CCI indicator was propos
FREE
The  Market Sessions Indicator for MT5 helps you  predict market turnarounds  by detecting major supply and demand areas. These pivot points tend to occur after a new session has started and the previous one is still open. It is also used to gauge how many points or pips the market moves on average during a session. This helps us to place better our take profits and stop losses. The indicator works on all forex pairs, gold, silver, commodities, stocks, indices and any other instrument that your
Indicator introduction: The indicator draws wave lines and histograms, It has small price lag, and the signal will not drift. The indicator can send emails, alerts and notifications to you when previous k line has an up arrow and it is under the histogram sections or it has a down arrow. you can choose whether or not to send the two kind of alerts, the alerts repetition times can also be changed. If the indicator appears red and green histograms, this is a buy zone. It can be used to analyze mar
FREE
KT Renko Patterns scans the Renko chart brick by brick to find some famous chart patterns that are frequently used by traders across the various financial markets. Compared to the time-based charts, patterns based trading is easier and more evident on Renko charts due to their uncluttered appearance. KT Renko Patterns features multiple Renko patterns, and many of these patterns are extensively explained in the book titled Profitable Trading with Renko Charts by Prashant Shah. A 100% automate
To download MT4 version please click here . This is the exact conversion from TradingView: "WaveTrend [LazyBear]" By "zeusuk3". One of the coolest indicators out there to detect overbought and oversold zones. It can be used as a part of more complicated strategy and for confirming a potential trade setup. There are buffers to use in EAs also. The indicator is loaded light and non-repaint. - You can message in private chat for further changes you need. Thanks for downloading 
Volume and RSI-based sniper entry signals for Boom and Crash synthetics feature robust entry alert systems. For more advanced filter signals, consider the Harmonic Hybrid Pro. When trading spikes, three orders are strategically placed to manage risk, with the third order positioned close to the highest probability of a spike. Signals are no longer valid fifteen minutes after the final order, and any losses should be closed promptly. For take profit (Tp), it is advisable to exit shortly after a s
FREE
Colored TRIX
Flavio Javier Jarabeck
4.5 (2)
Developed by Jack Hutson in the 80's, the Triple Exponential Moving Average (a.k.a. TRIX ) is a Momentum technical indicator that shows the percentage of change in a moving average that has been smoothed exponentially 3 times. The smoothing process was put in place in order to filter out price movements that are considered insignificant for the analysis period chosen. We at Minions Labs found hard to follow the smoothness of the original TRIX line, so we colored the TRIX line with BUY and SELL t
FREE
Best SAR MT5
Ashkan Hazegh Nikrou
5 (1)
説明 :  外国為替市場(PSAR)で専門的で人気のあるインジケーターの1つに基づいた新しい無料インジケーターをご紹介します。このインジケーターは元のパラボリックSARインジケーターの新しい変更です。プロSARインジケーターでは、ドットと価格チャートのクロスオーバーを見ることができます。クロスオーバーはシグナルではありませんが、動きの終わりの可能性について話します。新しい青いドットで購入を開始し、最初の青いドットの1 atr前にストップロスを配置し、最後にドットが価格チャートを横切るとすぐに終了できます。 売買シグナルを開く方法は? 最初の青い点によるオープンバイトレードと最初の赤いドットによるオープンセルトレード 正しいストップロスはどこにありますか? 安全なストップロスは最初のドットにある可能性があります(最初の青いドットの買いの場合と最初の赤い点の売りの場合) 正しいテイクプロフィットはどこにありますか? テイクプロフィットはストップロス距離とRRに基づいて調整できるので、私の提案は2 RRで、ストップロスの2倍です。 利益を上げているのにtpを達成でき
FREE
MT4版  | Trend Monitor VZインジケーター  |  Owl Smart Levelsインジケーター   |  Owl Smart Levels戦略   |   FAQ エリオット波理論は 、価格チャート上の波の視覚的モデルに依存している金融市場のプロセスの解釈です。 Valable ZigZagインジケータは、取引の決定を行うために使用することができる市場の波の構造を表示します。 Valable ZigZag indicatorはより安定しており、古典的なZigZag indicatorのように方向を変えることはなく、トレーダーを誤解させます。 これは、指標波の構築にフラクタルを使用することによって達成される。 新しい Expert Advisor Prop Master   - 取引ターミナルでテストしてください https://www.mql5.com/ja/market/product/115375 Valable ZigZagは、主にトレンド指標です 。 これは、トレーダーが取引すべき主な方向性を設定しますが、市場に参入する指標としても機能します。 例
FREE
I present the well-known Moving Average indicator. This indicator is presented as a channel, where the upper and lower lines are equidistant from the main line by a percentage set by the user. The indicator is easy to use. The basic settings of the moving average have been saved and a percentage parameter (Channel%) has been added. Basic parameters: Channel% - shows how much we want to deviate from the main line. The indicator is freely available.
FREE
My Trendline is an Indicator based on Upper and Lower Trendline which will Plot Automatically into the Chart. This Indicator will perfectly indicate you the Trend of the Market. It can be use in any Time Frame. The Indicator will automatically adjust according to the Current Time Frame. Steps to Setup the Indicator: Install the Custom Indicator; Set all the Inputs, Line Color, Width and Styles etc. (Can use the Default Setting also); Set visualization to All Timeframe; and DONE It ca
OHLC Shifted
Francisco Gomes Da Silva
5 (3)
前日の終値とバーのシフト - MetaTrader用のツール! 前日の終値とバーのシフトインジケーターは、テクニカル分析とトレードの意思決定を向上させるために設計されたツールです。このインジケーターを使用すると、任意のバーのオープン、ハイ、ロー、クローズの詳細な情報にアクセスでき、市場の動きを正確かつ包括的に分析することができます。 自分のチャート上でタイムフレームを重ねることができると想像してみてください。これにより、現在のタイムフレーム内でさまざまな時間枠の各バーを詳細に分析することができます。前日の終値とバーのシフトインジケーターを使用すると、この素晴らしい機能が手の届くところにあります。 前日の終値がサポートとレジスタンスとしての重要性は、トレーダーのコミュニティで広く認識されています。このツールを使うことで、前回の終値で価格が停止したレベルを明確かつ正確に確認できるため、購入と売却の意思決定に貴重な洞察を提供します。 インジケーターをチャートに適用すると、前日のオープン、ハイ、ロー、クローズの重要な情報にすぐにアクセスできます。これらの情報は視覚的に魅力的に強調表示されます。
FREE
LineaMMSuavizado
Cesar Juan Flores Navarro
Se considera la secuencia de la serie Fibonacci (2,3,5,8,13) que sera multiplicado por un periodo (11 o 33 o 70 etc.), de las 5 lineas se sacara una sola que sera contendrá el máximo y mínimo de las 5, a esta linea se le aplicara un suavizador de 3....y a esta linea suavizada se le volverá a aplicar un suavizador de 3. obteniéndose 2 lineas suavizadas. A simple vista se ve las intersecciones que hacen las lineas que pueden ser usadas para comprar o vender. Cambien se puede usar con apoyo de otro
このプロダクトを購入した人は以下も購入しています
まず第一に、このトレーディングシステムがノンリペイント、ノンリドロー、ノンラグのインジケーターであることを強調する価値がある。これにより、手動取引とロボット取引の両方に理想的なものになっています。 「スマートトレンドトレーディングシステム MT5」は、新規および経験豊富なトレーダー向けにカスタマイズされた包括的なトレーディングソリューションです。10以上のプレミアムインジケーターを組み合わせ、7つ以上の堅実なトレーディング戦略を備えており、多様な市場状況に対応する多目的な選択肢となっています。 トレンドフォロー戦略:トレンドを効果的に乗り越えるための正確なエントリーとストップロス管理を提供します。 リバーサル戦略:潜在的なトレンドの反転を特定し、トレーダーがレンジ相場を活用できるようにします。 スキャルピング戦略:高速で正確なデイトレードおよび短期取引のために設計されています。 安定性:すべてのインジケーターはノンリペイント、ノンリドロー、ノンラグであり、信頼性の高いシグナルを保証します。 カスタマイズ:個々の取引の嗜好に合わせたカスタム戦略をサポートします。7つ以上の戦略と組み合わせ
まず第一に、この取引インジケーターは再描画されず、再描画されず、遅延しないことを強調する価値があります。これにより、手動取引とロボット取引の両方に理想的なものになります。 アトミックアナリストは、価格の強さとモメンタムを利用して市場でより良いエッジを見つけるためのPA価格アクションインジケーターです。ノイズや誤ったシグナルを除去し、取引ポテンシャルを高めるための高度なフィルターを備えています。複雑なインジケーターの複数のレイヤーを使用して、アトミックアナリストはチャートをスキャンし、複雑な数学的計算をシンプルなシグナルと色に変換します。これにより、どのような初心者トレーダーでも理解して使用し、一貫した取引の決定を行うことができます。 「アトミックアナリスト」は、新規および経験豊富なトレーダー向けにカスタマイズされた包括的な取引ソリューションです。プレミアムインジケーターとトップノッチの機能を1つの取引戦略に組み合わせ、すべてのタイプのトレーダーにとって汎用性のある選択肢にします。 デイリートレーディングとスキャルピング戦略:高速で正確なデイトレーディングおよび短期トレード
ご紹介   クォンタム トレンド スナイパー インジケーターは 、トレンド反転を特定して取引する方法を変革する画期的な MQL5 インジケーターです。 13年以上の取引経験を持つ経験豊富なトレーダーのチームによって開発されました。     クォンタムトレンドスナイパーインジケーター   は、非常に高い精度でトレンドの反転を識別する革新的な方法で、あなたのトレーディングの旅を新たな高みに押し上げるように設計されています。 ***Quantum Trend Sniper Indicatorを購入すると、Quantum Breakout Indicatorを無料で入手できます!*** クォンタム ブレイクアウト インジケーターは、トレンドの反転を特定するとアラートを発し、矢印を示し、3 つのテイクプロフィットレベルを提案します。 初心者トレーダーにもプロのトレーダーにも適しています。 量子EAチャネル:       ここをクリック MT4のバージョン:       ここをクリック 推奨事項: 期間:すべての時間枠。最良の結果を得るには、M
トレンド スクリーナー インジケーターでトレンド取引の力を解き放ちます。ファジー ロジックと複数通貨システムを活用した究極のトレンド取引ソリューションです。 ファジー ロジックを活用した革新的なトレンド インジケーターである Trend Screener を使用して、トレンド取引を向上させます。 これは、13 を超えるプレミアム ツールと機能、および 3 つの取引戦略を組み合わせた強力なトレンド追跡インジケーターであり、Metatrader をトレンド アナライザーにする多用途の選択肢となります。 期間限定オファー : トレンド スクリーナー インジケーターは、わずか 50 ドルで生涯ご利用いただけます。 (元の価格 125$ ) (オファー延長) Trend Screener の 100% 非再描画精度の揺るぎない精度を体験して、取引の決定が過去の価格変動の影響を受けないようにしてください。 マルチタイムフレームおよびマルチ通貨機能の多用途性を解放し、比類のない自信を持って外国為替、商品、暗号通貨、インデックスの世界を取引できるようにします。 Trend Screener の包括的な
Gold Stuff mt5
Vasiliy Strukov
4.89 (167)
Gold Stuff mt5 は、金専用に設計されたトレンド指標であり、あらゆる金融商品にも使用できます。 インジケーターは再描画せず、遅れません。 推奨時間枠 H1. 設定と個人的なボーナスを得るために、購入後すぐに私に連絡してください!   設定 矢印を描く - オンオフ。 チャートに矢印を描く。 アラート - 可聴アラートのオンオフ。 メール通知 - オンオフ。 電子メール通知。 プチ通知 - オンオフ。 プッシュ通知。 次に、色域を調整します。 Gold Stuff mt5 は、金専用に設計されたトレンド指標であり、あらゆる金融商品にも使用できます。 インジケーターは再描画せず、遅れません。 推奨時間枠 H1. 設定と個人的なボーナスを得るために、購入後すぐに私に連絡してください!   設定 矢印を描く - オンオフ。 チャートに矢印を描く。 アラート - 可聴アラートのオンオフ。 メール通知 - オンオフ。 電子メール通知。 プチ通知 - オンオフ。 プッシュ通知。 次に、色域を調整します。
FX Volume MT5
Daniel Stein
4.94 (17)
mql5と Telegramの モーニング・ブリーフィングで、詳細とスクリーンショットを含む毎日のマーケット・アップデートをご覧 ください! FX Volumeは、ブローカーの視点から市場のセンチメントをリアルに洞察する、最初で唯一の出来高インジケーターです。 ブローカーのような機関投資家が外国為替市場でどのようなポジションをとっているか、COTレポートよりもはるかに速く、素晴らしい洞察を提供します。 この情報をチャート上で直接見ることは、あなたの取引にとって真のゲームチェンジャーであり、画期的なソリューションです。 以下のようなユニークなマーケットデータ洞察から利益を得てください。 比率は 、通貨のロングポジションとショートポジションの比率をパーセントで表示します。 比率の変化は 、選択した期間内のロング比率とその変化率を表示します。 Volumes Totalは 、通貨の取引量(ロングとショート)の合計をロット単位で表示します。 Volumes Long :全通貨のロングポジションの取引量を表示します。 Volumes(ショート )は、全通貨のショートポジションの取引量を表示
まず第一に、この取引ツールはノンリペイント、ノンリドロー、ノンラグの指標であり、プロの取引に理想的ですことを強調する価値があります。 スマートプライスアクションコンセプトインジケーターは、新米から経験豊富なトレーダーまで、非常 に強力なツールです。Inner Circle Trader AnalysisやSmart Money Concepts Trading Strategiesなど、20以上の有用な指標を1つに組み合わせています。このインジケーターはスマートマネーコンセプトに焦点を当て、大手機関の取引方法を提供し、彼らの動きを予測するのに役立ちます。 特に、流動性分析に優れており、機関がどのように取引しているかを理解しやすくしています。市場のトレンドを予測し、価格の動きを慎重に分析するのに優れています。機関の戦略とトレードを合わせることで、市場の動向についてより正確な予測ができます。このインジケーターは多目的であり、市場構造を分析し、重要な注文ブロックを特定し、さまざまなパターンを認識するのに優れています。 このインジケーターはBOSやCHoCHなどのパターンの識
現在33%オフ 初心者にもエキスパートトレーダーにも最適なソリューション このインジケーターは独自の機能と新しい公式を多数内蔵しており、ユニークで高品質かつ手頃な取引ツールです。このアップデートでは、2つの時間枠ゾーンを表示できるようになります。より長いTFだけでなく、チャートTFとより長いTF(ネストゾーンを表示)の両方を表示できます。すべてのSupply Demandトレーダーの皆さんのお気に召すはずです。:) 重要情報の公開 Advanced Supply Demandの可能性を最大化するには、 https://www.mql5.com/ja/blogs/post/720245 にアクセスしてください。   エントリーまたはターゲットの正確なトリガーポイントを正確に特定できれば取引がどのように改善されるか想像してみてください。新しい基盤となるアルゴリズムに基づいて構築されているため、買い手と売り手の間の潜在的な不均衡をさらに簡単に特定できます。これは、最も強い需要と供給のゾーンと、過去のパフォーマンス(古いゾーンを表示)がグラフィカルに表現されるためです。これらの機能は、最適
A key element in trading is zones or levels from which decisions to buy or sell a trading instrument are made. Despite attempts by major players to conceal their presence in the market, they inevitably leave traces. Our task was to learn how to identify these traces and interpret them correctly. Reversal First Impulse levels (RFI)   -  Version MT4                  INSTRUCTIONS                 RUS                 ENG                         R ecommended to use with an indicator   -  TREND PRO  
AW Trend Predictor MT5
AW Trading Software Limited
4.76 (55)
1 つのシステムでのトレンド レベルとブレイクダウン レベルの組み合わせ。高度なインジケーター アルゴリズムは、市場のノイズをフィルター処理し、トレンド、エントリー ポイント、および可能なエグジット レベルを決定します。インジケーターシグナルは統計モジュールに記録されるため、最適なツールを選択してシグナル履歴の有効性を示すことができます。この指標は、テイクプロフィットとストップロスのマークを計算します。 マニュアルと説明書 ->   ここ / MT4 バージョン ->   ここ インジケーターで取引する方法: Trend Predictor での取引は、たった 3 つの簡単なステップです。 ステップ 1 - ポジションを開く 70% 以上の成功率で買いシグナルが受信されました ステップ 2 - ストップロスの決定 逆信号でトランクを選択 ステップ 3 - テイクプロフィット戦略の定義 戦略 1: TP1 に到達したらポジション全体をクローズする 戦略 2: TP1 に達した時点でポジションの 50% をクローズし、TP2 に達した時点で残りの 50% をクローズします。 戦略 3:
TPSpro TRENDPRO  - is a trend indicator that automatically analyzes the market and provides information about the trend and each of its changes, as well as giving signals for entering trades without redrawing! The indicator uses each candle, analyzing them separately. referring to different impulses - up or down impulse. Exact entry points into transactions for currencies, crypto, metals, stocks, indices!  -  Version MT4                  DETAILED DESCRIPTION        /       TRADING SETUPS       
mql5と Telegramの モーニング・ブリーフィングで、詳細とスクリーンショットを含む毎日のマーケット・アップデートをご覧 ください! FX Power MT5 NGは 、長年の人気を誇る通貨強度計FX Powerの次世代モデルです。 この次世代ストレングスメーターは何を提供するのでしょうか?初代FXパワーの魅力すべて プラス GOLD/XAUの強さ分析 より正確な計算結果 個別に設定可能な分析期間 カスタマイズ可能な計算上限値により、さらに優れたパフォーマンスを実現 もっと見たい人のための特別なマルチインスタンス設定 すべてのチャートでお好みの色を無限に設定可能 数え切れないほどの通知オプションにより、重要なことを見逃すことはありません。 Windows 11とmacOSのスタイルで角を丸くした新しいデザイン 魔法のように動くインジケーターパネル FXパワーの主な機能 すべての主要通貨の強さの完全な履歴 すべての時間枠における通貨の強さの履歴 すべてのブローカーとチャートで同一の計算結果 100%信頼できるリアルタイム計算 -> リペイントなし ドロップダウン・リストから
これはMT5のインジケーターで、再描画なしで取引に参入するための正確なシグナルを提供します。 外国為替、暗号通貨、金属、株式、インデックスなど、あらゆる金融資産に適用できます。かなり正確な見積もりを提供し、取引を開始して終了するのに最適な時期を教えてくれます。1つのシグナルを処理しただけでインジケーターの元が取れた例の 動画 (6:22)をご覧ください。Entry PointsPro インジケーターの助けを借りたほとんどのトレーダーの最初の1週間の結果が改善しています。 Telegramグループ に登録してください。Entry Points Proインジケーターのメリットは次の通りです。 再描画のないエントリーシグナル 再描画されるインジケーターでは一度表示されたシグナルが削除されて大きな金銭的損失につながることがありますが、これと異なり、表示されて確認されたシグナルは消えることがありません。 エラーなしの取引開始 インジケーターアルゴリズムによって取引を開始する(資産を売買する)理想的な瞬間を見つけることができます。それを使用するすべてのトレーダーの成功率が向上します。
今、147ドル(いくつかの更新後に499ドルに増加します) - 無制限のアカウント(PCSまたはMac) RelicusRoad ユーザー マニュアル + トレーニング ビデオ + プライベート Discord グループへのアクセス + VIP ステータス 市場の新しい見方 RelicusRoad は、外国為替、先物、暗号通貨、株式、および指数の世界で最も強力な取引インジケーターであり、トレーダーに収益を維持するために必要なすべての情報とツールを提供します。初心者から上級者まで、すべてのトレーダーが成功するためのテクニカル分析と取引計画を提供します。これは、将来の市場を予測するのに十分な情報を提供する重要な取引指標です。意味をなさないチャート上のいくつかの異なる指標ではなく、完全な解決策を信じています.これは、信号、矢印 + 価格アクション情報を表示するオールインワンのインジケーターで、他に類を見ない非常に正確です。 強力な AI に基づいて、RelicusRoad は不足している情報とツールを提供して、あなたを教育し、トレーディングのプロ、成功したトレーダーにします。
Noize Absorption Index - is the manual trading system that measures the difference of pressure between bears forces and bulls forces. Green line - is a noize free index that showing curent situation. Zero value of index shows totally choppy/flat market.Values above zero level shows how powerfull bullish wave is and values below zero measures bearish forces.Up arrow appears on bearish market when it's ready to reverse, dn arrow appears on weak bullish market, as a result of reverse expectation.
Gartley Hunter Multi - An indicator for searching for harmonic patterns simultaneously on dozens of trading instruments and on all classic timeframes: (m1, m5, m15, m30, H1, H4, D1, Wk, Mn). Manual (Be sure to read before purchasing) | Version for MT4 Advantages 1. Patterns: Gartley, Butterfly, Shark, Crab. Bat, Alternate Bat, Deep Crab, Cypher 2. Simultaneous search for patterns on dozens of trading instruments and on all classic timeframes 3. Search for patterns of all possible sizes. Fr
ICT, SMC, SMART MONEY CONCEPTS, SMART MONEY, Smart Money Concept, Support and Resistance, Trend Analysis, Price Action, Market Structure, Order Blocks, BOS/CHoCH,   Breaker Blocks ,  Momentum Shift,   Supply&Demand Zone/Order Blocks , Strong Imbalance,   HH/LL/HL/LH,    Fair Value Gap, FVG,  Premium  &   Discount   Zones, Fibonacci Retracement, OTE, Buy Side Liquidity, Sell Side Liquidity, BSL/SSL Taken, Equal Highs & Lows, MTF Dashboard, Multiple Time Frame, BigBar, HTF OB, HTF Market Structure
Professional Scalping Tool on Deriv Attention! The indicator will be sold in limited quantities!!! The previous 5 copies were sold for $250 The next 5 copies will be sold for $350 The next price is $500 Description: This trading indicator is designed for professional traders focused on scalping. Designed with the market in mind, it provides highly accurate spike trading signals. It works on the M1 timeframe and supports the following symbols: Boom 300 Index, Boom 500 Index, Boom 1000 Index,
Was: $299  Now: $99   Supply Demand uses previous price action to identify potential imbalances between buyers and sellers. The key is to identify the better odds zones, not just the untouched ones. Blahtech Supply Demand indicator delivers functionality previously unavailable on any trading platform. This 4-in-1 indicator not only highlights the higher probability zones using a multi-criteria strength engine, but also combines it with multi-timeframe trend analysis, previously confirmed swings
The Volume by Price Indicator for MetaTrader 5 features Volume Profile and Market Profile TPO (Time Price Opportunity). Get valuable insights out of currencies, equities and commodities data. Gain an edge trading financial markets. Volume and TPO histogram bar and line charts. Volume Footprint charts. TPO letter and block marker charts including split structures. Versatile segmentation and compositing methods. Static, dynamic and flexible ranges with relative and/or absolute visualizations. Lay
MetaForecast M5
Vahidreza Heidar Gholami
5 (2)
MetaForecastは、価格データのハーモニクスに基づいて、どんな市場の未来を予測し視覚化します。市場が常に予測可能ではありませんが、価格にパターンがある場合、MetaForecastは可能な限り正確な未来を予測できます。他の類似製品と比較して、MetaForecastは市場のトレンドを分析することでより正確な結果を生成することができます。 入力パラメータ Past size (過去のサイズ) MetaForecastが将来の予測を生成するために使用するバーの数を指定します。モデルは選択したバー上に描かれた黄色の線で表されます。 Future size (将来のサイズ) 予測すべき将来のバーの数を指定します。予測された将来は、ピンクの線で表示され、その上に青い回帰線が描かれます。 Degree (程度) この入力は、MetaForecastが市場で行う分析のレベルを決定します。 Degree 説明  0 Degree 0の場合、価格の全てのピークや谷、そして詳細をカバーするために、「Past size」の入力に大きな値を使用することが推奨されています。  1 (推奨) Degr
Bill Williams Advanced is designed for automatic chart analysis using Bill Williams' "Profitunity" system. The indicator analyzes four timeframes at once. Manual (Be sure to read before purchasing) Advantages 1. Automatically analyzes the chart using the "Profitunity" system of Bill Williams. The found signals are placed in a table in the corner of the screen. 2. Equipped with a trend filter based on the Alligator indicator. Most of the system signals are recommended to be used only accordi
Auto Order Block with break of structure based on ICT and Smart Money Concepts Futures Break of Structure ( BoS )             Order block ( OB )            Higher time frame Order block / Point of Interest ( POI )    shown on current chart           Fair value Gap ( FVG ) / Imbalance   ,  MTF      ( Multi Time Frame )    Volume Imbalance     ,  MTF          vIMB Gap’s Equal High / Low’s     ,  MTF             EQH / EQL Liquidity               Current Day High / Low           HOD /
トレンド検出インジケーターはあらゆる戦略を補完し、独立したツールとしても使用できます。 インジケーターの操作に関する推奨事項、コメント   #8   でダウンロードできます 利点 使いやすく、不要な情報でチャートを過負荷にしません。 あらゆる戦略のフィルターとして使用できます。 利益を得るのとストップロスを設定するの両方に使用できる動的なサポートとレジスタンスのレベルが組み込まれています。 ローソク足が閉じた後、インジケーターの色は変わりません。  株式市場、指数、石油、金、およびすべての時間枠で機能します。 トースト通知、電子メール通知、プッシュ通知、サウンドアラートの機能があります。 私の他の開発はここで見つけることができます: https://www.mql5.com/ja/users/mechanic/seller 入力パラメータ Alert-オン/オフ。アラート; Push Notification-オン/オフ。プッシュ通知; Mail-オン/オフ電子メール通知; Fibo 1,2,3,4,5,6,7,11,21,31,41,51,61,71-動的サポートと抵抗
Quantum平均足PRO のご紹介 市場のトレンドに対する明確な洞察を提供するように設計された平均足キャンドルは、ノイズを除去し、誤ったシグナルを排除する能力で知られています。混乱を招く価格変動に別れを告げ、よりスムーズで信頼性の高いチャート表現を導入しましょう。 Quantum Heiken Ashi PRO を真にユニークなものにしているのは、従来のローソク足データを読みやすい色のバーに変換する革新的なフォーミュラです。赤と緑のバーはそれぞれ弱気トレンドと強気トレンドをエレガントに強調し、潜在的なエントリーポイントとエグジットポイントを驚くほど正確に見つけることができます。 量子EAチャネル:       ここをクリック MT4のバージョン:       ここをクリック この注目すべき指標には、いくつかの重要な利点があります。 明確性の向上: 価格変動を平滑化することで、平均足バーは市場トレンドをより明確に表現し、有利な取引機会を特定しやすくします。 ノイズの削減: 誤ったシグナルを引き起こすことが多い不安定な価格変動に別れを告げます。 Quantum Heik
ご紹介     Quantum Breakout PRO は 、ブレイクアウト ゾーンの取引方法を変革する画期的な MQL5 インジケーターです。 13年以上の取引経験を持つ経験豊富なトレーダーのチームによって開発されました。     クォンタム ブレイクアウト プロ   は、革新的でダイナミックなブレイクアウト ゾーン戦略により、あなたのトレーディングの旅を新たな高みに押し上げるように設計されています。 クォンタム ブレイクアウト インジケーターは、5 つの利益ターゲット ゾーンを備えたブレイクアウト ゾーン上のシグナル矢印と、ブレイクアウト ボックスに基づいたストップロスの提案を提供します。 初心者トレーダーにもプロのトレーダーにも適しています。 量子EAチャネル:       ここをクリック 重要!購入後、インストールマニュアルを受け取るためにプライベートメッセージを送ってください。 推奨事項: 時間枠: M15 通貨ペア: GBPJPY、EURJPY、USDJPY、NZDUSD、XAUUSD アカウントの種類: ECN、Raw、またはス
Step into the realm of Forex trading with confidence and precision using XQ, a cutting-edge Forex indicator designed to elevate your trading game to unprecedented heights. Whether you're a seasoned trader or just stepping into the world of currency exchange, XQ Forex Indicator empowers you with the insights and signals needed to make informed trading decisions. The signal conditions are a combination of three indicators, and XQ Forex Indicator only display  medium and long-term trends . The ind
MT4版  |  FAQ Owl Smart Levels Indicator は、 Bill Williams の高度なフラクタル、市場の正しい波構造を構築する Valable ZigZag、エントリの正確なレベルをマークする Fibonacci レベルなどの一般的な市場分析ツールを含む 1 つのインジケーター内の完全な取引システムです。 利益を得るために市場と場所に。 戦略の詳細な説明 インジケータを操作するための指示 顧問-取引助手 プライベートユーザーチャット ->購入後に私に書いて、私はプライベートチャットにあなたを追加し、あなたはそこにすべてのボーナスをダウンロードすることができます 力はシンプルさにあります! Owl Smart Levels 取引システムは非常に使いやすいので、専門家にも、市場を勉強し始めて自分で取引戦略を選択し始めたばかりの人にも適しています。 戦略と指標に秘密の数式や計算方法が隠されているわけではなく、すべての戦略指標は公開されています。 Owl Smart Levels を使用すると、取引を開始するためのシグナルをすばやく確認し、注文を出すため
ENG-GOLD Scalper It is an auxiliary indicator that identifies potential targets and determines the place of entry with a stop loss that works on Heiken Ashi candles  The green lines are usually the targets, the red lines are the stop loss, and the yellow lines are the entry location.  This file is recognized on small and medium frames, usually less than the watch frame I highly recommend using XAUUSD US100 US30 USOIL 
まず最初に、このトレーディングシステムがリペイントされず、再描画されず、遅延しないことを強調する価値があります。これにより、プロのトレーディングに最適な状態になります。 「スマートサポートアンドレジスタンストレーディングシステム」は、新規および経験豊富なトレーダー向けにカスタマイズされた高度なインジケーターです。この包括的なシステムは、7以上の戦略、10のインジケーター、およびデイトレード戦略、スイングトレード戦略、サポートおよびレジスタンス戦略、ローソク足パターン戦略、VWAP戦略、マルチタイムフレームトレンド戦略など、さまざまなトレーディングアプローチを組み合わせています。これは、矢印信号、エントリーポイント、出口ポイント、トレードアラート、より高い時間枠のトレンド分析、リアルタイムのトレードモニタリング、そして洞察力のあるトレンドとボリュームキャンドルの着色を提供します。自動的なサポートとレジスタンスの検出により、さまざまな市況下でトレーダーが的確な決定を下すのを支援する多面的なインジケーターとなっています。 スマートサポートアンドレジスタンストレーディングシステムは、
作者のその他のプロダクト
Little Hanzel
Bonginkosi Innocent Khumalo
Little Hanzel is  t he best spike Detector,  the  indicator is  made for trading Boom and Crash using the 1 min timeframe.It use levels on the 1 min timeframe to detect spikes.A horizontal line(order level) will appear on all the buying levels for on Boom and selling level, horizontal line will also appear on Crash. Join mql5 Little Hanzel channel  https://www.mql5.com/en/channels/littlehanzel Input section: Choose Boom for the Boom indices (Boom 1000, Boom 500,and  Boom 300 ) Choose Crash for t
TransitTrendlines
Bonginkosi Innocent Khumalo
TransitTrendlines this is a automatically trendline drawer, it draw both horizontal and diagonal trendlines. The horizontal trendlines are the pivot points of the day timeframe and the diagonal trendlines are based on the current time frames. You can adjust the diagonal trendlines by increasing the number of bars to draw the diagonal trendline and can also adjust the steepness. Note that the Horizontal trendlines are based on the day pivot points not currant time frame. Join mql5 transitbk98 cha
FREE
Mafia Spikes
Bonginkosi Innocent Khumalo
MAFIA Spikes Mafia is an indicator that is made to detect spikes before they occur , a signal will be given few minutes before a spike. An outstanding Boom & Crash strategy is coded into this indicator system to perfectly give amazing signals for spikes. When using this indicator system you gonna feel like you are a MAFIA of spikes, king of spikes.   This indicator is made for trading  Boom and Crash indices only, on a 1 minute timeframe only. Mafia Spikes can also sand signals to your smartphon
TransitGhost
Bonginkosi Innocent Khumalo
5 (1)
TransitGhost Signal indicator, this is one of my best forex trading strategy. The strategy is based on the simple moving average cross, 5 SMA AND 200 SMA of which take a longer time to cross. Whenever the is a cross between the 5 SMA and 200 SMA a signal will be given, when the 5 SMA cross the 200 SMA to the upside ,a buying arrow will appear on chart, and push notification(alert) "Buy now, use proper risk management" will be sent on both the MT5 PC and mobile app, and when the 5 SMA cross the 2
FREE
TWallPaper
Bonginkosi Innocent Khumalo
1 (1)
T-Wallpaper. This is a very useful wallpaper that comes with trade manager panel. You can choose any wallpaper of your choice. Must add the WallPaper file to your MQL5 Data Folder. Follow this easy steps: Download the WallPaper files from our channel  https://www.mql5.com/en/channels/transitbk98 Open MT5 Select files Open Data Folder Open MQL5 Open Files and past the Wallpaper folder Now the wallpaper will display. Wallpaper settings are found on the user input. Trade panel settings are found on
FREE
Transit2Trendlines
Bonginkosi Innocent Khumalo
Transit2Trendline this indicator system is made to reduce the job of analyzing and to help those who can't or don't know how to draw trendlines.Transit 2 Trendlines draws only two important trendlines, support and resistance. The diagonal support is drawn in red color .The diagonal resistance is drawn in green color. Note this are very important trendlines which can easily be traded with the classic strategy of trendlines, breakout and retest. The Transit 2 Trendlines will draw patterns selected
TransitX1
Bonginkosi Innocent Khumalo
TransitX1 indicator is very useful, with unlimited signals and works on all the timeframes and all the piers. TransitX1 draws two trend lines very short trendlines (+/-20 bars) which can be considered as support and resistance. The support is in red trendline and the resistance is in green trendline. TransitX1 gives buying and selling signals, with only 3 being previous signals and the 4th one being the current signal. Buying signals are in green arrows and are always on the support trendline an
TransitBlueOcean
Bonginkosi Innocent Khumalo
5 (1)
TransitBlueOcean is indicator system that uses ocean wave's pattern, to help one to know when to buy and when to sell. The indicator system is very powerful like the ocean waves. Join the mql5 channel for TransitBlueOcean  https://www.mql5.com/en/channels/transitblueocean   How to use: Zoom in so that the Ocean will appear on your chart. Buy when you see the candles, the candle will be above the ocean wave (buying signal). Sell when you can't see the candles, the candles will be inside the w
TransitHazard
Bonginkosi Innocent Khumalo
TransitHazard is a trading indicator system's that use one of the best trading strategy. The indicator system have input options so that you can adjust or set the strategy to work the way you would like by allowing you to set the period and other adjusting set inputs and the indicator system has color settings to set your own preferred colors. Works on all the time frames and on all the pairs. Green colored candles give a buying signal and an alert after one bar will be given so that you don't m
TransitKiller
Bonginkosi Innocent Khumalo
A Metatrade 5 technical Indicator made of the best trading strategy, very easy to use and to understand. Providing  good and reliable signals for scalping and  swing trading. Always killing the shower on any pair , whether currency’s, stock’s, index, community , Deriv synthetics and many more. TransitKiller is a very useful technical indicator system, that analyze the market using a unique technical strategy so that it can give accurate signal’s for buying or selling , and the bull’s and bear po
Candlestick Bar
Bonginkosi Innocent Khumalo
Candlestick bar, you can call it  Candlestick Scalping Beast(CBS).  This indicator is made specifically for scalping. The strategy on the indicator is that it gives signal on the close of a candle following this rule, if the close of the candle/bar is high then the previous candle/bar ,then it is a buying signal (up-trend),a green arrow and if the close of the candle/bar is lower than the previous candle/bar , then it is a selling signal (Downtrend), a red arrow. And the ATR is a secrete recipe
フィルタ:
レビューなし
レビューに返信
バージョン 1.2 2023.03.05
Now you can receive signals different language of your choice and it talks.
The 10 different languages, allowing the WPS to give signals in variety of languages.
The WPS can now tell you to buy or sell(talk) and sand text signals in the following languages:
English
Sepedi
isiZulu
Tshivenda
XiTsonga
Afrikaans
French
Spanish
Portuguese
Russian
Note: To properly here the WPS talk ,you need to turn of the alert sound ,or set it to none ,Therefor the WPS will let when to buy or sell using the above languages.
バージョン 1.1 2023.01.04
Wallpaper
Icon
Signals sand to the mobile app and email.