Multi Currency Trend Strength Indicator Basic

3.25

Are you tired of having many open charts and watching many different currency pairs? M‌CTSI will monitor the strengths of 56 currency pairs and show you the best pairs to trade, no more guessing which currency is stronger/weaker, no more trading a pair that is not moving positively.

This is the BASIC version. MCTSIP is the more advanced version and can be found here: https://www.mql5.com/en/market/product/20994

You may have many charts open trying to determine the best currency pair to trade on may timeframes, ‌M‌CTSIP can monitor currency strengths on a different timeframe to the current timeframe.

This is a essential tool in manual trading and gives the trader a advantage knowing how strong a currency really is.

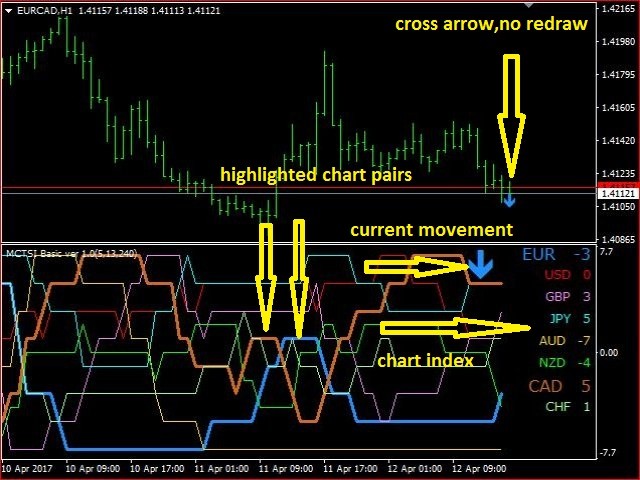
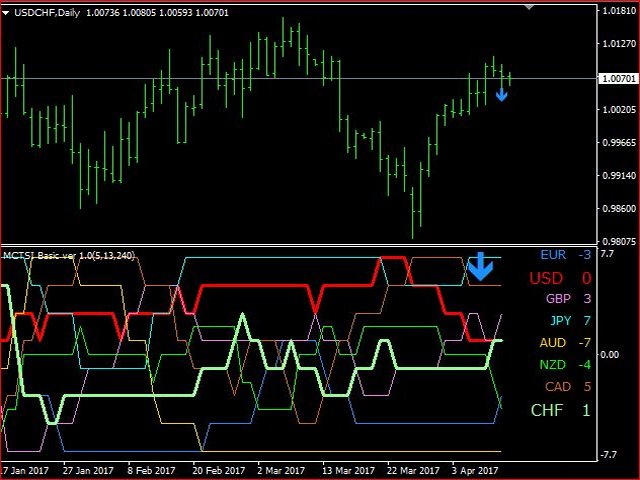
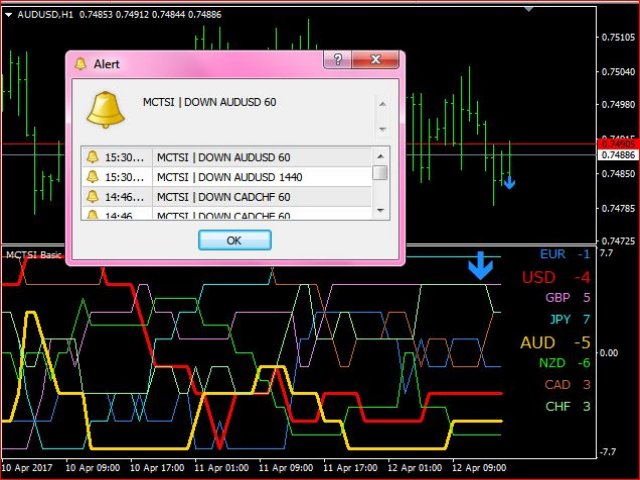
  • MCTSI monitors the strengths of the following currencies : EUR, USD, GBP, JPY, AUD, NZD, CAD, CHF.
  • Each currency's movement is measured against 7 other currencies to determine the strength.
  • This is shown in the indicator window for each currency, and will show the strongest to weakest currency.

The sensitivity can be adjusted by changing the MA values to make the indicator more or less sensitive to currency movements, and so customized to the time frame you are trading on.

Note: the indicator may not show correctly in the strategy tester, as it has to process large amounts of history data for each pair.


Technical

This indicator shows multiple individual currencies strengths as measured against all the other currencies. It measures the price movements of the applied chart currency pair comparing the base and counter currency occurring in all the other base/counter currencies and shows the strength movements. The rate of change or rate of change strength is shown and can be adjusted for sensitivity by the Moving Average numbers.


Features

  • Monitor EUR USD GBP JPY AUD NZD CAD CHF.
  • Individual currency strengths data, basic version (1-7)
  • Applied chart movement arrows, no redraw.
  • Alerting capability.
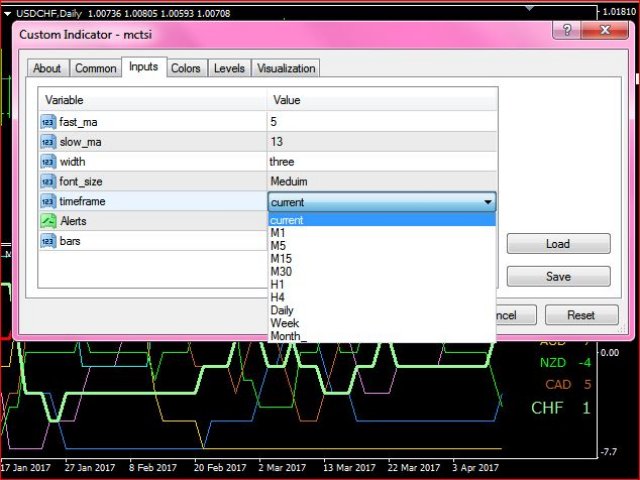
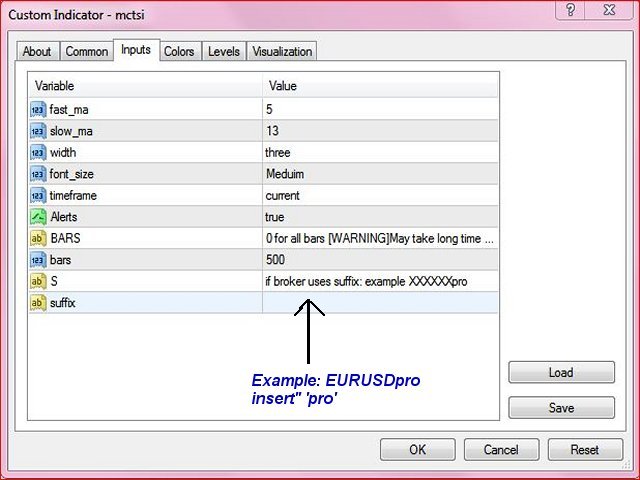

Inputs (default)

  • fast_ma = 5: fast Moving Average, always setting this input lower than [slow ] input.

  • slow_ma = 13: slow Moving Average, always setting this input higher than [fast] input.

    Note: adjusting the fast and slow inputs will make the currency strengths more sensitive to price movements.

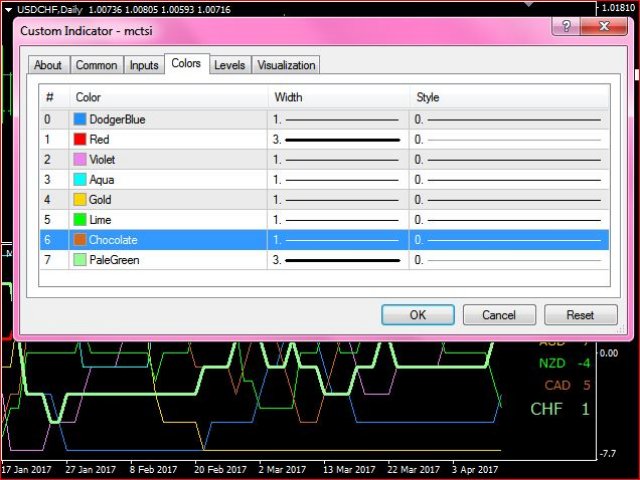
  • width = 3: size of the chart pairs highlighted lines, setting this to 0 will remove the highlighted lines (all lines will be same size).

  • font_size = 12: size of the chart pairs index currency, setting this to 0 (zero) will make all the index text the same size.

  • timeframe = current: timeframe, 0 (current) will use the chart timeframe.

  • Alerts = true: if set to true, this will send a alert only to the trading terminal if the current chart strength has changed up/down.

  • bars = 500: the amount of bars the indicator will process and show.

    Note: setting this input to 0 (zero) will process ALL the bars in the chart and can take a long time due to the amount of data to process.

  • suffix: if broker uses suffix: example XXXXXXpro.
レビュー 5
sunnychow
9043
sunnychow 2018.11.10 17:33 
 

Good tools

おすすめのプロダクト
Limited-time free initial release. Currency Strength Heatmap MT4 is free while MetaCoderStore collects real trader feedback. Please leave a comment with broker suffixes, currency sets, dashboard requests, alerts, or scanner behavior you want prioritized. Currency Strength Heatmap MT4 compares EUR, USD, GBP, JPY, CHF, CAD, AUD, and NZD across the 28 major FX crosses on the current chart timeframe. It turns relative currency movement into clean strength lines so traders can quickly see strong-vers
FREE
Graph shows your balance and equity in real time similar to the tester graph which is nice to see your real progress vs tester graph. This code was copied from mql5.com, it is free and it works i am just putting it here to make it easier for us https://www.mql5.com/en/code/13242 https://www.mql5.com/en/code/8454 .. original code Equity Monitor  1. Monitoring balance 2. equity 3. margin 4. profitability 5. drawdown  Original idea and code by Xupypr (Igor Korepin)         Remake by transcendreame
FREE
FFx Bulls Power
Eric Venturi-Bloxs
3.67 (3)
The purpose of this new version of the MT4 standard indicator provided in your platform is to display in a sub-window multiple timeframes of the same indicator. See the example shown in the picture below. But the display isn’t like a simple MTF indicator. This is the real display of the indicator on its timeframe. Here's the options available in the FFx indicator: Select the timeframes to be displayed (M1 to Monthly) Define the width (number of bars) for each timeframe box Alert pop up/sound/ema
FREE
RenkoVPEurUsd
Kourosh Hossein Davallou
5 (1)
Of course. Here is the product description for "RenkoVP for MetaTrader 4 RenkoVP for MetaTrader 4 (EURUSD Only) RenkoVP is a powerful, fully online Renko-based indicator designed specifically for analyzing the EURUSD currency pair. It provides traders with a clean, noise-free view of market structure by combining traditional Renko bricks with advanced volume profile analysis, dynamic Fibonacci tools, and automatic pattern recognition—all without the need for problematic offline charts. Core F
FREE
***IMPORTANT:  This free indicator works with the paid for Strong Weak Forex Expert Advisor. The EA also depends on the following custom indicators: Strong Weak Parabolic Strong Weak Symbols Strong Weak Values Strong Weak Indicator Download them for free in the Market. The EA will not work without it. These are all custom indicators which the Strong Weak Forex Expert Advisor relies on to generate trading signals. If you have any problems with installation send me a message.
FREE
Trend Mate
ANGEL CALLE CRUZ
1 (1)
TREND MATE is an useful indicator that will support your decision to trade according to the current trend. It is possible to configure alert and push notification to receive when entering to first candle for bull / bear trend. If you want to use this indicator for a EA, use the function iCustom as follows: DOWNTREND : iCustom(NULL,0,"Trend_Mate",0,0) . If downtrend result is "1", otherwise is "0". UPTREND : iCustom(NULL,0,"Trend_Mate",1,0) . If uptrend result is "1", otherwise is "0". For an
FREE
Tester Periods is the useful indicator for visual strategy tester which extend chart periods. Its  designed for the trading utility  Trade Shell  (included   Trade Shell SMC ). Run the Trade Shell on the visual tester. Then put the Tester Periods indicator on the chart. If you wanna see timeframes M1, M5, M10, M15 , for example, then you have to run visual tester on M1 and to define multipliers like that: TimeFrame_Periods_Multiplier = 1,5,10,15 If you wanna see timeframes M5, M20, M30, H1, for
FREE
FFx Bears Power
Eric Venturi-Bloxs
5 (1)
The purpose of this new version of the MT4 standard indicator provided in your platform is to display in a sub-window multiple timeframes of the same indicator. See the example shown in the picture below. But the display isn’t like a simple MTF indicator. This is the real display of the indicator on its timeframe. Here's the options available in the FFx indicator: Select the timeframes to be displayed (M1 to Monthly) Define the width (number of bars) for each timeframe box Alert pop up/sound/ema
FREE
FFx RVI
Eric Venturi-Bloxs
5 (1)
The purpose of this new version of the MT4 standard indicator provided in your platform is to display in a sub-window multiple timeframes of the same indicator. See the example shown in the picture below. But the display isn’t like a simple MTF indicator. This is the real display of the indicator on its timeframe. Here's the options available in the FFx indicator: Select the timeframes to be displayed (M1 to Monthly) Define the width (number of bars) for each timeframe box Alert pop up/sound/ema
FREE
This Dashboard is free to download but is dependent on you owning the Gold Pro MT4   indicator.  Get the indicator here:  https://www.mql5.com/en/market/product/60430 The   Dashboard    will show you on a single chart all the timeframes (M1 to Monthly) with their own status for the indicator: Gold Pro MT4   all time frame and all symbol:  smart algorithm detects the trend, filters out market noise and gives entry signals!!! How to understand the status: Dashboard Show "Buy" - Buy Signal Das
FREE
LineBreakMT4
Nattadecha Tangpakinwat
Key Features: Type of Indicator: Line Break Chart Indicator Usage: Identifying trend reversals and potential market turning points. Input Parameters: The primary input parameter is 'Lines_Break,' which represents the number of lines the price needs to move to create a new line in the opposite direction. How it works: The indicator draws green and red histogram bars to represent the line break chart. Green bars indicate an upward trend, and red bars indicate a downward trend. The indicator calcul
FREE
MACD Trend FREE
Vojtech Svobodnik
5 (1)
MACD Trend FREE is Expert Advisor for EURJPY  based on MACD Indicator . You can completely edit settings of MACD Indicator, TakeProfit, StopLoss and TrailingStop. Default paramters are optimized for best results. But you can test other settings for antoher currency pairs or timeframe. MACD Trend FREE  has been tested from year 2003 to 2021 . My test used the real tick data with 99,90% accuracy. Doesn't use Martingale or other dangerous strategies.  Recommendations Symbol:   EURJPY Timeframe:  
FREE
Running multiple EA's on your account and confused by who's winning and who's loosing? Try this indicator that report's in real time on the Magic Numbers in your account by reading the History_trades along with the Open_trades. Note: Manual trades are grouped under Magic Number "0". For a better visual report,  run it on a symbol that you don't execute trades on, switch the history bars to "Line Charts" and set it's color to Black.
FREE
FFx DeMarker
Eric Venturi-Bloxs
5 (2)
The purpose of this new version of the MT4 standard indicator provided in your platform is to display in a sub-window multiple timeframes of the same indicator. See the example shown in the picture below. But the display isn’t like a simple MTF indicator. This is the real display of the indicator on its timeframe. Here's the options available in the FFx indicator: Select the timeframes to be displayed (M1 to Monthly) Define the width (number of bars) for each timeframe box Alert pop up/sound/ema
FREE
Limited-time free release: Kernel Regression Envelope Signals MT4 is published free while MetaCoderStore collects trader feedback, comments, and feature requests. Kernel Regression Envelope Signals draws a causal, non-repainting Nadaraya-Watson style regression centerline with adaptive upper and lower envelopes, then marks stretched-band reclaims and rejections. Use cases Find smooth dynamic support and resistance around current price action. Spot lower-band reclaim and upper-band rejection setu
FREE
The purpose of this new version of the MT4 standard indicator provided in your platform is to display in a sub-window multiple timeframes of the same indicator. See the example shown in the picture below. But the display isn’t like a simple MTF indicator. This is the real display of the indicator on its timeframe. Here's the options available in the FFx indicator: Select the timeframes to be displayed (M1 to Monthly) Define the width (number of bars) for each timeframe box Alert pop up/sound/ema
FREE
The popular "SuperTrend" indicator is a technical analysis tool designed to help identify trend direction and potential entry or exit points in financial markets. This indicator is built upon the Average True Range (ATR) , which gauges market volatility based on price ranges. It is available for free on other platforms, and this should be no exception! Common Use Cases The SuperTrend is typically utilized in three primary ways: Trend Identification: When the price is trading above the indicator
FREE
Lucky Forex Stats Lucky Forex Stats Allow users to See all Account data on their Chart, you can choose any time period and it'll show you full account details with ratio, and each pair has individual details! Advantages You can choose any time period and it'll display all detail. You can see your whole accounts details, the profit and loss with exact $figure and ratio as well. Each pair shows the profit they've earned or lose, The winning and losing trades Winning VS losing % and many more P
FREE
Attention, for the indicator to work correctly, you need to put the "MQL5" folder in your terminal folder, you can download it from the link below: https://disk.yandex.ru/d/DPyo0ntaevi_2A One of the best arrow indicators for Binary Options, which can also be used in the Forex market. Any time frame from M1 to MN, any currency pair, can also be used on stocks - the indicator is universal. Expiration from 1 to 5 candles. Displays traffic statistics on a graph. The indicator gives signals along th
FREE
Indicator measures strength of each currency in your list. Main idea: It simply iterates through all combinations of pairs and adds difference between open and close in percent. Parameters: List of currencies - what currencies will be calculated (maximum is 8) Calculation type - from which data will be strength calculated Calculation data input - used as input related to calculation type Symbol suffix - used in case of suffix on symbols, e.g: when your symbols look like EURUSDm, EURUSDmicro etc
FREE
R シルバー トレンド インジケーターは、Metatrader 4 アクティビティ チャートに現在のトレンドを直接表示するトレンド フォロー型取引インジケーターです。 2 種類のろうそくを描画します。 青は強気の値動きです。 弱気の価格変動の場合は赤。 R シルバー トレンド インジケーターを使用した取引は、まったくの初心者でも非常に簡単で、スキャルピング (M1、M5)、デイ トレード (M5、M15、M30)、スイング トレード (H1、H4、D1) の通貨に使用できます。 基本的な取引シグナル R シルバー トレンド インジケーターのシグナルは解釈しやすく、次のようになります。 買いシグナル: インジケーターがチャート上に青いろうそくを描いたときに買いポジションを開きます. 売りシグナル: インジケーターがチャート上に赤いろうそくを描いたときに売りポジションを開きます. 取引の終了: 反対のシグナルが表示されたら、開いている取引を終了するか、独自の取引終了方法を使用します。 ヒント R シルバー トレンド インジケーターを使用して下落して売る戦略をトレードするには
FREE
Free informative Indicator-helper. It'll be usefull for traders who trade many symbols or using grid systems (Averaging or Martingale). Indicator counts drawdown as percent and currency separate. It has a number of settings: Count deposite drawdown according equity value and send e-mail or notifications to user if DD more than set; Sending e-mail when max open orders reached; Shows price and remaining pips amount before MarginCall on current chart and Account generally; Display summary trade lot
FREE
The Free  Pin Bar MT4  indicator  identifies Pin Bars  It will even give you sound or email alerts if want them. If you download it and like it please leave a review! It would be wonderful Pin Bars are purely based on price action as reflected by the candle formations created by Forex price movements. input Parameters are maximum allowed body/length ratio for the Nose bar. Nose body should be position in top (bottom for bearish pattern) part of the Nose bar.  tells the indicator that the Left Ey
FREE
Close Manager MT4
Biswarup Banerjee
4.5 (2)
Ea CloseManager MT4を紹介します。これは、MetaTrader 4向けに設計された専門的なExpert Advisor(EA)で、取引のクローズプロセスを簡素化し、自動化するためのものです。この強力なツールは、手動および自動取引戦略の両方に利益をもたらし、出口基準を正確に制御することで、さまざまな専門知識レベルのトレーダーに最適です。 MQL製品のインストールガイド | MT4/MT5で購入したMQL製品の更新 | 一般的なトラブルシューティングガイド | 一般設定 / 入力ガイド | バックテストとセットファイル Ea CloseManager MT4を使用することで、ユーザーは取引管理において大幅な時間の節約とリスク管理の向上を体験します。このEAを利用するトレーダーは、特にforex、インデックス、暗号通貨において、迅速な市場状況に適応した規律ある出口戦略を通じて、収益性の向上を報告しています。 MQL製品のインストールガイド | MT4/MT5で購入したMQL製品の更新 | 一般的なトラブルシューティングガイド | 一般設定 / 入力ガイド | バックテストと
FREE
The Comparison indicator can be used as an independent trading system. It is based on the idea that some currency pairs follow each other. The indicator allows you to simultaneously display another chart on the chart of one currency pair, which allows you to anticipate some movements and quite accurately determine the beginning of trends. The principle of trading by indicator signals is also simple: a currency pair, the chart of which is above, should be sold, and the one below, should be boug
Average Session Range MT4: Calculate and Average the Sessions High-Low Range of Specific Time Sessions Over Multiple Days. The Session Average Range is a sophisticated and precise tool designed to calculate the volatility of specific time sessions within the trading day. By meticulously analyzing the range between the high and low prices of a defined trading session over multiple days, this tool provides traders with a clear and actionable average range. **Note:** When the trading platform is cl
FREE
The indicator still has a few bugs but is ready for testing. This is my first indicator that determines entry and exit points. The entry point is based on breaking the peaks determined by a channel indicating highs and lows (invisible channels). TP1 is a probable target at which most positions can be closed. The channel determining the opening and closing of positions is based on different assumptions. The red stop loss line is determined based on lows and highs. The stop loss can be adjusted a
FREE
FFx Ichimoku
Eric Venturi-Bloxs
4.5 (4)
The purpose of this new version of the MT4 standard indicator provided in your platform is to display in a sub-window multiple timeframes of the same indicator. See the example shown in the picture below. But the display isn’t like a simple MTF indicator. This is the real display of the indicator on its timeframe. Here's the options available in the FFx indicator: Select the timeframes to be displayed (M1 to Monthly) Define the width (number of bars) for each timeframe box Alert pop up/sound/ema
FREE
Secured Profits – 本当に確保された利益を即座に表示 各取引で実際にどれだけの利益を保護しているかご存知ですか? Secured Profits は、保有中のポジションに基づき、ストップロスによって 実際に確保された利益 の金額をリアルタイムで表示する、MT4用のスマートで強力なインジケーターです。 他のツールと異なり、 Secured Profits は単に「見えている」浮動利益やストップで守られている利益を合計するだけではありません。すべてのポジションを 総合的に比較 し、実際に守られている金額を計算します。たとえば、1つのポジションで $10 利益が確保されていても、他のポジションが -$5 のリスクを抱えていれば、実際に確保されているのは $5 だけであり、それが画面に表示される金額です。 主な特徴: すべての未決済ポジションのストップロスを考慮し、 本当に確保された利益 を表示 誤った安心感を排除 し、未保護のリスクを含めた後に残る本当の保護額のみを表示 デフォルトで左下に表示される カスタマイズ可能なラベル をチャート上に表示
FREE
The Stock Exchange One Sessions Hours version 2.00 This indicator facilitates observing the currency pair's quotations during subsequent parts of the stock exchange session live. Before the session starts, a rectangle is drawn on the chart but not filled in with color. It means the extent of the session duration. Before the first bar enters the rectangle of the session, a sound signal or pop-up window will notify us that the session will just start. When the price graph crosses the edge of the
FREE
このプロダクトを購入した人は以下も購入しています
Neuro Poseidon is a new indicator by Daria Rezueva. It combines precise trading signals with adaptive TP/SL levels - creating best possible trades as a result! Message me and get  Neuro Poseidon Assistant  as a gift to automize your trading process! What makes it stand out? 1. Proven profitability on all assets and timeframes 2. Only confirmed BUY and SELL signals present on the chart 3. Adaptive TP & SL levels generated by the software for each trade 4. Easy to understand - suitable for all
Gann Made Easy は、ミスター・ギャンの理論を使用した取引の最良の原則に基づいた、プロフェッショナルで使いやすい外国為替取引システムです。 W・D・ガン。このインジケーターは、ストップロスとテイクプロフィットレベルを含む正確な買いと売りのシグナルを提供します。 PUSH通知を利用して外出先でも取引可能です。 ご購入後、取引方法の説明と優れた追加インジケーターを無料で入手するには、私にご連絡ください! おそらく、ギャンの取引手法についてはすでに何度も聞いたことがあるでしょう。通常、ギャンの理論は初心者のトレーダーだけでなく、すでにある程度の取引経験がある人にとっても非常に複雑なものです。なぜなら、ギャンの取引手法は理論的にはそれほど簡単に適用できるものではないからです。私はその知識を磨き、最良の原則を私の外国為替インジケーターに組み込むために数年を費やしました。 このインジケーターは非常に簡単に適用できます。必要なのは、それをチャートに添付し、簡単な取引推奨事項に従うだけです。このインジケーターは常に市場分析の仕事を行い、取引の機会を探します。適切なエントリーポイントを検出す
M1 SNIPER は使いやすいトレーディングインジケーターシステムです。M1時間足向けに設計された矢印インジケーターです。M1時間足でのスキャルピングのためのスタンドアロンシステムとして、また既存のトレーディングシステムの一部としても使用できます。このトレーディングシステムはM1時間足での取引に特化して設計されていますが、他の時間足でも使用できます。元々、この手法はXAUUSDとBTCUSDの取引用に設計しましたが、他の市場においても役立つと考えています。 インジケーターのシグナルは、トレンドの方向と逆方向に取引できます。インジケーターのシグナルを利用して両方向に取引するのに役立つ特別な取引テクニックをご紹介します。この手法は、特別な動的なサポートとレジスタンスの価格帯を利用することに基づいています。 ご購入後、M1 SNIPER矢印インジケーターをすぐにダウンロードできます。さらに、M1 SNIPERツールのすべてのユーザーに、以下のスクリーンショットに表示されているApollo Dynamic SRインジケーターを無料で提供しています。この2つのインジケーターを組み合わせることで
Trend Catcher ind
Ramil Minniakhmetov
5 (2)
トレンドキャッチャーインジケーター トレンドキャッチャーインジケーターは、開発者独自の適応型トレンド分析指標を組み合わせることで、市場価格の動きを分析します。短期的なノイズを除去し、根底にあるモメンタムの強さ、ボラティリティの拡大、価格構造の挙動に焦点を当てることで、真の市場方向性を特定します。また、移動平均線、RSI、ボラティリティフィルターなどの平滑化およびトレンドフィルタリング機能を備えたカスタマイズ指標も使用します。 実際の運用状況のモニタリングやその他の製品については、こちらをご覧ください: https://www.mql5.com/en/users/mechanic/seller ご注意ください。私はTelegramでEAや設定を販売していません。詐欺です。すべての設定はブログで無料で公開しています。 重要!ご購入後すぐにご連絡ください。手順とボーナスをお送りします!
このインジケーターは実践的なトレードに最適な自動波動分析のインジケーターです! 場合... 注:   Tang Lun (Tang Zhong Shuo Zen) の命名規則の影響で、私は波のグレーディングに西洋の名前を使用することに慣れていません。基本的な波を ペン 、二次波のバンドを セグメント と名付けました。同時に、 セグメント にはトレンドの方向が指定されます (この命名方法は将来のノートで使用されます。最初に言っておきます)。ただし、アルゴリズムは曲がりくねった理論とはほとんど関係がないため、付けるべきではありません。これは、私の市場分析 によって要約された、絶えず変化する複雑な運用ルール を反映しています。 バンドは標準化され、人によって異なることがないよう定義されており、市場参入を厳密に分析する上で重要な役割を果たす人為的な干渉の描画方法が排除されています。 このインジケーターを使用することは、取引インターフェイスの美しさを改善することと同等であり、元の K ライン取引を放棄し、取引の新しいレベルに連れて行きます。また、宣伝の観点から顧客の認識も向上します。 イ
Scalper Inside PRO Scalper Inside PRO は、MetaTrader 4 向けの短期トレンドおよびスキャルピング用インジケーターです。独自アルゴリズムを用いて、市場の方向性と主要なターゲットレベルを素早く検出します。エントリー、イグジット、複数の利確ターゲットを自動計算し、詳細なパフォーマンス統計を表示することで、さまざまな銘柄やストラテジーがどのように機能してきたかを確認できます。これにより、現在のマーケットコンディションに最も適した取引銘柄を選択するのに役立ちます。さらに、Scalper Inside PRO には、お使いの矢印インジケーターを簡単に接続でき、その統計と過去のパフォーマンスを素早く評価できます。 本インジケーターは、あらゆる銘柄と時間足で動作し(短期トレードには M5 を推奨)、複数の内蔵ストラテジーを備えています。そのため、単体のスキャルピングツールとしても、トレーディングシステム内の強力な分析コンポーネントとしても活用できます。 主な機能 独自アルゴリズム(Next‑Generation Trend Detection Algor
Trend Breakout Arrows Indicator The Trend Breakout Arrows Indicator is a momentum-based signal tool designed to identify potential bullish and bearish breakout opportunities. It displays clear arrow signals directly on the price chart, helping traders quickly recognize possible trend changes and continuation setups. Up Arrow (Buy Signal) A magenta up arrow appears below a candle when bullish momentum begins to strengthen. This signal indicates that buying pressure may be overtaking selling press
PRO Renko Systemは、特別にRENKOチャートを取引するために設計された高精度の取引システムです。 これは、様々な取引商品に適用することができる普遍的なシステムです。 システムは効果的に正確な逆転信号へのアクセスを与えるいわゆる市場の騒音を中和する。 表示器は非常に使いやすく、信号の生成に責任がある1つの変数だけがあります。 あなたは簡単にお好みの任意の取引ツールとレンコバーのサイズにツールを適応させることができます。 私はいつもあなたが私のソフトウェアで収益性の高い取引を支援するために余分なサポートを提供する準備ができています! 私はあなたに幸せで収益性の高い取引をしたいです! ご購入後にご連絡ください! 私はあなたに私のレンコチャートジェネレータを送信します。 私はまた、私の個人的な推奨事項やシステムの他のモジュールを無料で共有します!
Current event:  https://c.mql5.com/1/326/A2SR2025_NoMusic.gif A. A2SR とは何ですか ?   * 先行テクニカル指標です (塗り直しなし、ラグなし)。 -- ガイダンス : -- https://www.mql5.com/en/blogs/post/734748/page4#comment_16532516 -- そして https://www.mql5.com/en/users/yohana/blog A2SR には、サポート (需要) とレジスタンス (供給) のレベルを決定する特別な手法があります。 ネットで見かける通常の方法とは異なり、A2SR は実際の SR レベルを決定する独自のコンセプトを持っています。 元の手法はインターネットから取得されたものではなく、インターネット上で公開されたこともありません。 A2SR は、取引スタイルに応じて SR レベルを自動選択します。 時間枠を変更しても、SR レベルはその位置にとどまります。 実際のSRは、使用する時間枠から取得されるわけではないため. A2SR
Advanced Supply Demand
Bernhard Schweigert
4.91 (300)
現在30%オフ 初心者にもエキスパートトレーダーにも最適なソリューション このインジケーターは独自の機能と新しい公式を多数内蔵しており、ユニークで高品質かつ手頃な取引ツールです。このアップデートでは、2つの時間枠ゾーンを表示できるようになります。より長いTFだけでなく、チャートTFとより長いTF(ネストゾーンを表示)の両方を表示できます。すべてのSupply Demandトレーダーの皆さんのお気に召すはずです。:) 重要情報の公開 Advanced Supply Demandの可能性を最大化するには、 https://www.mql5.com/ja/blogs/post/720245 にアクセスしてください。   エントリーまたはターゲットの正確なトリガーポイントを正確に特定できれば取引がどのように改善されるか想像してみてください。新しい基盤となるアルゴリズムに基づいて構築されているため、買い手と売り手の間の潜在的な不均衡をさらに簡単に特定できます。これは、最も強い需要と供給のゾーンと、過去のパフォーマンス(古いゾーンを表示)がグラフィカルに表現されるためです。これらの機能は、最適な
MetaBands M4
Vahidreza Heidar Gholami
3.5 (6)
MetaBandsは、強力でユニークなアルゴリズムを使用してチャンネルを描画し、トレンドを検出して、トレーダーに取引の入出ポイントを提供することができます。チャンネル指標に加えて、強力なトレンド指標でもあります。入力パラメータを使用して新しいチャンネルを作成するために、異なるタイプのチャンネルを統合することができます。MetaBandsは、市場のイベントについてユーザーに通知するために、すべてのタイプのアラートを使用します。 特徴 ほとんどのチャンネルアルゴリズムをサポート 強力なトレンド検出アルゴリズム 異なるタイプのチャンネルを統合する能力 マルチタイムフレームおよびマルチカレンシー(シグナルマトリックス) すべてのタイプのアラート機能(サウンド、画面フラッシャー、プッシュ通知、メール、ポップアップ、矢印) 再描画しない トレンド検出 MetaBandsは、チャネル内を振動する青いラインを使用してトレンドを検出します。ラインがチャネルの上部バンドに達すると、下降トレンドの開始を示し、下部バンドに達すると上昇トレンドの開始を示します。青いラインが中心ラインに近づくと、市場はコンソリ
Genesis Matrix Pro is a professional multi-timeframe trend detection indicator designed to help traders identify high-quality market alignment with clarity and structure. It combines 12 different technical indicators into one visual alignment matrix, allowing traders to quickly see when market conditions are bullish, bearish, or neutral. A signal is generated only when the selected strategies are aligned, helping reduce noise and improve decision-making. PLEASE CONTACT ME AFTER PURCHASE TO GET
この製品は 2026 年の市場向けに更新され、最新の MT5 ビルドに最適化されています。 価格更新のお知らせ: Smart Trend Trading System は現在 $99 で提供されています。 次の 30 件の購入 後、価格は $199 に上がります。 特別オファー: Smart Trend Trading System を購入後、私にプライベートメッセージを送ることで、 Smart Universal EA を無料 で受け取り、Smart Trend のシグナルを自動売買に変えることができます。 Smart Trend Trading System は、リペイントなし、再描画なし、遅延なしの完全なトレーディングシステムです。よりクリーンなシグナル、より明確なトレンド方向、そしてより整理された取引方法を求めるトレーダー向けに作られています。 Online course , manual and download presets . このシステムは、トレンド検出、反転ゾーン、Smart Cloud、トレーリングストップロジック、サポートとレジスタンス、ローソク足の色分け、ア
Dynamic Forex28 Navigator - 次世代の Forex 取引ツール。 現在 49% オフ。 Dynamic Forex28 Navigator は、長年人気のインジケーターを進化させたもので、3 つの機能を 1 つにまとめています。 Advanced Currency Strength28 インジケーター (レビュー 695 件)  + Advanced Currency IMPULSE with ALERT (レビュー 520 件) + CS28 コンボ シグナル (ボーナス)。 インジケーターの詳細 https://www.mql5.com/en/blogs/post/758844 次世代の Strength インジケーターが提供するもの  オリジナルで気に入っていたすべての機能が、新機能と精度の向上によって強化されました。 主な機能: 独自の通貨強度計算式。 すべての時間枠でスムーズかつ正確な強度ライン。 トレンドの特定と正確なエントリーに最適です。 ダイナミックマーケットフィボナッチレベル (マーケットフィボナッチ)。 このインジケーターに固有
BTMM State Engine Pro is a MetaTrader 4 indicator for traders who use the Beat The Market Maker approach: Asian session context, kill zone timing, level progression, peak formation detection, and a multi-pair scanner from a single chart. It combines cycle state logic with a built-in scanner dashboard so you do not need the same tool on many charts at once. What it does Draws the Asian session range; session times can follow broker server offset or be set in inputs. Tracks level progression (L
IQ FX Gann Levels a precision trading indicator based on W.D. Gann’s square root methods . It plots real-time, non-repainting support and resistance levels to help traders confidently spot intraday and scalping opportunities with high accuracy. William Delbert Gann (W.D. Gann) was an exceptional market analyst, whose trading technique was based on a complex blend of mathematics, geometry, astrology, and ancient mathematics which proved to be extremely accurate. Setup & Guide:  Download  MT5 Ver
スイングトレーディング は、トレンドの方向のスイングと可能な反転スイングを検出するように設計された最初のインジケーターです。トレーディングの文献で広く説明されているベースラインスイングトレーディングアプローチを使用します。インディケータは、いくつかの価格と時間のベクトルを調査して、全体的なトレンドの方向を追跡し、市場が売られ過ぎまたは買われ過ぎて修正の準備ができている状況を検出します。 [ インストールガイド | 更新ガイド | トラブルシューティング | よくある質問 | すべての製品 ] むち打ちを起こさずに市場スイングの利益 インジケーターは常にトレンドの方向を表示します 色付きの価格帯は機会のベースラインを表します 色付きのダッシュは、可能な反転スイングを表します この指標は、独自の品質とパフォーマンスを分析します 複数時間枠のダッシュボードを実装します カスタマイズ可能なトレンドおよびスイング期間 電子メール/サウンド/プッシュアラートを実装します インジケータは再描画またはバックペインティングではありません Swing Tradingとは Swing Tradingは
Price & Time Market Structure Indicator A professional market structure tool that analyzes waves through both price and time — not price alone. Main Description NeoWave PRO is a professional market structure indicator for MetaTrader 4 designed for traders who want to move beyond traditional one-dimensional wave tools such as ZigZag, swing indicators, and basic high/low systems. Most wave indicators analyze only one thing: Price. But a real market wave is not only a price movement. A true wave de
GOLD Impulse with Alert
Bernhard Schweigert
4.67 (12)
このインディケータは、当社の2つの製品 Advanced Currency IMPULSE with ALERT  +   Currency Strength Exotics . のスーパーコンビネーションです。 このインジケーターは全ての時間枠で作動し、8つの主要通貨と1つのシンボルの強弱のインパルスをグラフで表示します。 このインジケータは、金、エキゾチックペア、商品、インデックス、先物など、あらゆるシンボルの通貨強度の加速度を表示することに特化されています。金、銀、原油、DAX、US30、MXN、TRY、CNHなどの通貨強度の加速度(インパルスまたは速度)を表示するために、任意のシンボルを9行目に追加できる、この種の最初のものです。 新しいアルゴリズムに基づいて構築され、潜在的な取引の特定と確認がさらに容易になりました。これは、通貨の強さや弱さが加速しているかどうかをグラフィカルに表示し、その加速の速度を測定するためです。加速すると物事は明らかに速く進みますが、これはFX市場でも同じです。つまり、反対方向に加速している通貨をペアリングすれば、潜在的に利益を生む取引を特定
Market Structure Order Block Dashboard MT4 は、市場構造と価格の主要な反応ゾーンをチャート上で直接読み取りたいトレーダーのために設計された MetaTrader 4 用インジケーターです。BOS、ChoCH、Order Blocks、Fair Value Gaps (FVG)、流動性、Kill Zones、Volume Profile、そして素早い分析のためのコンパクトなダッシュボードを統合しています。 このインジケーターは、市場構造、ICT および Smart Money の概念を意思決定の枠組みとして使用するトレーダーを対象としています。トレンド継続、潜在的反転、価格不均衡、流動性ターゲット、関心ゾーンをより構造的に把握するのに役立ちます。 購入者向けリソース 購入後に MQL5 プライベートメッセージで簡単にリクエストするだけで、完全な PDF ユーザーガイドとパラメーター設定のヒントが入手可能です。MQL5 プライベートメッセージで直接技術サポートを提供します。 この MT4 バージョンは MT5 バージョン 1.20 のすべての機能を
「 Dynamic Scalper System 」インジケーターは、トレンド波の中でスキャルピング取引を行う手法のために設計されています。 主要通貨ペアと金でテスト済みで、他の取引商品との互換性があります。 トレンドに沿った短期的なポジションオープンのシグナルを提供し、追加の価格変動サポートも提供します。 インジケーターの原理 大きな矢印はトレンドの方向を決定します。 トレンド波の中では、小さな矢印の形でスキャルピングシグナルを生成するアルゴリズムが機能します。 赤い矢印は強気方向、青い矢印は弱気方向です。 トレンドの方向には敏感な価格変動ラインが描かれ、小さな矢印のシグナルと連動します。 シグナルは次のように機能します。適切なタイミングでラインが現れるとエントリーシグナルが形成され、ラインが開いている間はポジションが保持され、完了すると取引が終了します。 推奨される動作時間枠はM1~H4です。 矢印は現在のローソク足に形成され、次のローソク足が開いている場合は、前のローソク足の矢印は再描画されません。 入力パラメータ Trend Wave Period - トレンド方向
MT5版もご用意しています https://www.mql5.com/ja/market/product/170916 M30/H1/H4スイング版もあります M5/M15では取りきれない大きな波を狙いたい方へ。 Gold Signal Swing Pro(M30/H1/H4対応)を販売中。 1トレードで$20〜$80+の値幅を狙う。 https://www.mql5.com/en/market/product/177643 KURAMA GOLD SIGNAL PRO(MT4版)— 7層フィルター・自動TP/SL・品質スコア搭載 XAUUSD完全トレードシステム リペイントなし。リドローなし。ラグなし。すべてのサインは確定後に変わりません。見たままが結果です。 特典:買い切りライセンスをご購入いただいた方に、AI Zone Radar($59相当)+PDFマニュアルを無料プレゼント。購入後にMQL5でメッセージをお送りください
123パターン は、最も人気のある強力で柔軟なチャートパターンの1つです。このパターンは、3つの価格ポイントで構成されています。ボトム、ピークまたはバレー、および38.2%〜71.8%のフィボナッチリトレースメントです。パターンは、価格が最後のピークまたは谷、インディケーターが矢印をプロットし、アラートを上昇させ、取引を行うことができる瞬間を超えたときに有効と見なされます。 [ インストールガイド | 更新ガイド | トラブルシューティング | よくある質問 | すべての製品 ] クリアな取引シグナル カスタマイズ可能な色とサイズ パフォーマンス統計を実装します カスタマイズ可能なフィボナッチリトレースメントレベル 適切なストップロスおよび利益レベルを表示します インジケーターを使用して、継続パターンまたは反転パターンを見つけることができます 再描画および非再描画ではありません 電子メール/音声/視覚アラートを実装します 123パターン は、継続パターンまたは反転パターンとして現れます。物事を簡単にするために、このインジケーターを使用して、検索するパターンのタイプを選択できるため
Enigmera
Ivan Stefanov
5 (8)
ENIGMERA: 市場の中心 重要:MQL5.comのデモはStrategy Testerで実行されており、Enigmeraの機能を完全には反映していない場合があります。詳細については、説明、スクリーンショット、ビデオをご確認ください。質問があれば、遠慮なくメッセージを送ってください! インジケーターのコードは完全に書き直されました。バージョン3.0は新機能を追加し、インジケーターの開始以来蓄積されたバグを修正しました。 紹介 このインジケーターとトレーディングシステムは、金融市場への注目すべきアプローチです。ENIGMERAはフラクタルサイクルを使用して、サポートとレジスタンスのレベルを正確に計算します。真の蓄積フェーズを示し、方向と目標を提供します。トレンドでも修正でも機能するシステムです。 動作方法 インジケーターのほとんどの機能は、チャートの左側にあるボタンで制御され、市場の状況に迅速に対応できるようになっています。 ボタン ON/OFF – インジケーター全体を表示または非表示にします。 Channel – サポートチャネルを有効にし、許容範囲の偏差を示します。 Dev
地震計マーケット クエイク検出器。 Description in English : https://www.mql5.com/en/market/product/113869?source=Site+Market+Product+Page#description How to use the Seismograph : https://www.mql5.com/en/market/product/113869#!tab=comments&page=2&comment=52806941 Create an EA : https://www.mql5.com/en/market/product/113869#!tab=comments&page=3&comment=52816509 どのような取引方法であれ、流動性の低い市場への参入は避けたいものです。 地震計は、市場が上昇する前に市場に参入する適切なタイミングに役立ちます。 しかし、忙しいはずの市場時間帯にエントリーするようにしたにもかかわらず、流動性の低い市場に閉じ込められてしまう人が多いのが実情です。 数時間待った後、
Scalper Vault は、スキャルピングを成功させるために必要なすべてを提供するプロフェッショナルなスキャルピング システムです。このインジケーターは、外国為替およびバイナリー オプションのトレーダーが使用できる完全な取引システムです。推奨される時間枠は M5 です。 システムは、トレンドの方向に正確な矢印シグナルを提供します。また、トップとボトムのシグナルとギャン マーケット レベルも提供します。 インジケーターは、プッシュ通知を含むすべてのタイプのアラートを提供します。 インジケータの購入後にご連絡ください。私の個人的な取引の推奨事項と素晴らしいボーナス指標を無料で共有します! 幸せで有益な取引をお祈りします!
Introduction to Fractal Pattern Scanner Fractal Indicator refers to the technical indicator that makes use of the fractal geometry found in the financial market. Fractal Pattern Scanner is the advanced Fractal Indicator that brings the latest trading technology after the extensive research and development work in the fractal geometry in the financial market. The most important feature in Fractal Pattern Scanner is the ability to measure the turning point probability as well as the trend probabi
トレンドラインプロ   市場の真の方向転換点を理解するのに役立ちます。この指標は、真のトレンド反転と主要プレーヤーが再び参入するポイントを示します。 分かりますか     BOSライン   複雑な設定や不要なノイズなしに、より長い時間足でのトレンドの変化と重要なレベルを把握できます。シグナルは再描画されず、バーが閉じた後もチャート上に残ります。 VERSION MT 5     -     RFI LEVELS PRO インジケーター と組み合わせることで、その潜在能力を最大限に発揮します。 インジケーターが示す内容: 本当の変化   トレンド(BOSライン) 一度シグナルが現れたら、それは有効です!これは、リペイント機能を持つインジケーターとの重要な違いです。リペイント機能を持つインジケーターは、シグナルを発した後、それを変更し、資金の損失につながる可能性があります。これにより、より高い確率と精度で市場に参入できます。また、矢印が現れた後、目標値(利益確定)に達するか、反転シグナルが現れるまで、ローソク足の色を変更する機能もあります。 繰り返しエントリ       主要プレーヤーの
The Propfolio Master Suite is the ultimate all-in-one analytical workstation for professional traders. Combining the power of the Beat The Market Maker (BTMM) methodology, Smart Money Concepts (SND/Liquidity), and Advanced Volume Profile, this suite replaces multiple different indicators with one optimized engine. Monitor up to 14 pairs simultaneously from a single chart, instantly identify market cycles, and seamlessly map institutional footprints with the click of a button. The Command Center
このインジケーターは、反転ポイントと価格戻りゾーンを正確に表示します。     主要プレーヤー 。新たなトレンドが形成される場所を把握し、最大限の精度で意思決定を行い、すべての取引をコントロールします。 TREND LINES PRO インジケーターと組み合わせることで、その潜在能力を最大限に発揮します。 VERSION MT5 インジケーターが示す内容: 新しいトレンドの始まりに活性化する反転構造と反転レベル。 リスクと報酬の比率を最小限に抑えた利益 確定 と 損失停止の レベルの表示     RR 1:2   。 インテリジェントな削減ロジックによるストップロス。 指定されたインジケーターから 2 つのトレンド タイプの反転パターンを表示します。 指標: トレンドを追う   TREND LINES PRO   (世界的なトレンドの変化) TREND PRO   (クイックトレンド変更) シンプルで効果的   スキャナー   リアルタイムトレンド(新機能)。 マルチタイムフレームのインストゥルメント フィルタリング。 画面   利益     LOGIC AI信号の後。 当日プラス方
作者のその他のプロダクト
Are you a day/week/month trader, or even a quick scalper? MCTS will show you the best trending currencies to trade on any timeframe. By using a unique algorithm MCTS measures the strengths of individual currencies and then combines them into pairs to show you the best pairs to trade. Monitor all 8 major currencies and all 28 pairs. Monitors the strengths of the following currencies: EUR, USD, GBP, JPY, AUD, NZD, CHF, CAD. Measure the true strength of a currency on any timeframe. Know which curre
MCTC is the most advanced multicurrency strength indicator for day trading, that does NOT use moving averages. This versatile strength meter has many settings that can be customized to suit the day traders needs. With up to 12 customization time periods, automatic calculation and graph plotting of previous period high/low values, 2 side meters showing currency strength, pair strength, points movement, points movement from previous periods, percentage, and pressure. Clickable chart for fast switc
フィルタ:
rcbarlow
102
rcbarlow 2021.03.01 20:06 
 

Indicator signals late. Not worth the effort to download and install it.

David Jones
67
David Jones 2020.10.28 05:19 
 

Still trying this indicator out. Not sure about ow long in advance the signals are given. Will likely report back when I hav a full review. Thanks

Viktor Koroveshi
408
Viktor Koroveshi 2020.06.08 13:21 
 

ユーザーは評価に対して何もコメントを残しませんでした

sunnychow
9043
sunnychow 2018.11.10 17:33 
 

Good tools

Павел
324
Павел 2018.01.22 12:51 
 

За восемь часов на семи валютных парах цена не отработала ни одного сигнала. халтура.

レビューに返信