Market Profile iMT5
- インディケータ
-
Kyra Nickaline Watson-gordon
 Experienced Developer (Experts / Indicators / Utilities ...)
Account Manager (Investment Manager) - バージョン: 1.1
- アップデート済み: 17 1月 2024
- アクティベーション: 10
Definition :
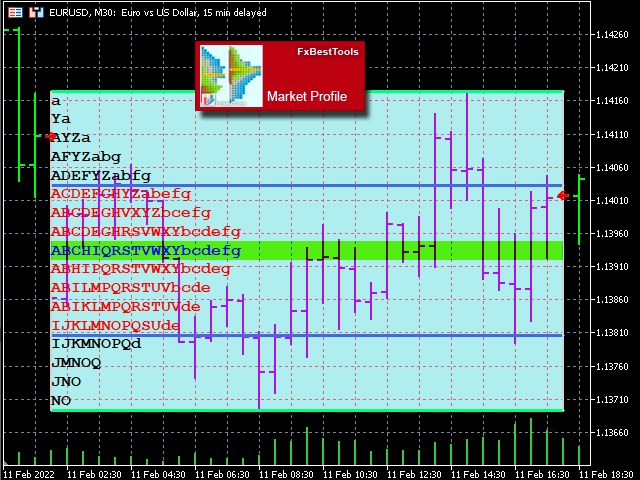
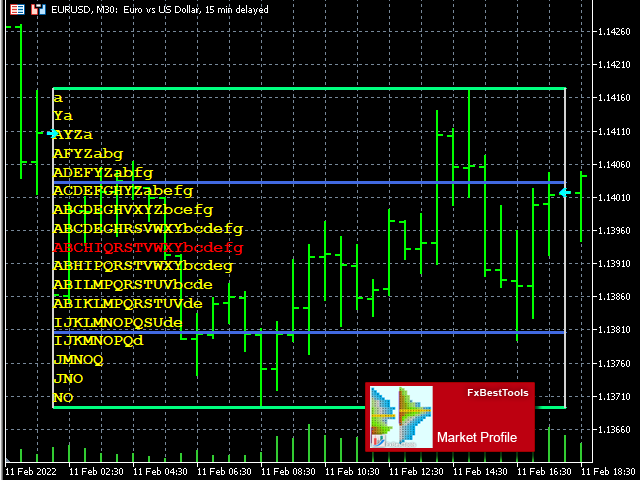
A Market Profile is an intra-day charting technique (price vertical, time/activity horizontal). Market Profile is best understood as a way to see order in the markets.
Market Profile was a way for traders to get a better understanding of what was going on, without having to be on the trading floor.
The current indicator is developed based on Easy-to-Use architecture including a wide range of visual settings.
Major Features of Indicator :
- Various Views of Market Profile
- The indicator can help determine Support-Resistance levels.
- Easy to use and setup
- Histogram drawing modes : Simple, Pretty Normal, Pretty Linked
- Periods : Sessions, Daily, Weekly, Monthly
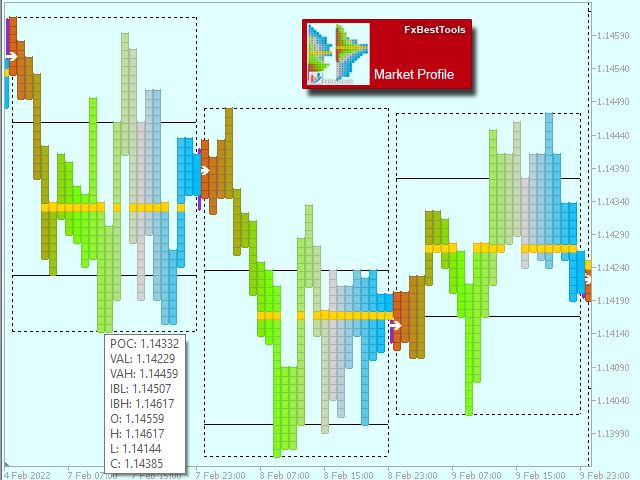
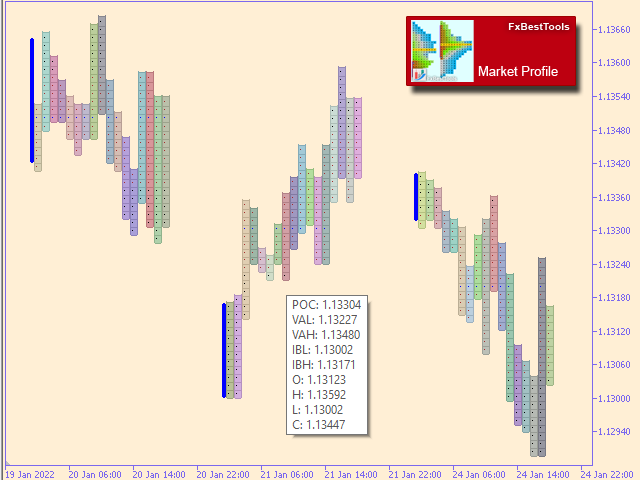
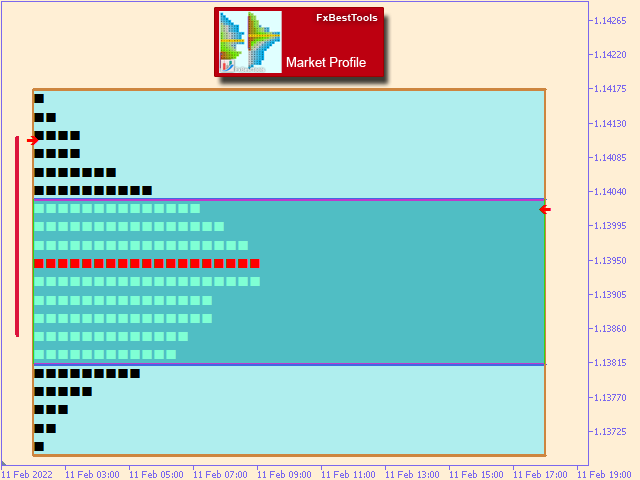
- Point Of Control, Value Area Calculation, Initial balance
- Single Prints, Poors, Trails
- Buffers for Programmers
- Various Visual Settings
Inputs :
Setting inputs of the indicator is very simple. Below are some major items described. Other items are color and visual settings of profile elements and no need to list below.
Some pre-built settings are available for download here.
- General Settings
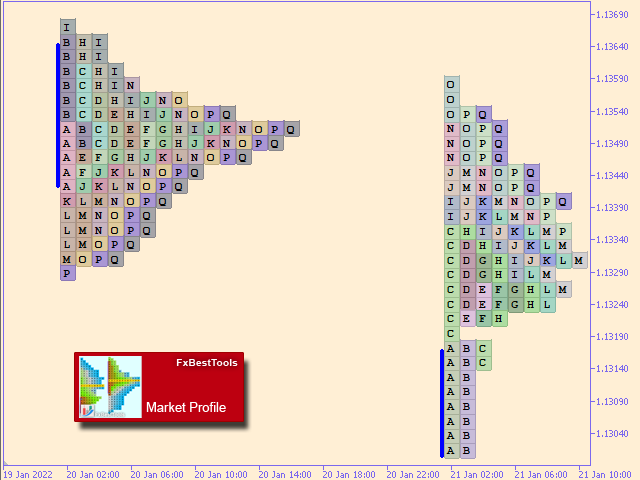
- Visual Mode :
- Simple : Standard and simple market profile display
- Pretty Normal : A pretty design of standard market profile
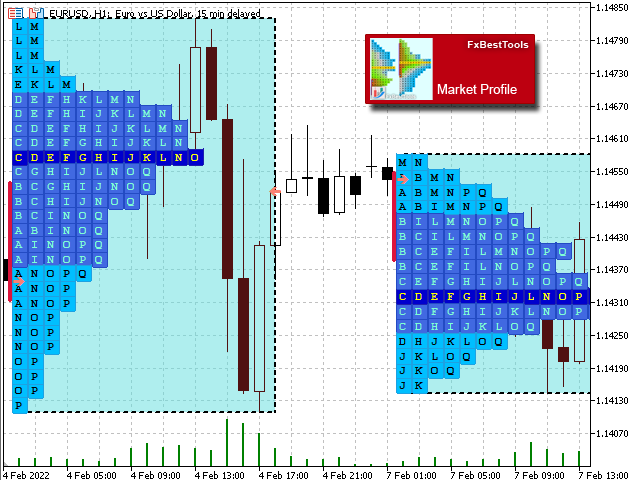
- Pretty Linked : Profile elements are displayed on candles.
- Histogram Type :
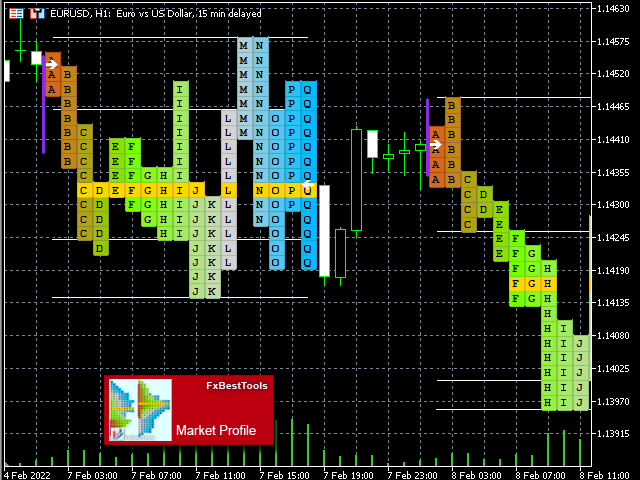
- Session : Profile will be drawn based on session times defined on the inputs (M30 or H1 timeframe is recommended)
- Daily : Profile will be drawn Daily basis. (H1 or H4 timeframe is recommended)
- Weekly : Profile will be drawn Weekly basis. (D1 or H4 timeframe is recommended)
- Monthly : Profile will be drawn Monthly basis. (D1 or W1 timeframe is recommended)
- Precision Type :
- Auto : Price levels will be determined based on chart scale and font size to make a better view of the profile.
- Manual : Price distance between each price level will be input from the user based on points.
- Histogram Settings
- Histogram Shape :
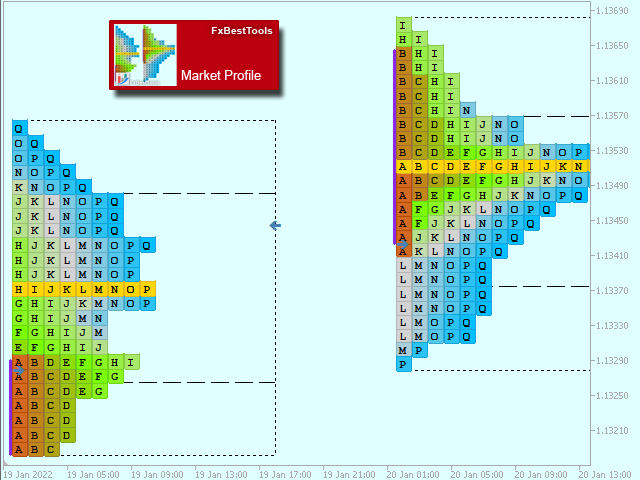
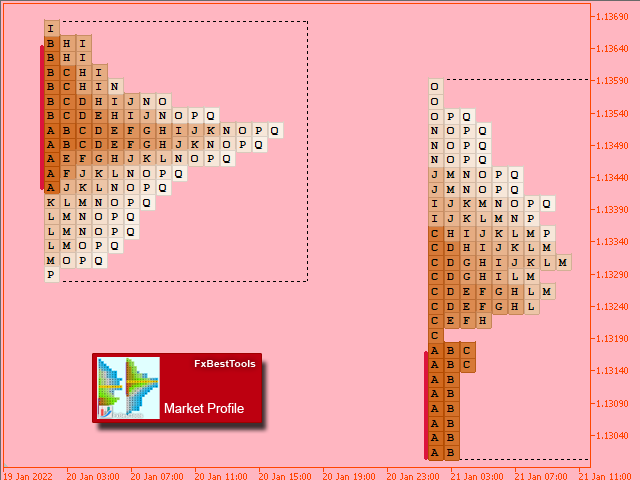
- Letters : Standard market profile letters will be displayed
- Boxes : Simple boxes will be displayed instead of letters
- Custom shape : A shape can be defined based on ASCII code of "wingdings" font. Can use Character Map to find your desired shape.
- Color Mode of Pretty Histograms : This is the background color of pretty profile elements. Options available :
- Single Color
- Random Light/Medium/Dark Colors
- Gradient Colors based on 2/3/4 Colors
- Options for Poors, Single Prints and Trails
- Bounding Box Options
- Options for profile background, bounding box,open/close price,...
- VA Settings
- Value Area Settings
- POC Settings
- Point of Control Settings
- IB Settings
- Initial Balance Settings
Tips :
- You can attach more than one indicator to a chart with different settings in these cases :
- If you want multiple sessions on a day,
- If you want 2 or more histograms overlapping each other.
- Some Pre-Built Templates :
- Some set files are available here.
- Buffers for programmers :
- All specifications of profiles are available on the indicator buffer. Manual available here.
Visit our other useful utilities, Indicators and experts here.