ChannelVM
- インディケータ
- バージョン: 1.0
- アクティベーション: 5

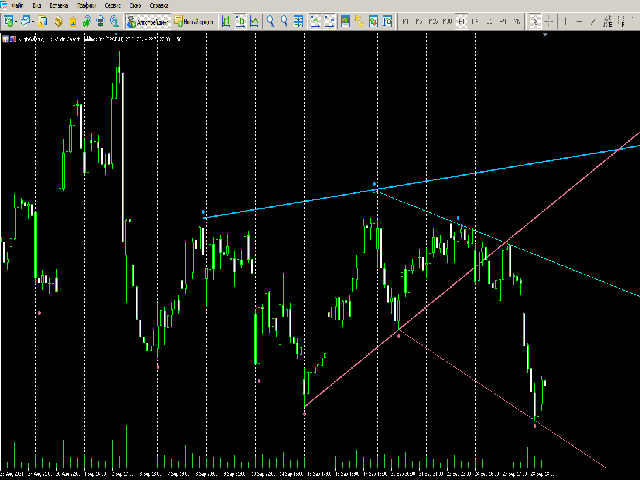
ChannelVM - is a channel indicator converted from an indicator for MT4 to an indicator for working in MT5.
In addition to displaying price channels on a chart, it recognizes the simplest patterns - "triangle" and "flag".
Helps to determine further price movement.
Has simple and understandable settings that do not need a description.
When redesigning for the MT5 trading terminal, the logic of work and the appearance of the original indicator were preserved as much as possible.


ユーザーは評価に対して何もコメントを残しませんでした