BuySellLimit N Grid MT5

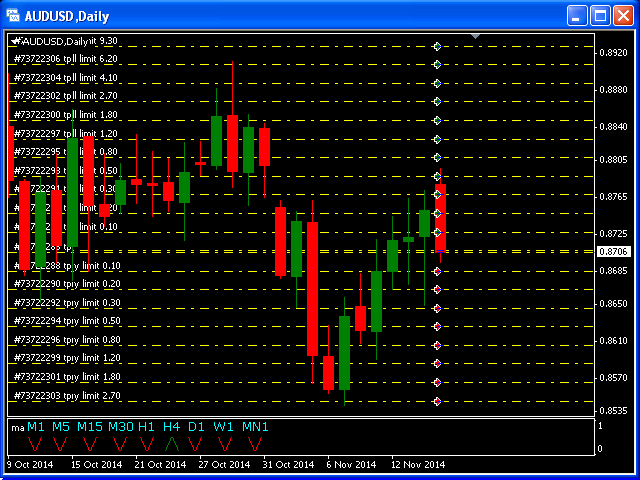
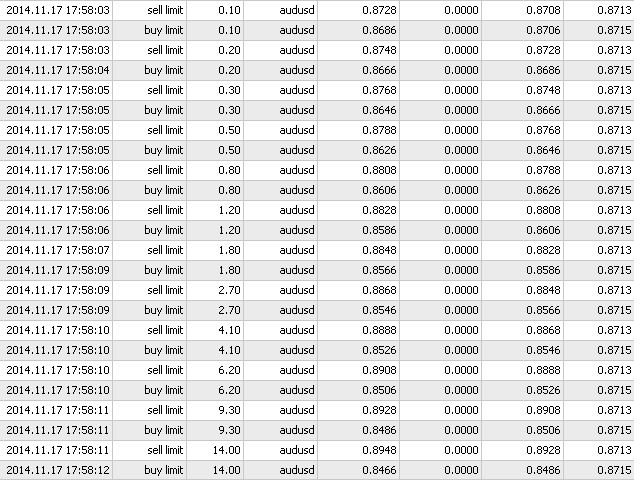
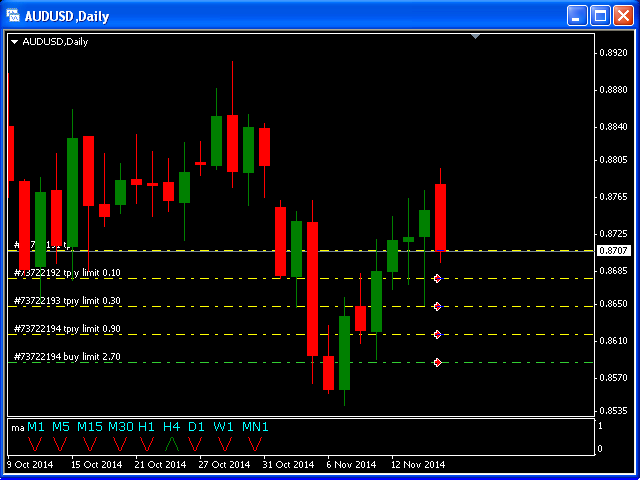
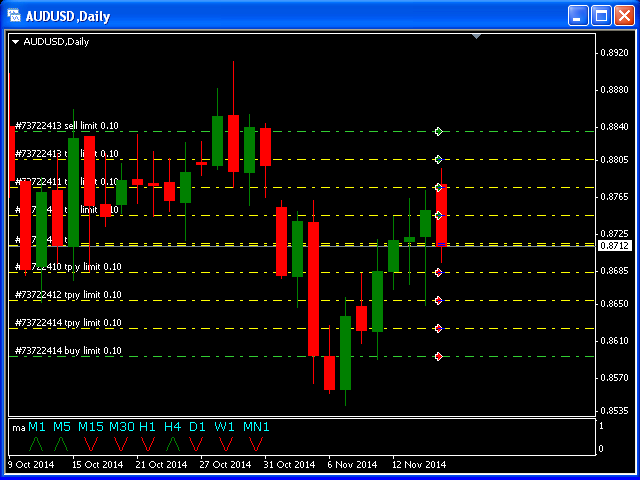
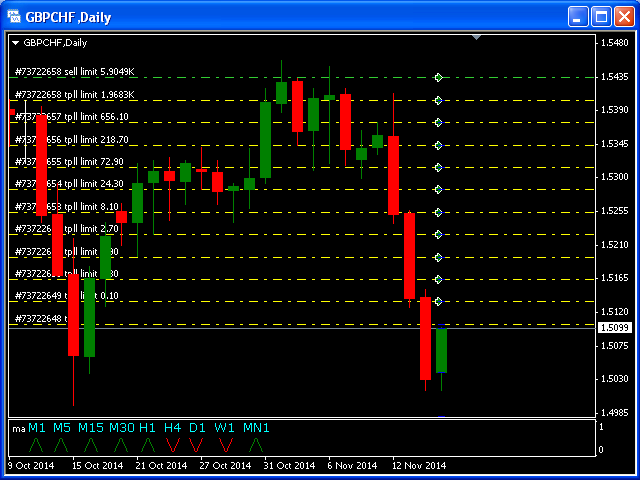
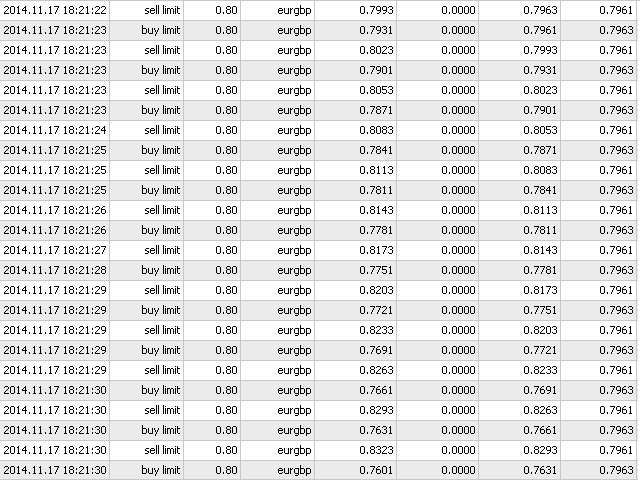
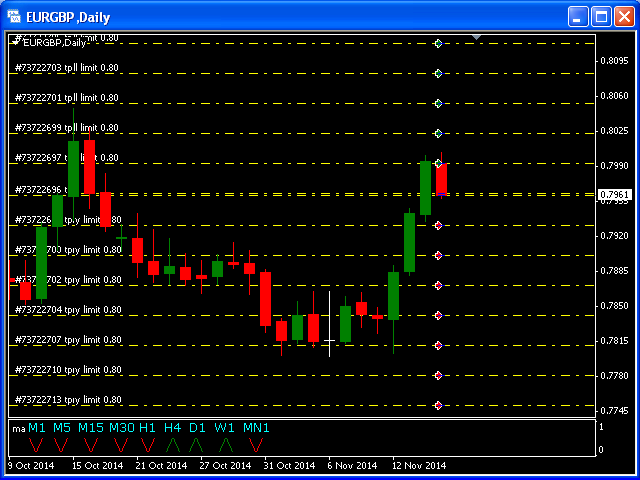
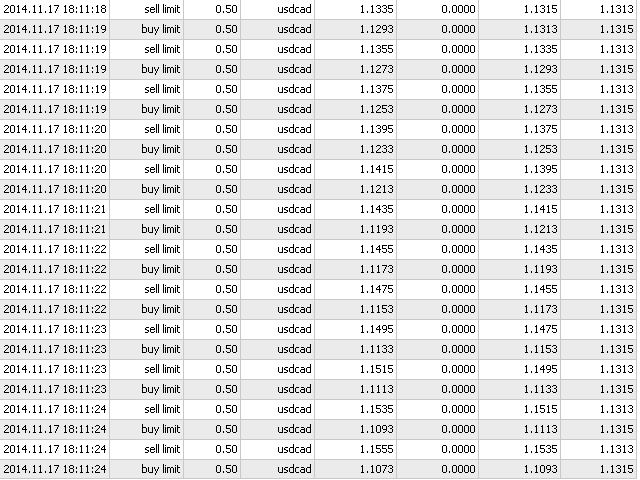
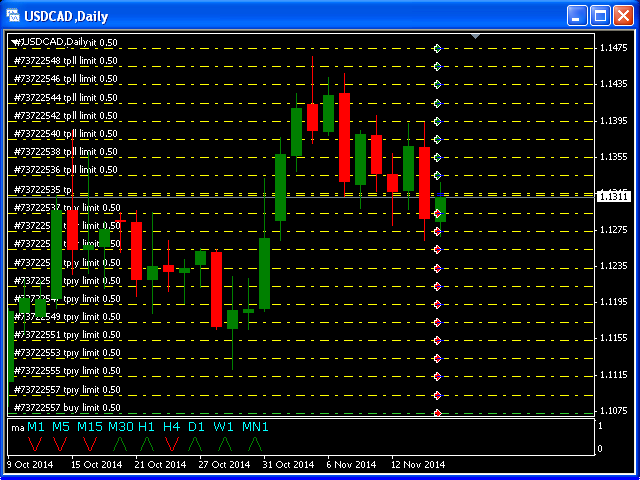
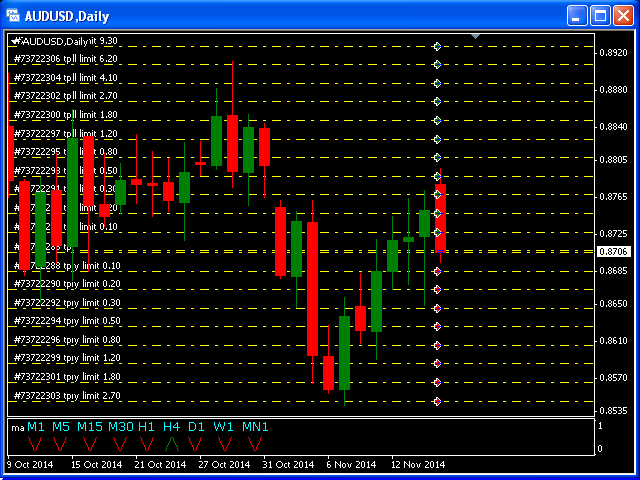
BuyLimit_SellLimit_Grid script opens Buy Limit and Sell Limit pending orders.

You just need to drop this script on the chart with a desired currency pair.

Before placing all pending orders, the input window is opened allowing you to modify all input parameters:

  • DeleteAllPending – if 'true', all pending orders are deleted.
  • BuyLimit – if 'true', Buy Limit order is opened.
  • SellLimit – if 'true', Sell Limit order is opened.
  • InitLot – initial lot.
  • LotCoeff – if 1, all pending orders have the same lot size.
  • InitStep – difference between two consecutive orders in points.
  • StepCoeff – step coefficient.
  • NumOfOrders – number of orders.
  • Slippage – allowed slippage.
  • MagicNum – magic number.

Attention:

  • If DeleteAllPendings=true, the script is able to delete existing pending orders for the current currency pair only.
  • You have to Allow automated trading on the Expert Advisors tab (Tools->Options).
  • In the input window, you have to allow auto trading.
おすすめのプロダクト
Manually enter the price for Buy position or Sell position. This EA will automatically open 3 orders and also 3 Pending (In deposited position) = Total 6 orders per one click Please see Screenshot or Videos for more explanation. - Easy to manage your different order. - Fast in modification for SL and TP. - Can modified the SL and TP depends on individual techniques.
Episode Health Monitor Episode Health Monitor is a trading utility for MetaTrader 5 designed to analyze the real-time condition of active trading positions directly on the chart. The tool evaluates the current “trading episode” - a group of open positions - and provides a structured view of risk, stability, and distance to potential failure. Instead of relying only on profit/loss or price movement, it helps identify whether the current position is stable, weakening, or approaching a critical st
Equity Firewall は MT5 用のユーティリティで、アカウントレベルでの自動ドローダウン管理とリスク管理を目的としています。複数のエキスパートアドバイザーが同じアカウントで取引している場合でも、ポジションの急増やドローダウンのリスクから資金を保護します。 デモ口座用の試用版をインストール Equity Firewall は、最大総ドローダウン、日次損失制限、および利益目標を設定でき、制限に達した際の操作を選択できます:すべてのポジションと注文を閉じる、すべてのチャートを閉じる、または両方を同時に実行。 制限がトリガーされた場合、プログラムは選択した操作を自動的に実行し、複数の EA が同時に取引している場合でも完全に互換性があります。プログラムはプッシュ通知およびメール通知に対応しており、ダッシュボード上で現在のドローダウン、日次損失、および目標達成状況を確認できます。 使用例 • プロップトレーディングおよびマルチ EA アカウント:複数のエキスパートアドバイザーが同時に取引している場合のリスク管理。 • 資金保護:エクイティ目標に達した場合、または最大ドローダウンが発
A simple script that closes all current orders. Terminate once close all positions, so no worries about constantly closing your order. How to use : Drag the script from the navigator to the chart, and it will be activated. Do remember to enable algo trading to use this script. There are different version of the script that can choose whether to close all buy/sell posiitons, if you need this, do contact me in MQL5.
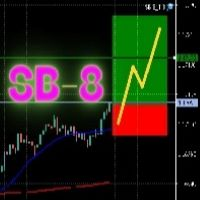
SB-8 – Manual Trading Panel with Fixed Risk & TradingView-Style Visualization for MT5 SB-8 is an advanced manual trading panel for MetaTrader 5 , designed to execute trades visually, quickly and without calculations . It is especially built for traders coming from TradingView , who often find MT5 confusing when it comes to risk management and trade visualization. With SB-8, you don’t calculate lot size, percentages or risk . You simply move the Stop Loss line , and the panel handles everything a
Talents ATR Scalper Utility (MT5) The Talents ATR Scalper Utility is a professional-grade trade execution and management tool built for MetaTrader 5. Inspired by the Biblical Parable of the Talents , this utility is designed to help traders multiply their potential with precision risk control, one-click simplicity, and advanced automation. Whether you’re scalping forex, gold, or indices, this tool delivers speed, consistency, and confidence. Key Features One-Click Trade Preview Click below price
Gold Decision Assistant Gold Decision Assistant is a chart-based utility for MetaTrader 5 designed to help traders understand whether current market conditions are suitable for taking a trade. Instead of generating frequent entry signals, the tool focuses on decision clarity. It summarizes multiple conditions such as spread, session state, trend strength, structure, and short-term movement into a single, readable panel. This is particularly relevant when trading XAUUSD, where price can move qui
This utility provides the ability to use hot keys in manual trading instantly responding to the current market situation. You can assign hot keys to open/close positions by their type, open/close all positions on the current chart and remove all orders on the current chart. You can also assign hot keys for five predefined trade volumes and switch between them if necessary with no need to change the volume manually from time to time. It is also possible to set the auto calculation of a trade volu
Trader's Panel is a simple EA for managing trades once open. Your options for managing open trades are to close an entire open trade, close a percent of an open trade, which can be input from the trader panel, and then set stop loss to break even on an open trade. The Trader's Panel hovers at top left of screen right below the one click order buttons. **Note that this EA does not open trades. It only manages trades once they are open.
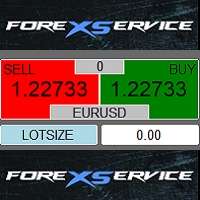
One Click Trader  is a tool designed for MetaTrader 4 platform, which enables you to take your trading to the next level. It enables you to open, manage and close your trades in simple an efficient way by just one click of your mouse button. "-"   ,  "+"  change OCT window size  Up arrow minimizes the OCT panel Down arrow maximizes the OCT panel Right arrow displays the next panel with additional features Left arrow hides the panel with additional features Red  SELL  button enables you to open s
Auto SLTP Maker MT5  is an assistant for all those who forget to set StopLoss and/or TakeProfit in deal parameters, or trade on a very fast market and fail to place them in time. This tool automatically tracks trades without StopLoss and/or TakeProfit and checks what level should be set in accordance with the settings. The tool works both with market and pending orders. The type of orders to work with can be set in the parameters. It can track either trades for the instrument it runs on, or all
LotCalculatorPro
Reynaldo Jr Audencial Pascual
LotCalculatorPro + Smart Trading Panel LotCalculatorPro は、リスク管理、ロットサイズ計算、そしてチャート上でのトレード実行を簡単にするために設計された、強力なオールインワントレーディングアシスタントです。 このツールは、トレーダーがリスクを管理し、正確なロットサイズを計算し、さらに ブレークイーブン(Break-Even)、部分決済、日次利益/損失保護 などのスマート機能によって取引を自動管理するのに役立ちます。 Forexトレーダー、プロップファームトレーダー、リスク管理を重視するトレーダー に最適で、 MetaTrader 5 上でクリーンで効率的なトレーディング環境を提供します。 デフォルト設定: 1日の利益目標: 初期残高の2% 1日の最大損失: 初期残高の1% 主な機能 ロットサイズ計算機 LotCalculatorPro は以下の情報に基づいて 適切なロットサイズを自動計算 します: エントリー価格 ストップロス リスク金額(USD) これにより すべての取引で一貫したリスク管理 が可能になります。 チャート上での
目標利益に達した際の自動利益確定 EquityTargetCloser   — は、MetaTrader 5用のユーティリティ型エキスパートアドバイザーです。   エクイティが現在の残高を指定された利益額だけ上回った時点で 、すべての市場ポジションをクローズし、保留注文を削除します。全ポジションをクローズした後、目標は自動的に引き上げられます。新しい閾値 = 新しい残高 + 指定利益。このEAは取引を開始せず、既存のポジションのみを管理し、利益を確実に確定し、蓄積された資金を保護します。 MT4-version:  https://www.mql5.com/en/market/product/169850 仕組み エキスパートアドバイザーは、   エクイティ   を動的な目標値と継続的に比較します。 目標値 =   現在の残高(Balance) + plusMoney   (米ドル)。 エクイティがこの金額以上になると、保護が作動します。   すべての市場ポジション   (全銘柄)をクローズします。 パラメータ   Delete pending orders = true の場合、
Close Buttons Utilityは、チャートから直接ポジションと未決済注文を手動で管理できる、コンパクトで柔軟性の高いMQL5ユーティリティです。このパネルでは、現在の銘柄または選択した銘柄の銘柄グループにおける注文とポジションのグループをワンクリックで決済できます。すべての注文、指定したマジックナンバーリスト、または手動注文に対応しています。パネルは最小化したり、画面上で移動させたりできます。ライトテーマとダークテーマ、カスタマイズ可能なサイズ、行の高さ、ボタン列数に対応しており、各ボタンに任意のホットキーを割り当てることができます。銘柄とマジックナンバー(すべて、リスト、または手動のみ)でフィルタリングすることで、一括操作で必要なポジションと注文を正確に選択できます。 メリット テクニカルパネル:チャート上のパネルを任意の隅にドラッグできます。パネルは上部を引っ張ることで移動でき、最小化も可能です。 クイックオーバービュー:すべての主要データ(ポジション数、取引量、損益)をコンパクトに表示 一括操作:選択した注文グループをワンクリックまたはホットキーで決済または削除
Introduction to SWARM CALCULATOR The SWARM CALCULATOR is a revolutionary tool designed for traders who prioritize effective risk management and optimized trading strategies. With its advanced features and intuitive interface, the SWARM CALCULATOR enhances your trading experience, allowing you to make informed and precise decisions. Key Features: Customized Risk Management: Automatic Position Size Calculation: Automatically determine the optimal position size based on the percentage of risk you a
Manual Trading Assistant Pro 【裁量トレーダーのための「生存」支援ツール】 エントリーの瞬間にロット計算やTP/SL設定で焦ったことはありませんか? このユーティリティは、「エントリー(攻め)」だけに集中し、面倒な「決済(守り)」を機械に任せたい裁量トレーダーのために設計されました。 相場の急変動からあなたの資金を守り、利益を着実に残すための機能が詰まっています。 【主な機能】 設定診断機能(Pips Check) 「設定倍率は1倍?100倍?」ともう迷う必要はありません。 [Pips Check] ボタンを押すだけで、お使いのブローカーや通貨ペア(クロス円、ドルストレート)に合わせて、設定が正しいかどうかを自動診断します。設定ミスによる事故を未然に防ぎます。 自動TP/SLセット 手動エントリーした瞬間に、設定したpips数で利確・損切ラインを自動挿入します。「裸のポジション」を晒すリスクをゼロにします。 バスケット決済(平均建値) 複数のポジションを持った際、損益分岐点(ブレイクイーブン)をチャート上に可視化。合計利益が目標に達した瞬間に全
Данная панель предназначена для удобного совершения сделок в платформе Metatrader. Она позволяет с легкостью открывать позиции, устанавливать стоп лосс и тэйк профит, использовать трейлинг стоп и тд.. Входные параметры : Magic - уникальный номер эксперта Lot step - шаг изменения лота Custom - произвольная сумма для высчитывания риска Risk Value  - тип поиска значения риска (в %) Функции панели : Открытие sell и buy позиций Возможность установки profit / loss для позиции, в том числе и графичес
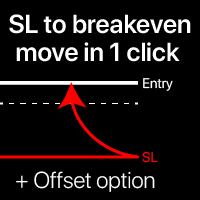
ブレークイーブンレベル: 1クリックでSLを移動。既存の利益を失うのを防ぐ このユーティリティを使用すると、1クリックで素早く利益を保護できます。 短期取引に特に重要です。オフセットオプションも利用可能。 多機能ユーティリティ : 65以上の機能、このツールを含む | 質問がある場合は連絡 | MT4版 SLレベルの移動方法: 1. 特定の [通貨ペア] を指定するか、 [すべて] の通貨ペアを選択します。 2. ブレークイーブンを適用したい 取引タイプ を選択します: [すべて]: すべての有効な取引に適用; [買い]: 買い取引のみ; [売り]: 売り取引のみ; 3. [利益>] オプション: 有効にすると、利益が指定値を超えた場合のみSLが移動されます。 4. [+ オフセット] : TPレベル方向に 追加のSLシフト を設定できます。 これにより、SLをブレークイーブンだけでなく利益レベルに移動できます。 [v]セレクター を使用して、利益とオフセット値の 計算方法 を選択できます: 金額 / ピップ / ポイント / SLサイズの% / TPサイズの% / 価格変動の% /
損益分岐点レベルを自動的に設定するためのユーティリティで、指定された距離を通過するときに取引を損益分岐点に転送します。リスクを最小限に抑えることができます。トレーダーのためにプロのトレーダーによって作成されました。ユーティリティは、トレーダーが手動で、またはアドバイザーを使用して開いたすべての成行注文で機能します。魔法数で取引をフィルタリングできます。ユーティリティは、同時に任意の数の注文を処理できます。 MT4バージョン https://www.mql5.com/en/market/product/57076 ユーティリティでできること: 1ピップから仮想ブレークイーブンレベルを設定 損益分岐点の実際のレベルを設定する 各注文を個別に処理します(ブレークイーブンレベルは注文ごとに個別に設定されます) 一方向注文のバスケットで作業します(損益分岐レベルはすべての注文に共通に設定され、購入と販売は別々に設定されます) 双方向注文のバスケットを操作します(ブレークイーブンレベルはすべての注文に共通に設定されており、一緒に購入と販売を行います) テストと作業には、チャートのボタンを使
Automatic TP and SL
Dushshantha Rajkumar Jayaraman
TradeGuard    by Chart Walker TradeGuard is a MT5 Expert Advisor (EA) designed to enhance your trading experience by automating key aspects of trade management. This EA excels in efficiently managing Take Profit (TP) and Stop Loss (SL) levels, offering a seamless and intelligent approach to trailing stops. One of TradeGuard's standout features is its Smart Trailing Stop, which dynamically adjusts the trailing distance based on market conditions. This adaptive approach helps maximize profits dur
The script allows you to quickly control positions from the keyboard.: Arrow ↑ → Open BUY Arrow → Open a SELL Arrow → → Close ALL positions Key functions: Automatic closing of opposing positions When a BUY is opened, all SALES are closed, and vice versa. Positions in the same direction remain intact (they can be accumulated). Flexible settings: LotSize. Take Profit in points (TP_Points). Stop Loss is disabled (but can be added if necessary). Safety: Checking the connection to the market. Sup
Close All and Change Take Profit and Stop Loss All Orders. Main Features     Ability to Close All Orders the Symbol you put this EA.     Ability to Change Take Profit to All Order.     Ability to Change Stop Loss to All Order.     Show Order count.     Show Average price with info and Horizontal Line.     Show lot open.     Show Price diff from average to price now     Show broken price with info and Horizontal Line.     Easy to use . How to use Close All (Symbol) PC : you can click on CloseAl
EA Hedger MT5
Sergej Chukhista
3 (2)
Have you bought a trading advisor, subscribed to a signal, or are you trading manually ?! Don't forget about risk management. EA Hedger   is a professional trading utility with many settings that allows you to manage risks using hedging. Hedging is a trading technique that involves opening opposite positions to those already open positions. With the help of hedging, the position can be completely or partially blocked (locked). For example, you have three open positions on your account: EURUSD b
The Trade Manager is a visual trade panel that makes it simple to place and manage trades, preventing human errors and enhancing your trading activity. - Very Easy to use - Trade easily from the chart - Trade with precise risk management - Offers different risk management options to calculate appropriate lot size. - A powerful risk and position management approach
Crash5 EA ,I s a automatic robot that has the level of professional decision when to take a trade without any emotion. The bot will help in your scalping decision making with its own TP (take profit) and SL (stop loss) with the trail stop when in profit. This is a trend based spike catching ,looking on whats happening in real time charts no repainting of any signals. The robot helps in making decisions on the candle stick pattern opened and closed lat price with the help of RSI ,MACD and the EMA
Tool Auto Modify SLTP – Protect Your Trades, Optimize Your Strategy In trading, risk is always present. Just one forgotten SL/TP can turn a promising trade into a loss. Even experienced traders occasionally make mistakes. That’s why Tool Auto Modify SLTP was created – to keep you protected and let you focus on your strategy. Key Features: Manage Orders for All Symbols: Monitor and adjust SL/TP for all your trading pairs. Three Flexible Risk Modes: Point-Based: Set fixed SL/TP distances. Account
Margin Call Shield – Defend Your Margin on Your Terms Margin Call Shield is a tool for MetaTrader 5 traders who want to decide for themselves which open positions are closed during margin call situations before the platform does so automatically based on its internal rules. By default, the broker or platform decides which positions to close, often using undisclosed algorithms. Margin Call Shield lets you set this order according to your own strategy. Why Was Margin Call Shield Created? In a mar
Trade Panel Manager and Assistant 2026 - “The trading tool we all wish existed when we started trading.” Comes with 3 expansive panels: Main / Grid / Minipanel Trade panel manager is a comprehensive trade management panel for MetaTrader 5, designed for traders who want full control over their entries, exits, and risk without leaving the chart. It handles everything from a single market order to complex grid setups, all through a clean drag-and-drop interface built directly on the chart. The ma
Executor Trader Panel (Sta) - Standard Version   is a multi-functional trading tool designed for traders. The trading panel integrates over 30 individual functions and more than 10 combined functions, providing traders with a highly flexible operational approach. Main Features of the Executor: Instant Connection Status:   Immediately know if the connection with the broker is lost. Time Synchronization:   Instantly know the current local time and the time of the trading server. Universal Compati
Expert TP SL v04 - Professional Trading Assistant with AI Motivation System Advanced manual trading tool with automatic risk management, overtrading protection, and intelligent psychological support for disciplined trading. PRODUCT OVERVIEW Expert TP SL v04 is a comprehensive trading assistant designed for manual traders who want to maintain emotional discipline while automating risk calculations. This isn't just another order placement tool - it's a complete trading psychology system that pr
このプロダクトを購入した人は以下も購入しています
Trade Assistant MT5
Evgeniy Kravchenko
4.42 (211)
取引 ごとのリスクの 計算、新規注文 の 簡単 な 設置、部分的 な 決済機能 を 持 つ 注文管理、 7 種類 のトレーリングストップなど 、便利 な 機能 を 備 えています 。 追加の資料と説明書 インストール手順   -   アプリケーションの手順   -   デモアカウント用アプリケーションの試用版 ライン機能 チャート上にオープニングライン、ストップロス、テイクプロフィットを表示します。この機能により、新規注文を簡単に設定することができ、注文を出す前にその特徴を確認することができます。   リスク計算 リスク計算機能は、設定されたリスクとストップロス注文のサイズを考慮して、新規注文のボリュームを計算します。ストップロスの大きさを自由に設定できると同時に、設定したリスクを守ることができます。 Lot calc ボタン - リスク 計算 を 有効 / 無効 にします 。 Risk フィールドでは 、必要 なリスクの 値 を 0 から 100 までのパーセンテージまたは 預金通貨 で 設定 します 。 設定」 タブで 、 リスク 計算 の 種類 を 選択 します :「 $ 通
Trade Manager EAへようこそ。これは、取引をより直感的、正確、そして効率的にするために設計された究極の リスク管理ツール です。これは単なるオーダー実行ツールではなく、包括的な取引計画、ポジション管理、リスク管理のためのソリューションです。初心者から上級者、迅速な実行を必要とするスキャルパーまで、Trade Manager EAはあらゆるニーズに対応し、為替、指数、商品、暗号通貨などさまざまな市場で柔軟に対応します。 Trade Manager EAを使用すると、複雑な計算が過去のものになります。市場を分析し、エントリーポイント、ストップロス、テイクプロフィットのレベルをチャート上のラインでマークし、リスクを設定するだけで、Trade Managerが最適なポジションサイズを即座に計算し、SLとTPをピップ、ポイント、口座通貨でリアルタイムに表示します。すべての取引が簡単かつ効果的に管理されます。 主な機能: ポジションサイズ計算機 :定義されたリスクに基づいて取引サイズを瞬時に決定します。 簡単な取引計画 :エントリー、ストップロス、テイクプロフィットを設定するためのド
Local Trade Copier EA MT5
Juvenille Emperor Limited
4.96 (139)
Local Trade Copier EA MT5 による、驚くほど高速な取引コピーを体験してください。1分で簡単にセットアップできるこの取引コピー機は、同じWindowsコンピュータまたはWindows VPS上の複数のMetaTrader端末間で取引をコピーすることができ、0.5秒未満の高速コピースピードを実現します。 初心者であろうとプロのトレーダーであろうと、 Local Trade Copier EA MT5 には、あなたの特定のニーズに合わせてカスタマイズするための幅広いオプションが用意されています。これは、利益の可能性を高めたい人にとって究極のソリューションです。 今すぐ試してみて、これが市場で最も速くて簡単なトレードコピー機である理由を理解してください。 ヒント: デモアカウントで Local Trade Copier EA MT5 デモバージョンをダウンロードして試すことができます: ここ ダウンロードした無料のデモ ファイルを MT5 >> ファイル >> データ フォルダを開く >> MQL5 >> Experts フォルダに貼り付けて、ターミナルを再起動しま
ベータリリース Telegram to MT5 Signal Trader はまもなく正式なアルファ版をリリースします。いくつかの機能はまだ開発中で、小さな不具合に遭遇する可能性があります。問題が発生した場合はぜひご報告ください。皆さまのフィードバックがソフトウェア改善に役立ちます。 Telegram to MT5 Signal Trader は、 Telegram のチャンネルやグループからの取引シグナルを自動的に MetaTrader 5 にコピーする強力なツールです。 パブリックおよびプライベートの両方のチャネルに対応し、複数のシグナル提供元を複数のMT5口座に接続可能です。ソフトウェアは高速で安定し、すべての取引を細かく制御できます。 インターフェースは直感的で、ダッシュボードとチャートは見やすく設計されており、リアルタイムで動作状況をモニターできます。 必要環境 MQL の制限により、EA は Telegram と通信するためのデスクトップアプリが必要です。 インストーラーは公式の インストールガイド にあります。 主な機能 マルチプロバイダー: 複数の Telegram
TradePanel MT5
Alfiya Fazylova
4.87 (155)
Trade Panelは多機能なトレーディングアシスタントです。アプリには手動取引用の50以上のトレーディング機能が搭載されており、ほとんどの取引作業を自動化することができます。 購入前に、デモアカウントでアプリのデモ版をテストすることができます。デモアカウント用のアプリの試用版をダウンロードするには、次のリンクをご利用ください: https://www.mql5.com/en/blogs/post/750865 。 完全な手順 こちら 。 取引。 ワンクリックで取引操作を行うことができます: リスクを自動計算して指値注文やポジションを開く。 複数の注文やポジションをワンクリックで開く。 注文のグリッドを開く。 保留中の注文やポジションをグループごとに閉じる。 ポジションの方向を反転(Buyを閉じてSellを開く、またはSellを閉じてBuyを開く)。 ポジションをブロックする(不足している量のポジションを開くことでBuyとSellのポジション量を等しくする)。 すべてのポジションを部分的にワンクリックで閉じる。 すべてのポジションの利食い(Take Profit)および損切り(Sto
Farmed Hedge Yield Farming | All Markets (Manual - Hybrid - Semi/Automated EA) MULTI-ASSET SUPPORT Trade any asset available on your broker - Forex: Major, Minor, Exotic pairs - Crypto: BTC, ETH, XRP, SOL, BNB - Stocks: Apple, Tesla, Amazon, Google, etc. - Commodities: Gold, Silver, Oil, Gas - Indices: US30, NAS100, SPX500, DAX40 - Any CFD your broker offers VERIFIED TRADING RESULTS - Farmed Hedge Yield Axi Copy:  https://www.mql5.com/en/signals/2356376 - Farmed Hedge Yield Exn Copy:   https:/
Quant AI Agents is NOT AN Expert Advisor. Quant AI Agents   is a   multi-agent AI trading framework   that turns natural-language strategy prompts into live.  WANT THE SAME RESULTS AS MY LIVE SIGNAL?   Use the exact same brokers I do:   IC MARKETS , IC TRADING   .  Unlike the centralized stock market, Forex has no single, unified price feed.  Every broker sources liquidity from different providers, creating unique data streams. Other brokers can only achieve trading performance equivalent to 60
Premium Trade Manager - MetaTrader 5 向け迅速・規律ある取引管理ツール Premium Trade Manager は、決断に集中しながらパネルがルーティンを担ってくれることを求めるトレーダーのためのツールです。サイジング、発注、分割決済、トレール、ニュース対応、プロップファームの制限管理を、すべての取引で同じ規律ある方法で実行します。 MetaTrader 5 用の高速チャート内パネルで、毎回の取引における機械的な作業を一手に引き受けます。方向・銘柄・タイミングはあなたが決める。パネルはリスクに基づいてポジションサイズを計算し、ストップとターゲットを設定した状態で注文を出し、分割決済でスケールアウトし、残りをトレールします。ファンデッドトレーダーにはさらに一歩踏み込んだ機能があります。主要 8 社のプロップファームの実際のルールを内蔵し、各制限まで今どれだけの余裕があるかをリアルタイムで表示し、ハードリミットを超える注文をブロックします。 購入前に実際に触れて試せます。 インタラクティブなウォークスルーでは、ブラウザ上でライブパネルをそのまま操作で
Trade Dashboard simplifies how you open, manage, and control your trades, with built-in lot size calculation. It allows you to execute trades, manage risk, and control positions directly on the chart, with tools such as partial close, breakeven, and trailing stop. Designed to reduce manual work and help you stay focused on your trading decisions. A demo version is available for testing. Detailed explanations of features are provided within the MQL5 platform. Installation instructions are include
Exp COPYLOT CLIENT for MT5
Vladislav Andruschenko
3.91 (33)
MetaTrader 5 用のプロフェッショナル取引コピー機 MetaTrader 向けの高速・高性能・信頼性の高い 取引コピー機 です。 COPYLOT は、MT4 と MT5 のターミナル間で Forex 取引をコピーでき、 Hedge 口座と Netting 口座の両方に対応しています。 COPYLOT MT5 版の対応構成: - MT5 Hedge → MT5 Hedge - MT5 Hedge → MT5 Netting - MT5 Netting → MT5 Hedge - MT5 Netting → MT5 Netting - MT4 → MT5 Hedge - MT4 → MT5 Netting MT4 版 完全な説明 + DEMO + PDF 購入方法 インストール方法 ログファイルの取得方法 テストと最適化の方法 Expforex のすべての製品 MT4 ターミナルへのコピーも可能です(MT4 → MT4、MT5 → MT4): COPYLOT CLIENT for MT4 COPYLOT は、2台、3台、さらには10台のターミナル間で同時に動作できる、プロフェッ
Power Candles Strategy Scanner - 自動最適化型マルチシンボル設定ファインダー パワーキャンドル・ストラテジー・スキャナーは 、パワーキャンドル・インジケーターを駆動するのと全く同じ自己最適化エンジンを、マーケットウォッチに登録されているすべての銘柄に対して並行して実行します。1つのパネルで、現在統計的に取引可能な銘柄、各銘柄で勝率の高い戦略、最適なストップロス/テイクプロフィットの組み合わせが表示され、新たなシグナルが発生した瞬間に通知が届きます。 このツールは、Stein Investmentsのエコシステムの一部です。  18種類以上のツールをすべて閲覧し、AIを活用したセットアップの推奨を受け取り、  https://stein.investments でコミュニティに参加しましょう 市場動向を網羅。銘柄ごとに3,000件以上の自動最適化。2種類のアラート。ワンクリックでチャートを切り替えて即座にアクション。 なぜこれが必要なのか 多くのマルチ銘柄スキャナーは、 価格の動き (ボラティリティ、変動率、銘柄ごとのRSI)を表示するだけです。それ
MT5 to Telegram Signal Provider は、Telegramのチャット、チャンネル、またはグループに 指定された シグナルを送信することができる、完全にカスタマイズ可能な簡単なユーティリティです。これにより、あなたのアカウントは シグナルプロバイダー になります。 競合する製品とは異なり、DLLのインポートは使用していません。 [ デモ ] [ マニュアル ] [ MT4版 ] [ Discord版 ] [ Telegramチャンネル ]  New: [ Telegram To MT5 ] セットアップ ステップバイステップの ユーザーガイド が利用可能です。 Telegram APIの知識は必要ありません。必要な全ては開発者から提供されます。 主な特長 購読者に送信する注文の詳細をカスタマイズする機能 例えば、Bronze、Silver、Goldといった階層型のサブスクリプションモデルを作成できます。Goldサブスクリプションでは、すべてのシグナルが提供されます。 id、シンボル、またはコメントによって注文をフィルターできます 注文が実行されたチャート
Copy Cat More Trade Copier MT5 (コピーキャット MT5) は、今日の取引課題に対応して設計されたローカルトレードコピーシステムと完全なリスク管理・実行フレームワークです。プロップファームのチャレンジから個人ポートフォリオ管理まで、堅牢な実行、資本保護、柔軟な設定、高度な取引処理の組み合わせで、あらゆる状況に適応します。 コピーシステムはマスター(送信側)とスレーブ(受信側)の両方のモードで動作し、成行注文と指値注文、取引修正、部分決済、両建て決済操作のリアルタイム同期を行います。デモ口座とライブ口座、取引ログインまたは投資家ログインの両方に対応し、EA、ターミナル、またはVPSが再起動してもパーシスタント取引メモリシステムを通じて復旧を保証します。複数のマスターとスレーブをユニークIDで同時に管理でき、ブローカー間の違いはプレフィックス/サフィックス調整またはカスタムシンボルマッピングを通じて自動的に処理されます。 マニュアル/設定  | Copy Cat More MT4 | チャンネル  特別機能: 設定が簡単 — わずか30秒で完了(ビデオをご覧
ManHedger MT5
Peter Mueller
4.83 (6)
THIS EA IS A SEMI-AUTO EA, IT NEEDS USER INPUT. Manual & Test Version Please TEST this product before BUYING  and watch my video about it. The price of the ManHedger will increase to 250$ after 20 copies sold. Contact me for user support or bug reports or if you want the MT4 version! MT4 Version  I do not guarantee any profits or financial success using this EA. With this Expert Advisor, you can: Implement your own Zone Recovery strategy to capitalize on trending markets. Create Grid trading s
The product will copy all telegram signal to MT5 ( which you are member) , also it can work as remote copier.  Easy to set up, copy order instant, can work with almost signal formats, image signal,  s upport to translate other language to English Work with all type of channel or group, even channel have "Restrict Saving Content", work with  multi channel, multi MT5 Work as remote copier: with signal have ticket number, it will copy exactly via ticket number. Support to backtest signal. How to s
Trade Manager は、リスクを自動的に計算しながら、取引を迅速に開始および終了するのに役立ちます。 過剰取引、復讐取引、感情的な取引を防止する機能が含まれています。 取引は自動的に管理され、アカウントのパフォーマンス指標はグラフで視覚化できます。 これらの機能により、このパネルはすべてのマニュアル トレーダーにとって理想的なものとなり、MetaTrader 5 プラットフォームの強化に役立ちます。多言語サポート。 MT4バージョン  |  ユーザーガイド + デモ Trade Manager はストラテジー テスターでは機能しません。 デモについてはユーザーガイドをご覧ください。 危機管理 % または $ に基づくリスクの自動調整 固定ロットサイズを使用するか、ボリュームとピップに基づいた自動ロットサイズ計算を使用するオプション RR、Pips、または価格を使用した損益分岐点ストップロス設定トレーリングストップロス設定 目標に達したときにすべての取引を自動的に終了するための 1 日あたりの最大損失 (%)。 過度のドローダウンからアカウントを保護し、オーバートレードを防ぎます
YuClusters
Yury Kulikov
4.93 (43)
Attention: You can view the program operation in the free version  YuClusters DEMO .  YuClusters is a professional market analysis system. The trader has unique opportunities to analyze the flow of orders, trade volumes, price movements using various charts, profiles, indicators, and graphical objects. YuClusters operates on data based on Time&Sales or ticks information, depending on what is available in the quotes of a financial instrument. YuClusters allows you to build graphs by combining da
この製品は、ニュースタイム中にすべてのエキスパートアドバイザーと手動チャートをフィルタリングするため、急激な価格変動によるマニュアルトレードのセットアップの破壊や他のエキスパートアドバイザーによって入力された取引について心配する必要はありません。この製品には、ニュースのリリース前にオープンポジションとペンディングオーダーを処理できる完全な注文管理システムも付属しています。 The News Filter  を購入すると、将来のエキスパートアドバイザーのためにビルトインのニュースフィルターに頼る必要はなく、今後はすべてのエキスパートアドバイザーをここからフィルタリングできます。 ニュース選択 ニュースソースは、Forex Factoryの経済カレンダーから取得されます。 USD、EUR、GBP、JPY、AUD、CAD、CHF、NZD、CNYなど、任意の通貨数に基づいて選択できます。 Non-Farm(NFP)、FOMC、CPIなどのキーワード識別に基づいて選択することもできます。 影響レベルによってフィルタリングするニュースを選択することができ、低、中、高の影響範囲から選択できます。
HINN MAGIC ENTRY – the ultimate tool for entry and position management! Place orders by selecting a level directly on the chart! full description   ::  demo-version  :: 60-sec-video-description Key features: - Market, limit, and pending orders - Automatic lot size calculation - Automatic spread and commission accounting - Unlimited partitial take-profits  - Breakeven and trailing stop-loss and take-profit  functions - Invalidation leves - Intuitive, adaptive, and customizable interface - Works
Seconds Chart - MetaTrader 5で秒足チャートを作成するユニークなツールです。 Seconds Chart を使用すると、秒単位のタイムフレームでチャートを構築でき、標準的な分足や時間足チャートでは得られない柔軟性と分析精度を実現します。例えば、 S15 は15秒足を表します。カスタムシンボルをサポートしているインジケーターやEAをすべて使用できます。標準的なチャートと同様に便利に操作できます。 標準的なツールとは異なり、 Seconds Chart は超短期のタイムフレームでも高い精度と遅延なく作業できるように設計されています。 Seconds Chartの利点 1秒から900秒 までのタイムフレームをサポート。 組み込みのティックデータベースにより、ヒストリカルデータを 瞬時にロード 。 リアルタイムでデータが更新され、 遅延やラグなし 。 複数の秒足チャートを同時に作成可能。 Seconds Chartが最適な用途 スキャルピング や高頻度取引。 正確なエントリーとエグジット。 短期タイムフレームでの取引戦略のテスト。 タイムフレームの設定 デフォルトの設
Poc Breakout Signal: The Ultimate Institutional Order Flow & Price Action System Elevate your trading with Poc Breakout, a comprehensive technical analysis tool designed to bridge the gap between retail trading and institutional market understanding. This all-in-one system combines powerful Buy/Sell signals, advanced Volume Profile analysis, real-time Order Flow (Depth of Market), and critical macroeconomic data to give you a clear, unambiguous edge in the markets. Poc Breakout Signal decodes c
TelegramからMT5へ: 究極のシグナルコピーソリューション Telegram to MT5 を使えば、取引がシンプルになります。DLL を必要とせず、Telegram のチャンネルやチャットから MetaTrader 5 プラットフォームに取引シグナルを直接コピーできる最新ツールです。この強力なソリューションは、正確なシグナル実行、豊富なカスタマイズオプション、時間の節約、そして効率性の向上を実現します。 [ Instructions and DEMO ] 主な特徴 直接的なTelegram API統合 電話番号とセキュアコードで認証します。 ユーザーフレンドリーな EXE ブリッジを通じてチャット ID を簡単に管理できます。 複数のチャネル/チャットを追加、削除、更新して、同時に信号をコピーします。 高度なフィルターによる信号解析 例外的な単語 (例: 「レポート」、「結果」) を含む不要な信号をスキップします。 柔軟な SL および TP 形式 (価格、ピップ、ポイント) をサポートします。 価格ではなくポイントを指定するシグナルのエントリ ポイントを自動的に計算します。
インストール ガイド:  ここをクリック! 複数のエキスパートアドバイザーをまとめて分析する マジックナンバーによるEA結果の比較 収益性とドローダウンを追跡する 日付範囲で結果をフィルタリング ビジュアルエクイティカーブと詳細な指標 1分以内に使用可能 EAポートフォリオアナライザー EA ポートフォリオ アナライザーは、 複数のエキスパート アドバイザーのライブ パフォーマンスを 明確かつ構造化された方法で 監視するように設計された プロフェッショナルな分析ツールです。 同じアカウントで複数のEAを運用している場合、それぞれのEAが全体の結果にどのように貢献しているかを把握するのは困難です。EA ポートフォリオアナライザーを使用すると、 マジックナンバーでエキスパートアドバイザーをフィルタリングおよび組み合わせることができるため 、1つのEA、選択したいくつかのEA、またはポートフォリオ全体の パフォーマンスを表示できます 。 これにより、さまざまな EA の組み合わせを 簡単にテストし 、それらのエクイティ カーブがどのように動作するかを確認できるようになります。これにより
DrawDown Limiter
Haidar Lionel Haj Ali
5 (20)
Drawdown Limiter EA You are in the right place if you were searching for Drawdown control, Drawdown limiter, Balance protection, Equity Protection or Daily Drawdown Limit related to Prop Firm, FTMO, or Funded account trading, or if you want to protect your trading account. Have you suffered from controlling your drawdown when trading funded accounts? This EA is meant for you. Prop firms usually set a rule called “Trader Daily Drawdown”, and if it is not respected, you are disqualified.  I am an
Timeless Charts
Samuel Manoel De Souza
5 (6)
️ 50% OFF ends Sunday, May 31 (23:59 GMT) Timeless Charts is an all-in-one trading utility for professional traders. It combines custom chart types such as Seconds Charts and Renko with advanced order flow analysis using Footprints , Clusters , Volume Profiles , VWAP studies, and anchored analysis tools for deeper market insight. Trading and position management are handled directly from the chart through an integrated trade management panel , while Market Replay and Virtual Accounts provide en
EA を買う前に、本当に耐えられるのか、それともバックテストでたまたま良く見えただけなのかを確認してください。 ほとんどのロボットは、見栄えのするバックテストと一緒に売られています。 右肩上がりのカーブ。 良い Profit Factor。 ほとんど疑いのない見た目。 それでも、その多くの EA は、市場がその履歴どおりに動かなくなった瞬間に崩れ始めます。 なぜでしょうか。 それは、バックテストが証明するのは一つだけだからです。 その戦略が、ある特定の価格の流れでは機能したということです。 別の流れでも通用することは証明しません。 頑健であることも証明しません。 もちろん、その EA があなたのお金に値することも証明しません。 なぜなら、あなたが EA を買うのは過去のきれいなカーブを眺めるためではないからです。 変化する市場で使うために買うのです。 AntiOverfit PRO がすること AntiOverfit PRO は、MetaTrader 5 の Expert Advisor が本当にしっかりしているのか、それとも特定の過去データにたまたまうまくはまっているだけなのかを確
Anchor: The EA Manager Run your full EA portfolio without conflicts, without stacked risk, and without watching every chart yourself. Anchor coordinates up to 64 Expert Advisors on a single account so only one trades at a time. Attach Anchor to any chart. Type your EA names and magic numbers in one line. Anchor handles the rest. Built for portfolios. Built for discipline. Built for prop firms. The Problem Running multiple EAs on the same account creates risk. Two gold EAs can open opposite posit
Signal TradingView to MT5 Pro Automator TradingViewとMetaTrader 5間の即時プロフェッショナル実行 TradingViewのシグナル(アラート)とMT5での実際の約定を繋ぐ、最も強固なコミュニケーションブリッジで、取引戦略を自動化します。スピード、柔軟性、そして完璧なリスク管理を求めるトレーダー向けに設計されたこのExpert Advisorは、あらゆるアラートメッセージを正確な成行または指値注文に変換します。 強みと利点 ユニバーサルパーシングエンジン(独自技術): あらゆるアラート形式からデータを自動的に認識し、抽出できる高度なテクノロジー。単一の固定フォーマットに制限されることはありません。システムはシンボル(銘柄)、アクション、価格、SL(ストップロス)、TP(テイクプロフィット)を自動的に理解します。 リアルタイム実行: レイテンシ(遅延)を最小限に抑えるよう最適化された、1秒未満の超高速ポーリング技術。シグナルを受信してから数ミリ秒以内に注文が実行されます。 機関投資家レベルのリスク管理: 以下に基づく自動かつ正確
Footprint Chart Pro — Professional OrderFlow EA for MetaTrader 5 Version 6.34 | Professional tool for real traders | Institutional-Grade Visualization DEMO USERS - PLEASE SELECT EVERY TICK / REAL TICK WHEN TESTING AND YOU HAVE DOWNLOADED HISTORICAL DATA. IF YOU SEE A WAITING SCREEN AND IT IS NOT DOWNLOADING, IT MEANS YOU HAVE LOW HISTORICAL DATA. TRY 1 MIN AND 5 MIN FIRST ON 1 DAY DATA. ONE DAY DATA SHOULD BE THE NEWEST AND MOST CURRENT DATE. PLEASE WAIT UNTIL THE MARKET HAS ROLLED OVER PERIOD.
作者のその他のプロダクト
This indicator is designed for M1 timeframe and shows: Sum of points when the price goes up (Green Histogram). Sum of points when the price goes down (Red Histogram).  In other words, by the number and ratio of bullish points to bearish ones, you can do a technical analysis of the state of the market. If the green histogram prevails over the red one, you can conclude that at the moment the buyers are stronger than the sellers, and vice versa, if the red histogram prevails over the green, the se
This Multi TimeFrame indicator is based on the "Fractals" classical indicator. 2 Inputs: TimeFrame1; TimeFrame2; You can put any available TimeFrame values (from M1 (Period_M1) to MN1 (Period_MN1)) equal or greater ( >= ) than the Period of the current Time Frame. The last Fractals will shown as color lines (Dots Line) of Support and Resistance for the Price moving.
This is a Multi-Time indicator which allows to display RSI and Stochastic indicators from upper timeframes on a single chart. As an example: a single chart EURUSD M5 and RSI (blue line) and Stochastic (yellow line) from H1. Red Histogram is representing Lower trend and Green Histogram is representing Upper trend.
When you put this Multi TimeFrame Parabolic SAR indicator on the chart it will automatically use Parabolic SAR from next available 3 timeframes. Green arrow will show the beginning of Up trend and Red arrow will show the beginning of Down trend. If AlertsEnabled = true, the indicator will show the Alert (message window) with a text like this: "Price going Down on ", Symbol(), " - ", Period(), " min", " price = ", Bid; If eMailEnabled = true the Indicator will send you an eMail with the same text
The zero line is characterized the Flat trend. V-shaped impulse indicates the entrance to the opposite direction. U-shaped impulse = entry orders in the same direction. If AlertsEnabled = true, the indicator will show the Alert (message window) with a text like this: "Price going Down on ", Symbol(), " - ", Period(), " min", " price = ", Bid; If eMailEnabled = true the indicator will send you an eMail with the same text an Alert message with subject: "Trinity-Impolse" (of course you have to chec
The indicator displays the usual Moving Average with input parameters: maPeriod_1; maMethod_1; maAppPrice_1. Then it calculates and displays MA on MA1 with input parameters: maPeriod_2; maMethod_2. Then it calculates and displays MA on MA2 with input parameters: maPeriod_3; maMethod_3. If AlertsEnabled = true the Indicator will show the Alert (message window) with a text like this: "Price going Down on ", Symbol(), " - ", Period(), " min", " price = ", Bid; If eMailEnabled = true the Indicator w
Multi TimeFrame Indicator "MTF CCI Trigger" based on the Commodity Channel Index from the upper TF (input parameter "TimeFrame") yellow line. Aqua line is representing ATR envelopes from the current TF. Green and Red arrows is triggered by CCI and represented UP and DOWN trends accordingly.
The BBImpulse indicator is based on the standard Moving Average indicator. You have MA input parameters: maPeriod - Moving Average period; maMODE - Moving Average mode (0 = MODE_SMA; 1 = MODE_EMA; 2 = MODE_SMMA; 3 = MODE_LWMA); maPRICE - Applied price (0=PRICE_CLOSE; 1=PRICE_OPEN; 2=PRICE_HIGH; 3=PRICE_LOW; 4=PRICE_MEDIAN; 5=PRICE_TYPICAL; 6=PRICE_WEIGHTED). Green Histogram is representing an UP-trend, Red Histogram is representing a Down-trend.
Multi TimeFrame indicator MTF ADX with Histogram shows ADX indicator data from the TF by your choice. You may choose a TimeFrame equal or greater than current TF. Yellow line is representing a price trend from the upper TF. Green line is representing +DI from the upper TF. Red line is representing -DI from the upper TF. Green histogram is displaying an Up-trend. Red histogram is displaying a Down-trend.
This Indicator creates 2 white lines based on Exponential Moving Averag e of High and Low prices. You can regulate how many bars will be involved in the calculation with input parameter HL_Period. Red and Blue arrows are displaying the moment to go Short and Long trades accordingly.
The most common way to interpreting the price Moving Average is to compare its dynamics to the price action. When the instrument price rises above its Moving Average, a buy signal appears, if the price falls below its moving average, what we have is a sell signal. To avoid a spontaneous entries one may use this update from Moving Average Indicator = Stepper-MA.
Envelopes technical Indicator is formed with two Moving Averages one of which is shifted upward and another one is shifted downward. Envelopes define the upper and the lower margins of the price range. Signal to sell appears when the price reaches the upper margin of the band; signal to buy appears when the price reaches the lower margin. To avoid a spontaneous entries one may use this update from Envelopes Indicator = Envelopes-Stepper.
The interpretation of the Bollinger Bands is based on the fact that the prices tend to remain in between the top and the bottom line of the bands. Abrupt changes in prices tend to happen after the band has contracted due to decrease of volatility; If prices break through the upper band, a continuation of the current trend is to be expected; If the pikes and hollows outside the band are followed by pikes and hollows inside the band, a reverse of trend may occur; The price movement that has starte
Fibonacci sequence is defined by integer sequence: 0, 1, 1, 2, 3, 5, 8, 13, 34, 55, 89, 144, ... By definition, it starts from 0 and 1, the next number is calculated as a sum of two previous numbers. Instead of the standard moving average, the indicator uses the caluclation of average price in form: Bar0 + Bar1 + Bar2 + Bar3 + Bar5 + Bar8 + Bar13 +... Input parameters:  FiboNumPeriod (15) - Fibonacci period; nAppliedPrice (0) - applied price (PRICE_CLOSE=0; PRICE_OPEN=1; PRICE_HIGH=2; PRICE_LOW=
This indicator present a main Moving Average line with input parameters maPeriod_1, maMethod_1 and maAppPrice_1. The second line will be a calculation of the Moving Average data of a first line with input parameters maPeriod_2, maMethod_2. The third line will be a calculation of the Moving Average data of a second line with input parameters maPeriod_3, maMethod_3. To avoid a spontaneous entries one may use this indicator-stepper.
This indicator (as almost all others) is based on classical Moving Averages. It shows the Average Bar under the current bar colored in aqua or over the current bar colored in orange. Input Parameters: ma_Period and ma_Method. The Average Bar maybe helpful to predict where the price will move in the nearest future. Of course, this "near future" depends of the current time frame.
Buy when the market is falling and sell when the market is rising. When the market is moving down you start observing and looking for buy signals. When the market is moving up you start looking for sell signals. This indicator points to the moments to Buy (Blue arrow) and to Sell (Orange arrow). Two input parameters: barsNumber and step for optimization (depending on symbol and Time Frame).
This indicator shows: A green light in case the price goes up; A red light in case the price goes down; A yellow light in case there are a sideways trend. A sideways trend is the horizontal price movement that occurs when the forces of supply and demand are nearly equal. This typically occurs during a period of consolidation before the price continues a prior trend or reverses into a new trend
This indicator is created for M1 timeframe. It shows how many ticks has occurred during current minute and ( after the slash) the sum of points Up (aqua color) and Down (orange color). In times of a high trading activity a grow up number of ticks Up and Down will signal of a big move of the price in the near future. In times of a high trading activity a grow up number of sum of points Up and Down will signal of a big move of the price in the near future too.
Two yellow lines. This is similar to classical Envelopes but with automatic deviation. The Envelopes indicator is   a tool that attempts to identify the upper and lower bands of a trading range. Aqua line. This is a classical Commodity Channel Index added to the Envelopes on the chart, not in a separate window. The Commodity Channel Index ( CCI ) is a technical   indicator   that measures the difference between the current price and the historical average price.
Probability deals with the likelihood of an event happening.   Forex   probability indicates a possibility at a specific time. This is because the forex market is highly volatile, and predicting future events affecting it is impossible. This indicator will show a positive number above the current High or negative number under the current Low as a probability of the trend. Higher time frames usually show a higher probability, even more then 100%.
Envelopes is an excellent indicator when the market is trending. Open Long position when the ClosePrice crossed the upper Aqua band. Close Long position when the Price crossed the upper Yellow band moving down. Open Short position when the ClosePrice crossed the lower Aqua band. Close Short position when the Price crossed the lower Yellow band moving up.


Moving Average Bars is a self-explanatory indicator with one input parameter: nPeriod. When the previous Price Close is above the previous indicator Bar, the probability to go Long is very high.   When the previous Price Close is under the previous indicator Bar, the probability to go Short is very high.
This indicator is based on the same idea as https://www.mql5.com/en/market/product/2406 , but instead of Average Bars it uses series or Fibonacci sequence. When the previous Price Close is above the previous indicator Bar, the probability to go Long is very high. When the previous Price Close is under the previous indicator Bar, the probability to go Short is very high.
This indicator is based on two ideas: Correlations between 5 main currency pairs: EURUSD, GBPUSD, USDCHF, USDJPY, USDCAD; US Dollar Index = the value of the United States dollar relative to a basket of foreign currencies. The use of the indicator is the same as classical  Commodity Channel Index  (CCI) indicator. CCI is calculated with the following formula:  (Typical Price - Simple Moving Average) / (0.015 x Mean Deviation) (Typical Price - Simple Moving Average) / (0.015 x Mean Deviation)
A  tick  is a measure of the minimum upward or downward movement in the  price  of a security. A  tick  can also refer to the change in the  price  of a security from one trade to the next trade.  This indicator will show amounts of ticks when the price goes up and down. This indicator is designed for M1 time frame and shows: Sum of points when the price goes up (Green Histogram). Sum of points when the price goes down (Red Histogram). 
This indicator is a combination of 2 classical indicators MA and RVI. The Relative Vigor Index (RVI) is a momentum indicator used in technical analysis that measures the strength of a trend by comparing a security's closing price to its trading range while smoothing the results using a simple moving average   The input parameter  counted_bars  determines how many bars the indicator's lines will be visible. The input parameter MaRviPeriod  is used for MA and RVI calculation.
This indicator is a combination of 2 classical indicators: MA and Force Index. The input parameter  counted_bars  determines on how many bars the indicator lines will be visible. The input parameter  MaForcePeriod  is used for MA and Force calculation. You may go Long if the current price crossed Up the Ribbon (HISTOGRAM)  and you may go Short if the current price crossed Down the Ribbon (HISTOGRAM)
This indicator is a combination of 2 classical indicators: MA and CCI. Two moving averages form Upper and Lower bands. The input parameter  counted_bars  determines on how many bars the indicator's lines will be visible. The input parameter  barsNum  is used for MA and CCI calculation.
This indicator is using 2 classical indicators: Commodity Channel Index from the higher TF (which you may change using input parameter TimeFrame ) and Average True Range from the current TF. The Green ribbon indicates the upper trend and the Red ribbon indicates the down trend. Buy when the Yellow line crosses the Upper bound (Aqua line). Sell when the Yellow line crossover the Lower bound (Aqua line).
フィルタ:
レビューなし
レビューに返信