Period Breakout Indicator
- インディケータ
- バージョン: 1.0

Overview
The Period Breakout Indicator is a versatile tool designed for traders seeking to identify breakout opportunities based on customizable time periods. This indicator automatically determines the highest and lowest prices within a user-defined period, allowing you to tailor it precisely to your trading strategy.
Key Features
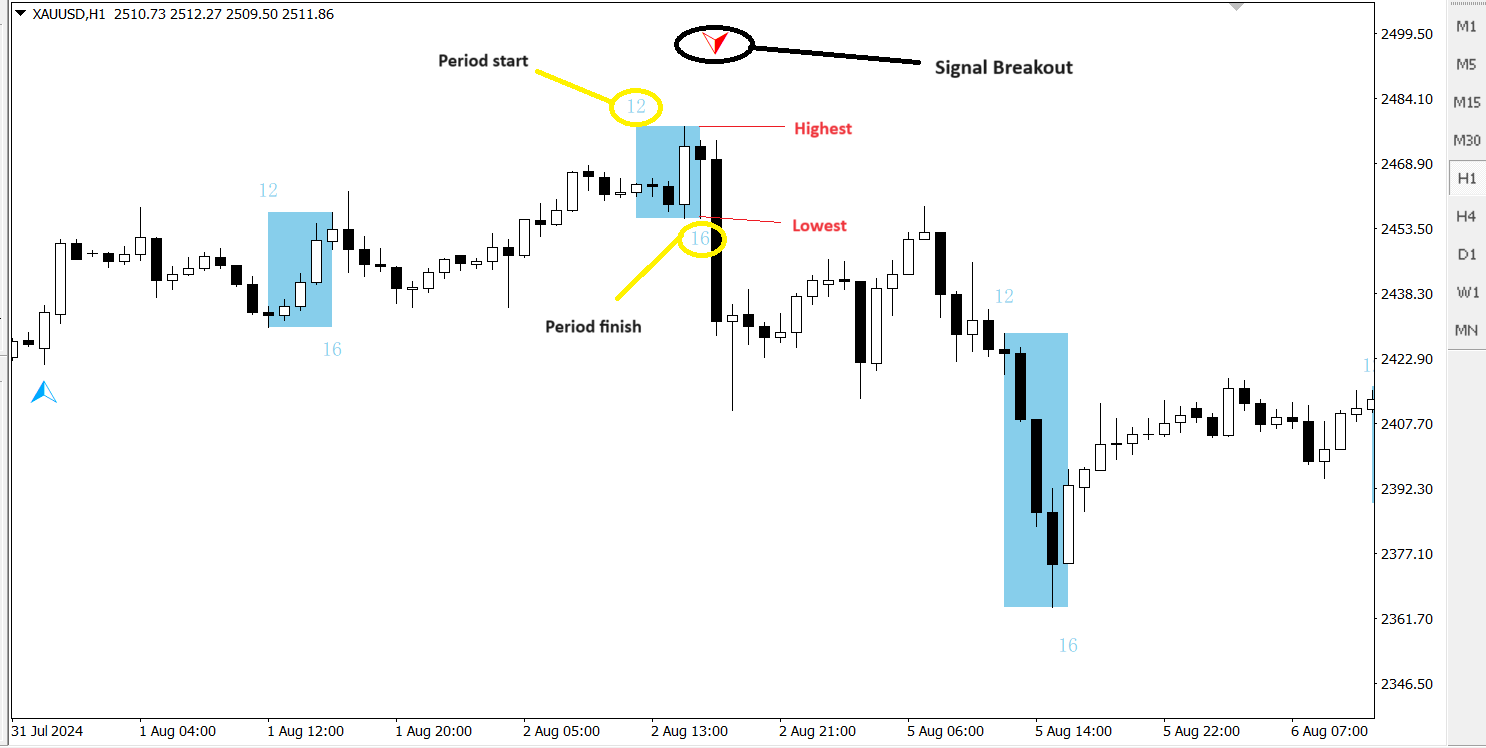
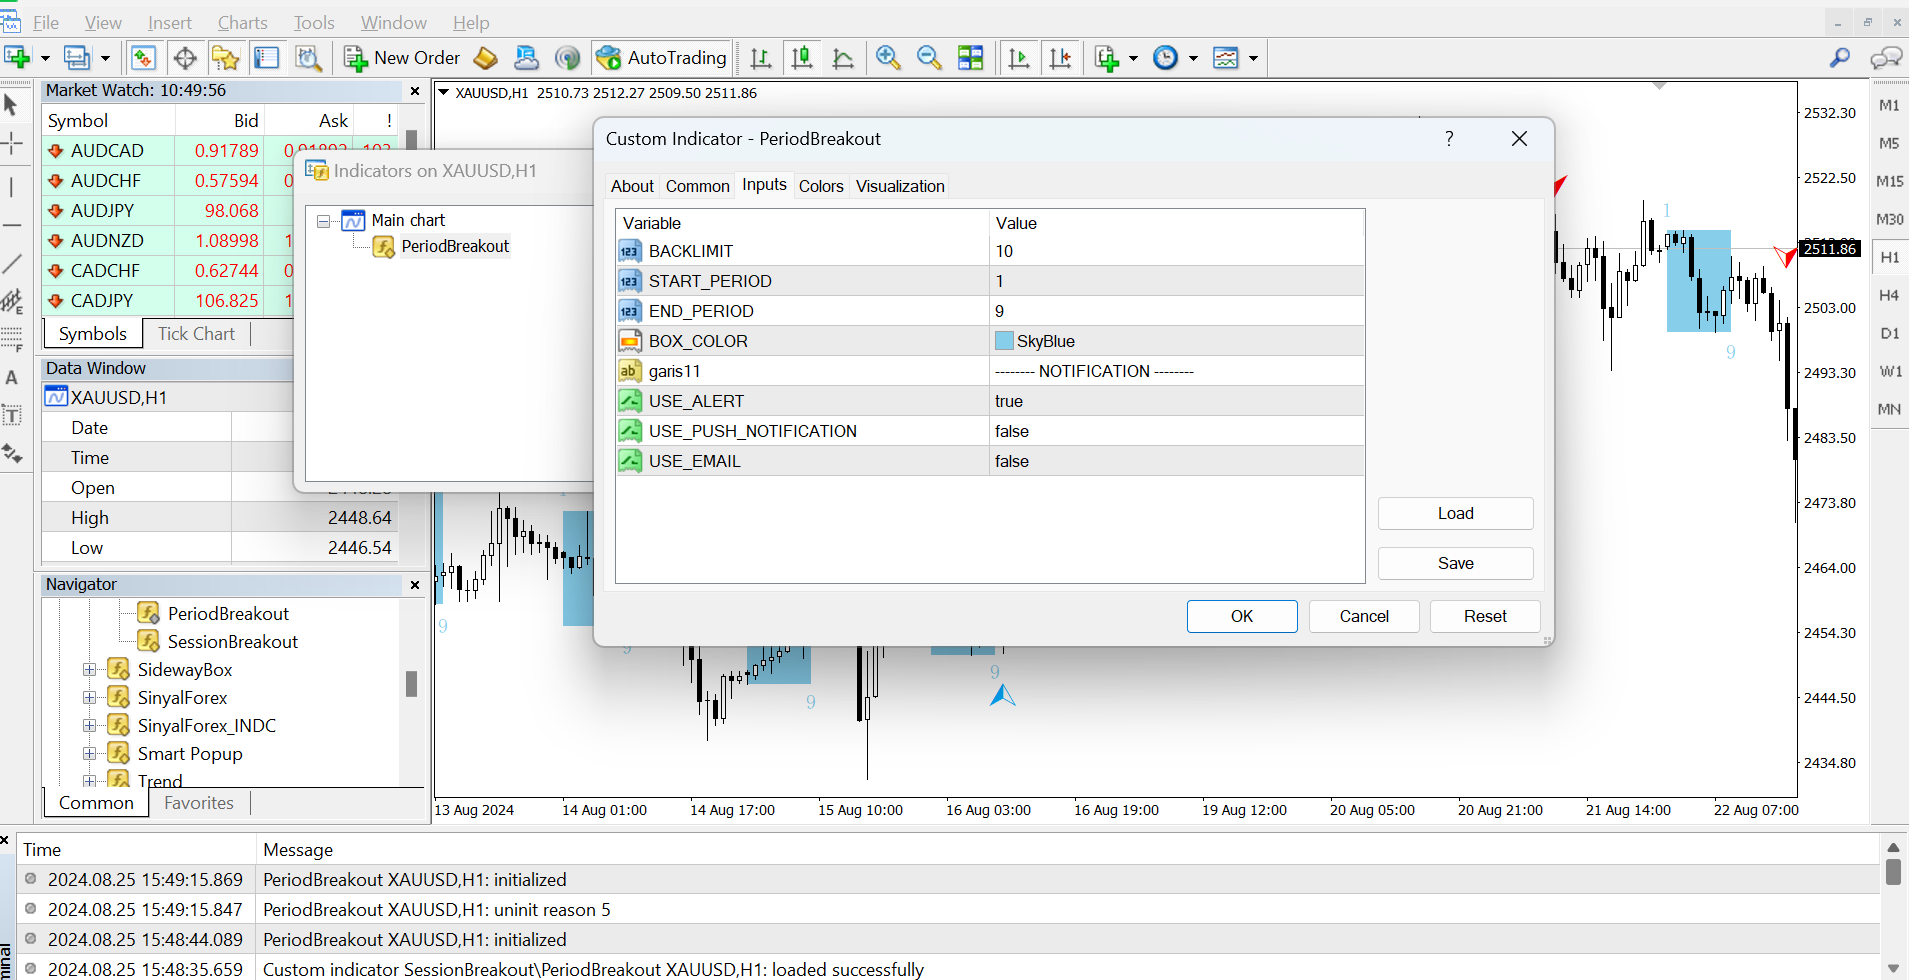
- Customizable Time Periods: Define the start and end times based on your preferred trading hours or any specific period. The indicator will then calculate the highest and lowest prices within that timeframe.
- Breakout Detection: The indicator actively monitors price movements and instantly alerts you when the price breaks out above the period high or below the period low, signaling potential trading opportunities.
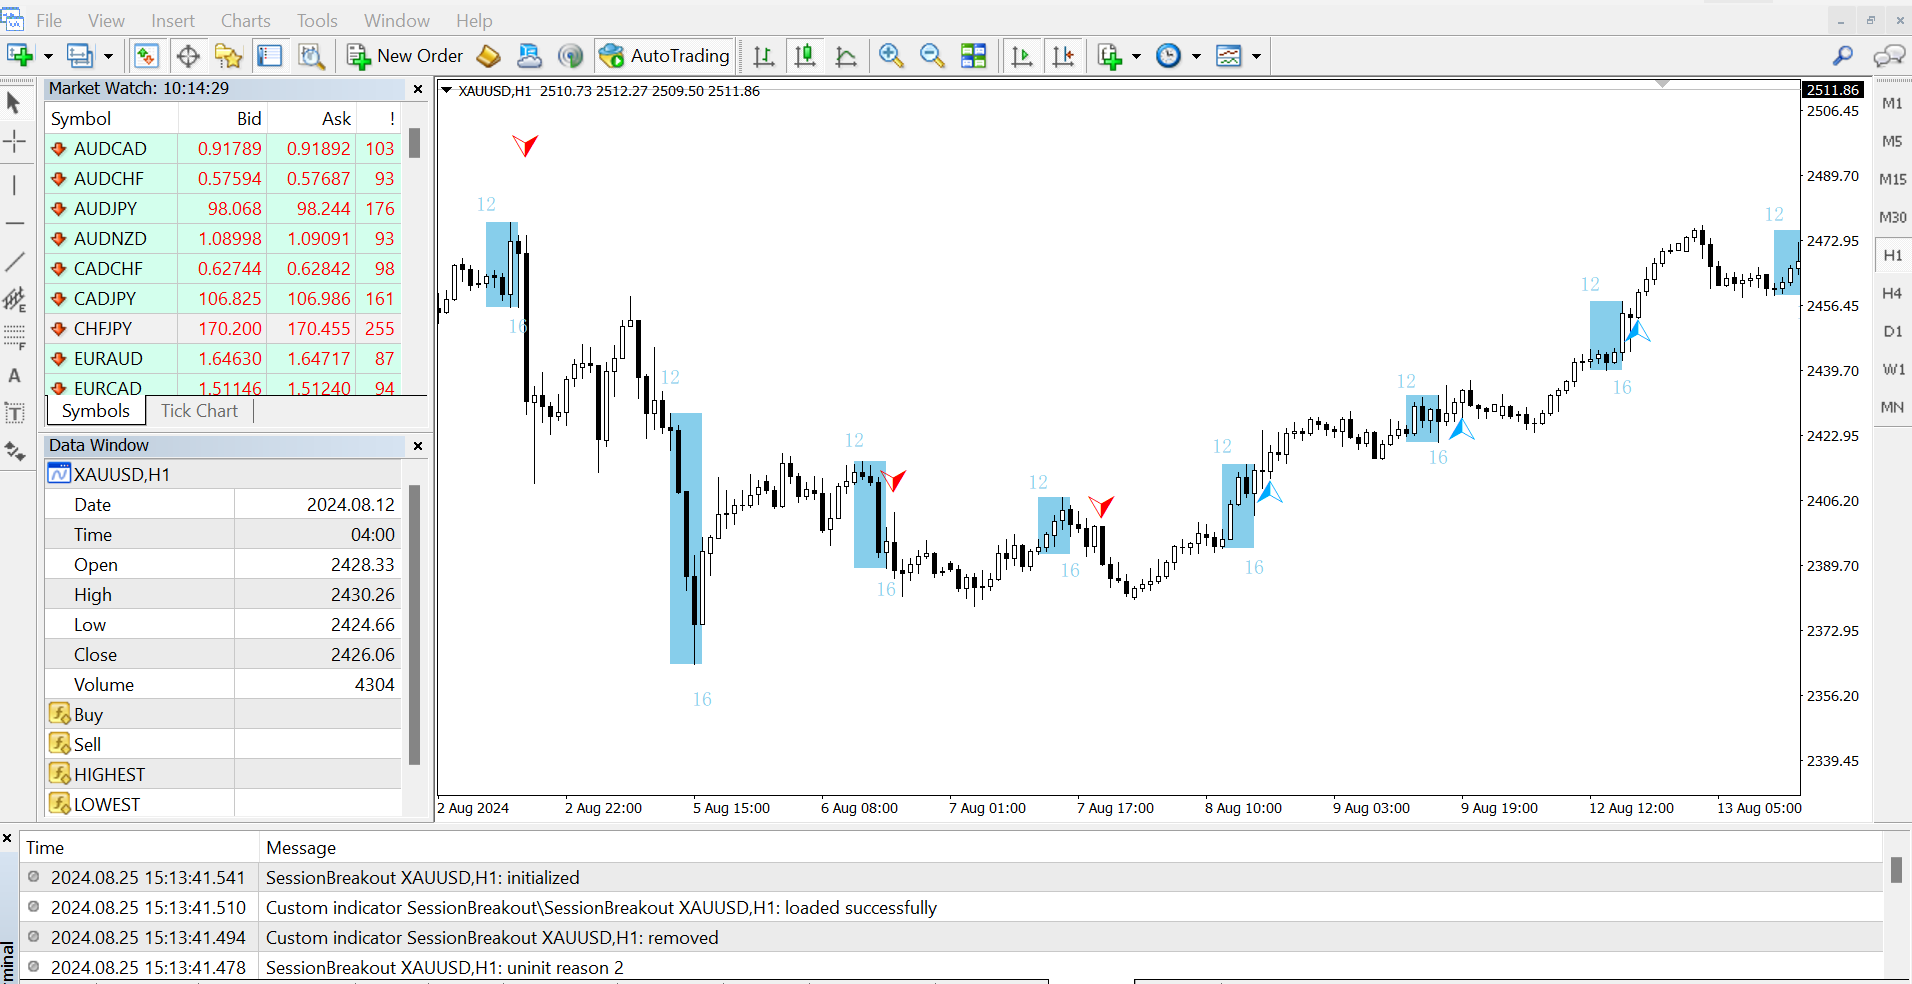
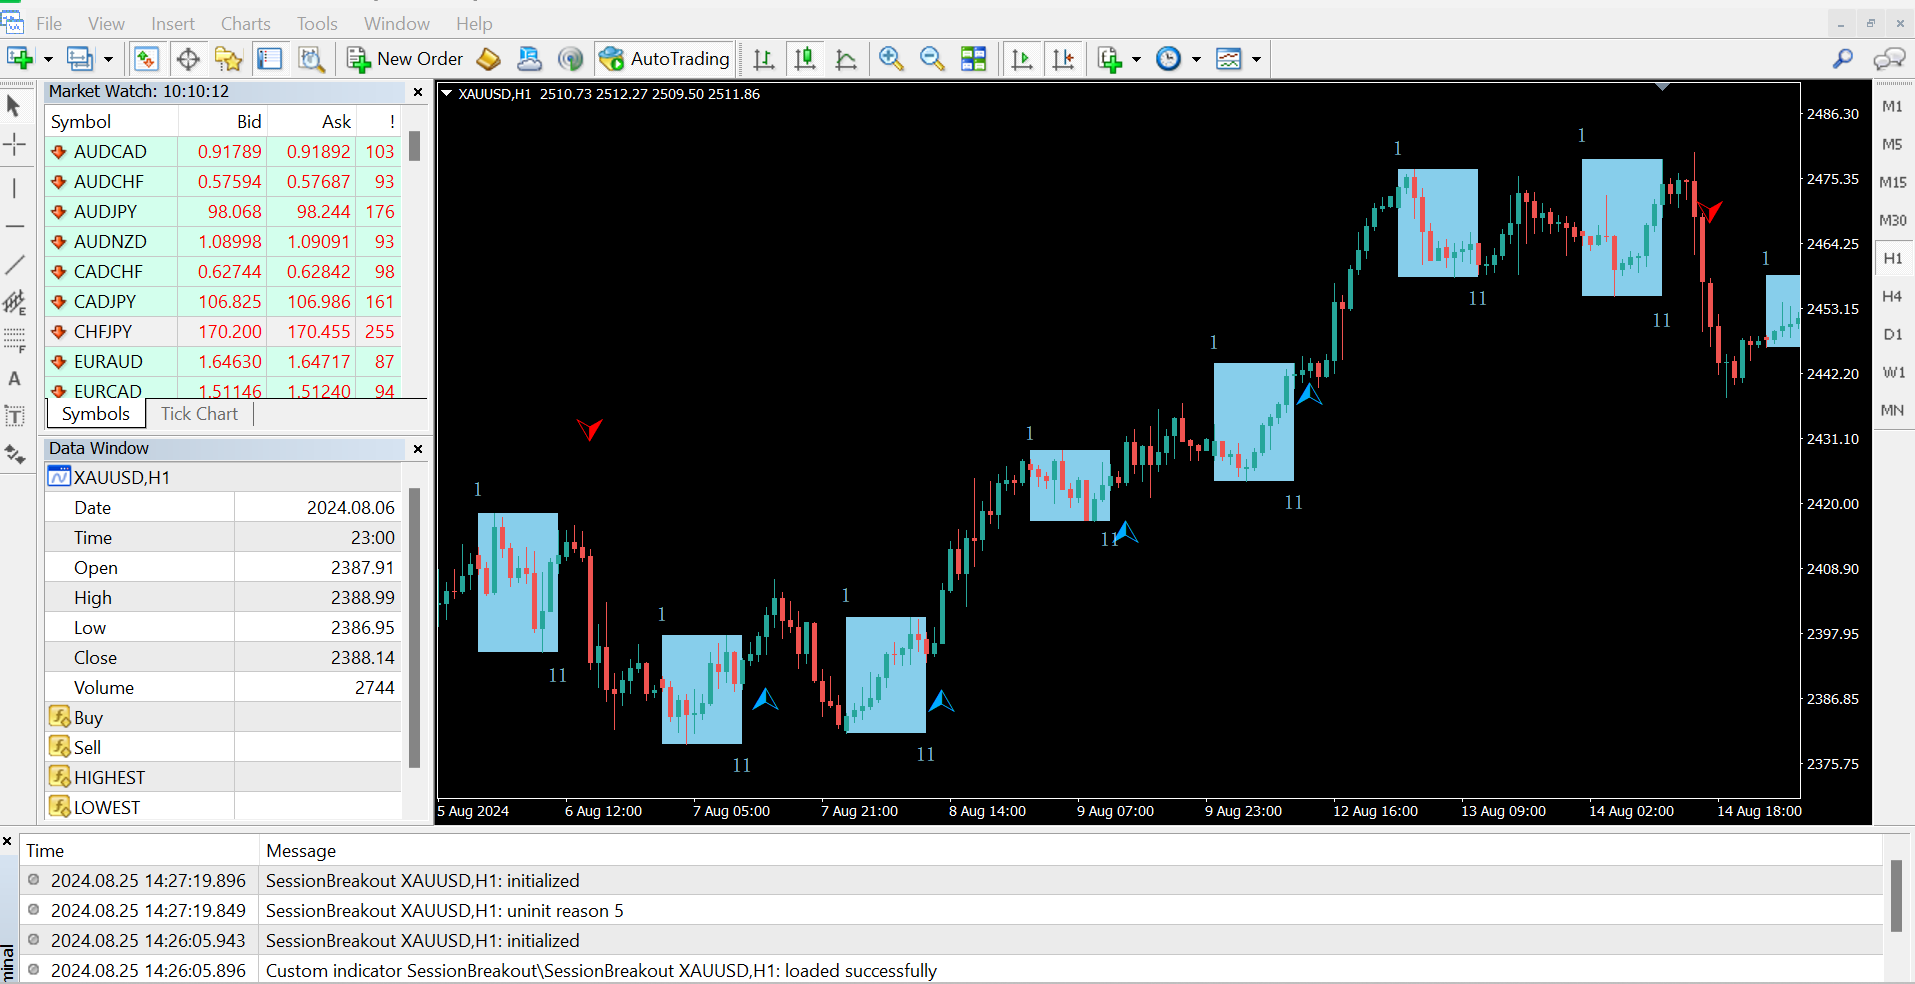
- Clear Visuals: The high and low levels are clearly marked on the chart, making it easy to see breakout levels at a glance.
- User-Friendly Interface: Simple and intuitive settings allow you to configure the indicator quickly, making it accessible for both novice and experienced traders.
Whether you are trading during specific market hours or analyzing custom timeframes, the Period Breakout Indicator provides you with critical information needed to capitalize on breakout strategies. This indicator is a must-have for traders looking to enhance their market entry and exit decisions with precision and confidence.
We also have an EA version of this indicator. If you're interested, please click the link here : https://www.mql5.com/en/market/product/122427

Muy buen indicador. Gracias.