Trend Power for MT5
- インディケータ
- バージョン: 1.30
- アップデート済み: 8 1月 2026
- アクティベーション: 5

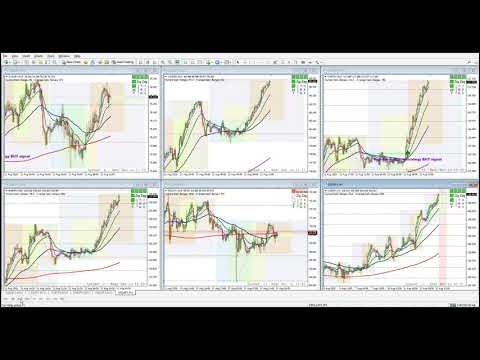
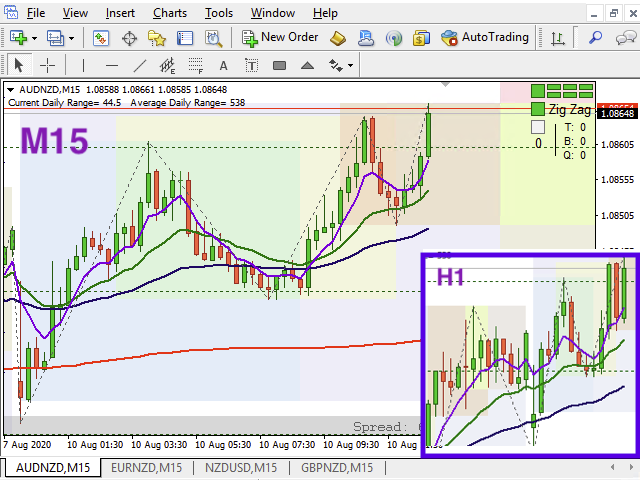
Trend Power Indicator is an indicator which helps to identify trend direction and its power by using moving averages ZigZag pattern and correlations of tradable instruments. It provides trend power data with user-friendly interface which can be read easily and fast.
This indicator by default is configured for trading of Adam Khoo's (Piranhaprofit) strategies. It saves mass of time for searching of tradable pairs by his strategies. It indicates when all required moving averages are alignment (Price > 6EMA > 18EMA > 50EMA > 200SMA and so on). Also, it indicates number of correlated pairs by moving averages alignment.
Trend Power Indicator supports many powerful features:
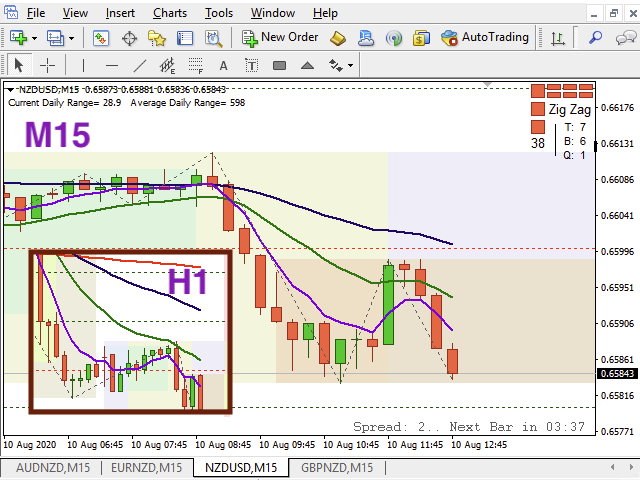
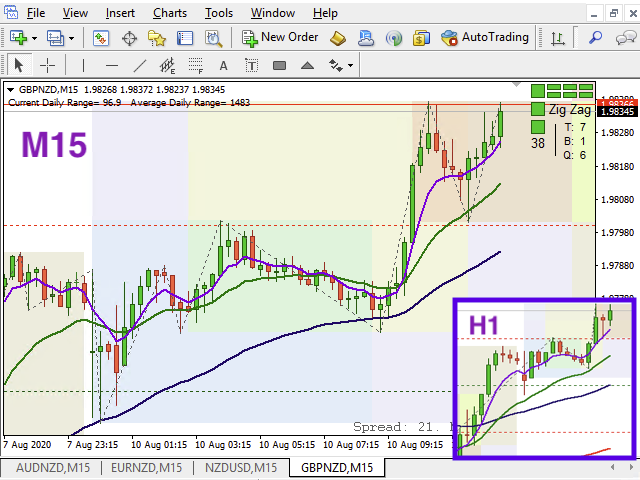
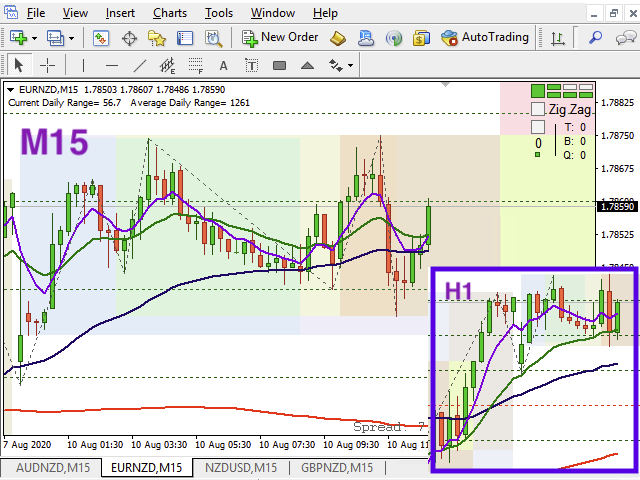
- Trend direction identification by moving averages alignment at trading timeframe and higher timeframe;
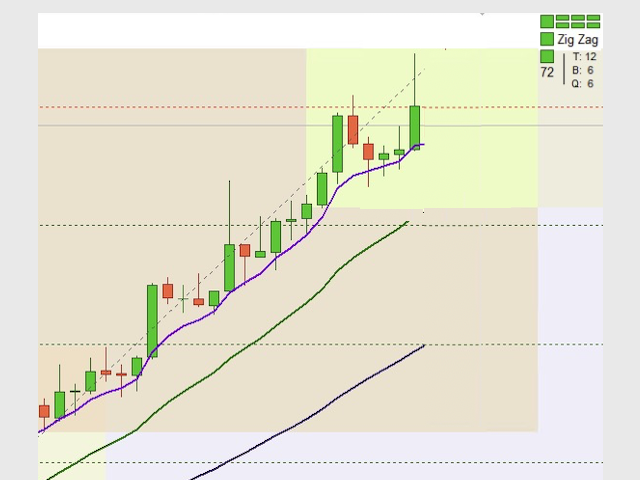
- Trend power identification by moving averages alignment at trading timeframe and higher timeframe;
- ZigZag Pattern identification (Higher high and higher low for bullish and opposite for bearish);
- Correlation identification by moving averages alignment of correlated pairs;
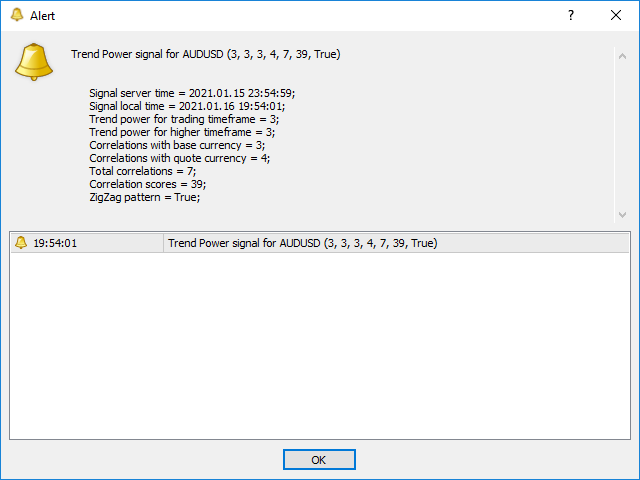
- Calculating amount of total correlated pairs (base and quote);
- Calculating amount of total correlated pairs with base currency;
- Calculating amount of total correlated pairs with quote currency;
- Calculating of trend power scores;
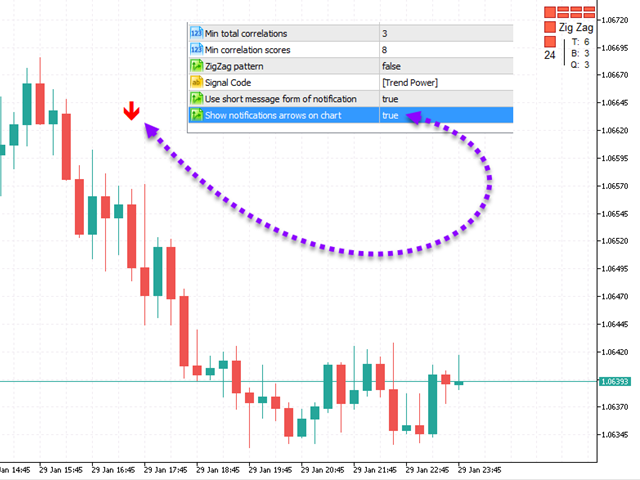
- Powerful notification system by Email, Mobile Push and MT4 Alert Window;
- Unlimited scaling of indicator visual objects for better viewing;
- Support of high resolution (4K) screens;
- User – friendly interface;
- And much more (see indicator's properties);
Relative links:
- Read this User Guide to get full information.
- MT4 Version of this indicator
Additional indicators for trend trading:
- MA Bounce Strategy for MT5 - It helps to identify and find place for potential market entry by MA bounce strategy.
- Currency Strength Meter Pro for MT5 - It helps to identify strong and weak currencies.
- News Scalping Executor Pro Utility for MT4 - It helps to trade high impact and huge volatility news.
- Chart State Saver for MT5 - It helps to save and manage states of all charts even if they would be closed.
Communication:
- Join Take Profit Channel to get latest news and updates.
- Join Take Profit Group to discuss products of author.
- If you want new feature contact me please.


Very useful MTF indicator if you are a trend trader, also useful if looking for pullback in direction of the trend. Included correlation analysis is icing to the cake, adds up to the trend confidence.