Super support and resistance breakout

2

Trade with super Support and Resistance Breakout system.


are you looking for the most sophisticated tools for your daily trading ?

this tools are perfect for you, it has a most comprehensive breakout identification spot on all market (Forex, CFD, indice, etc)


Limited offer :  10 copy for 30$

Indicator parameter:

  • Depth: to arrange how deep to calculates the support and resistance zone
  • Deviation
  • Back-step


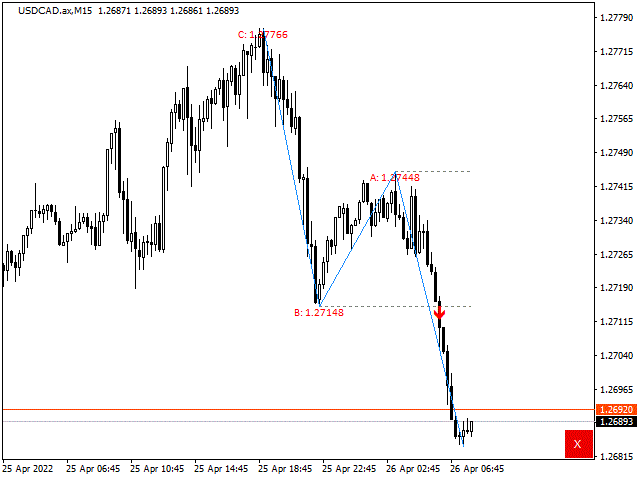
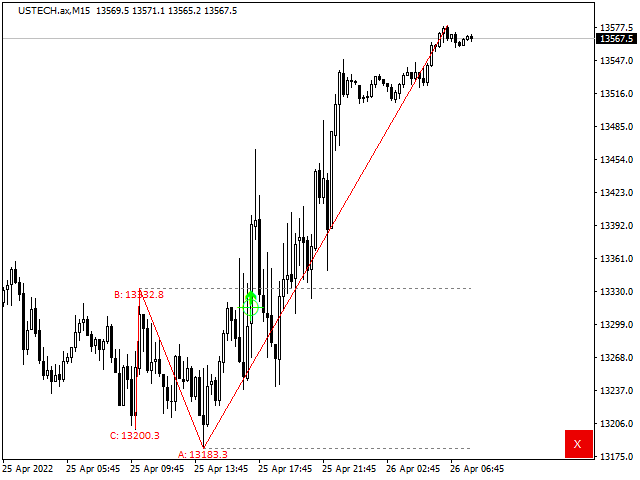
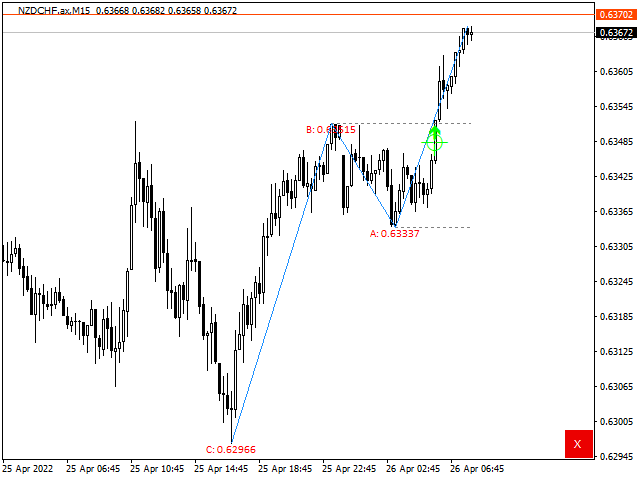
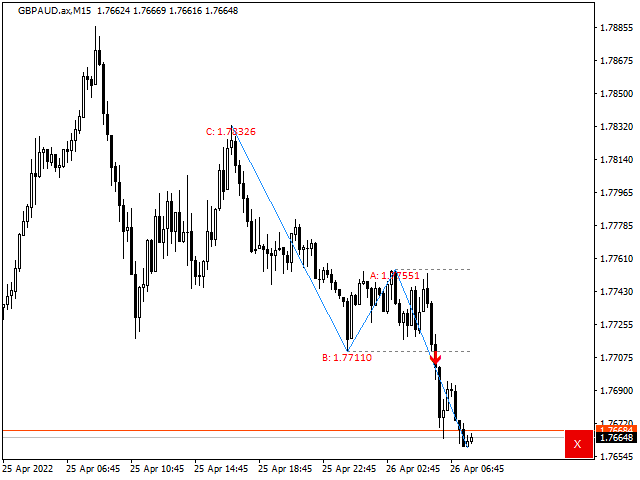
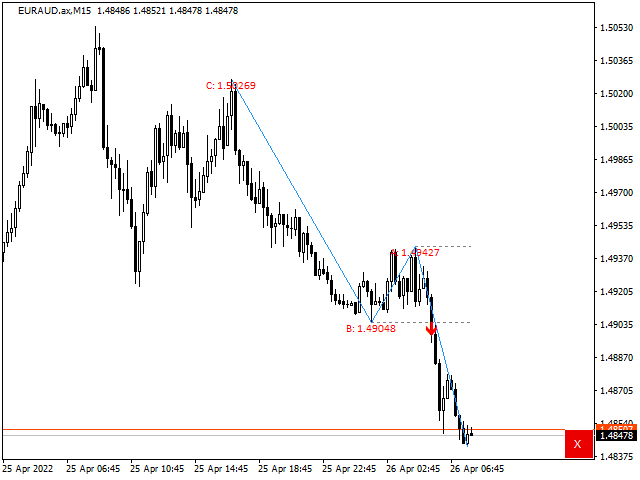
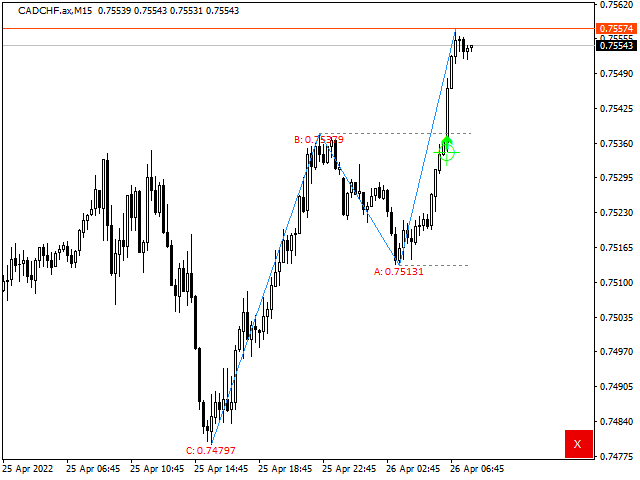
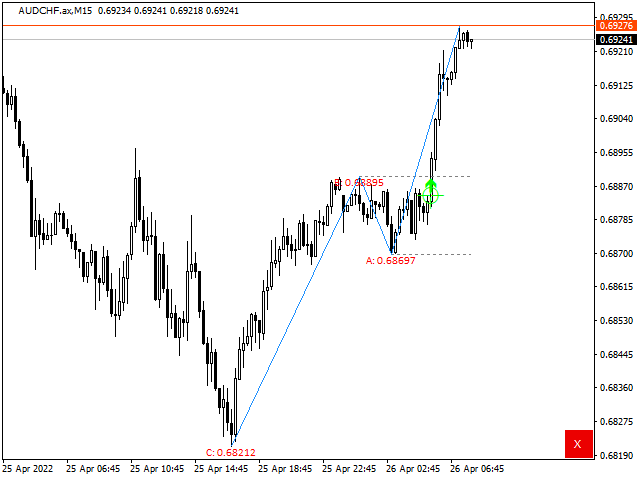
the demonstration result you can see on the media file below.

おすすめのプロダクト
This indicator is designed for scalping on low timeframes (M1-M15) in volatile markets like major forex pairs (e.g., EURUSD, GBPUSD). It generates non-repainting buy (green up arrow) and sell (red down arrow) signals based on EMA crossover confirmed by RSI momentum and MACD crossovers, minimizing false signals in ranging markets. How to Use: Attach the indicator to your MT4 chart. Look for arrows on the chart: Buy on green up arrow, Sell on red down arrow. Signals appear at the open of the new
This is the binary options signal you all have been looking for. This in a modified version of the Garuda Scalper, that has been modified for Binary Options traders. Signals are very unique! Why this is so effective for binary options is because  it is a trend following system, it understands that the trend is your friend. It takes advantage of the buying/selling after the pullback in continuation of the current trend wave.  Because  signals are generated after the pullback,   you can place shor
The BB Reversal Arrows technical trading system has been developed to predict reverse points for making retail decisions. The current market situation is analyzed by the indicator and structured for several criteria: the expectation of reversal moments, potential turning points, purchase and sale signals. The indicator does not contain excess information, has a visual understandable interface, allowing traders to make reasonable decisions. All arrows appear to close the candle, without redrawin
Dear Traders this is my another tool called " Swing Master Indicator ". As the name above the indicator is designed to help you in swing trading by capturing the low and highs of the price. You may us this tool with any trading strategy and style from scalping to position trading. It is made for level of traders including newbies and advanced traders even prop-firms, hedge funds and banks to help them make sold market analysis. I create tools for serious traders who want to make a difference in
ブレイクアウトプロスカルパーソリューション このインジケーターはRPTradeProSolutionsシステムの一部です。 Breakout Pro Scalper Solutionは、プライスアクション、ダイナミックサポート、レジスタンスを使用した毎日のトレンドインジケーターです。 誰でも使用できるように設計されており、トレーディングの初心者でも使用できます。 決して塗り直さないでください。 表示は近いものから近いものへと示されます。 単独で使用するように設計されているため、他のインジケーターは必要ありません。 一日の初めにトレンドと潜在的なテイクプロフィットを提供します。 特定のグラフは、履歴データによる潜在的な利益を示しています。 どのように機能しますか Breakout Pro Scalper Solutionは、価格アクションと動的なサポートおよびレジスタンスを組み合わせたブレイクアウト戦略を使用しています。 夜のトレンドとボラティリティが分析され、翌日に使用されます。 この分析から、ブレイクアウト制限(青と濃いオレンジの線)とTakeProfitが決定されます チャ
Cycles Predictor Indicator This indicator uses past market cycles to predict future price movements. The indicator scans through past data and considers  combinations  of cycles. When cycles  coincide  at the same future date/time then it is considered a valid future prediction. The predictions are drawn as vertical lines on the right side of the chart in the future. A prediction will often result in type of candle (ex. bull or bear) and/or a reversal point (ex. bottom or top) forming at this ex
BinaryScalping is a professional indicator for trading binary options and scalping. The algorithm of the indicator is based on the calculation of pivot points for each time period separately, the location of the price of the trading instrument relative to the pivot points is analyzed and the probability of a trading operation is calculated. The indicator has a built-in filter of trading signals based on the global trend. The indicator is installed in the usual way and works with any trading inst
This indicator works on MT4 and is very easy to use. When you receive a signal from it, you wait for that candle with the signal to close and you enter your trade at the beginning of the next new candle . A red arrow means sell and a green arrow means buy. All arrows comes with Alert  like for easy identification of trade signal. Are you okay with that? 1 minute candle 1 minute expire
BSA indicator is a ZigZag based indicator. This indicator is used to find the reversal level of the price. You can use the existing risk ratio and calculation timeframe in the entries by optimizing them according to your usage preference.  In lower time frames, the indicator can repaint. For healthier results, you can detect the least repainting by observing for a while according to the graphic you will apply.
タイトル: ノンリペイント XY トレンドインジケーターの紹介: フォレックスとバイナリオプションで成功するための究極のガイド はじめに: ノンリペイント XY トレンドインジケーターは、複雑で常に変化する金融市場において、トレーダーが情報に基づいた意思決定を行うために設計された革新的な取引ツールです。この高度な MetaTrader 4 (MT4) インジケーターは、リペイントという一般的な問題を排除しながら、驚くほどの精度で価格トレンドを予測するそのユニークな能力により、トレーダーの間で大きな人気を集めています。 インジケーターの理解: ノンリペイント XY トレンドインジケーターを際立たせている重要な機能の一つは、その精度へのこだわりです。過去のシグナルをリペイントし、トレーダーに信頼性の低いデータを残してしまう他の多くのインジケーターとは異なり、このインジケーターは一貫性を保っています。トレーダーは、生成されたシグナルが過去の価格変動を正確に反映していることを知って、安心して取引できます。 XY トレンドインジケーターは、高度なアルゴリズムを使用して価格データを分析し、市場のト
There are 8 types of this indicator. Consisted of 1. Bullish and Bearish Engulfing 2. Morning and Evening Star 3. Three Green Soldiers and Three Red Crows 4. Three Inside Up and Down 5. Three Outside Up and Down 6. Bullish and Bearish Harami 7. Tweezers Top and Bottom 8. Piercing and Dark cloud cover Signal Filter :: 1. The appearance of the candle stick 2. SMA 3. 2EMA :: EMA Fast and EMA Slow 4. RSI N otification :: 1. Via screen 2. Email 2. Phone For trading 1. Scaling 2. Binary options 3.
This is an arrow indicator without a future function,developed based on the most advanced profit trading algorithms.It has the most innovative and advanced dual trend analysis module, as well as the latest and highly effective market trend prediction algorithm.Trends are your friends, and following larger trends can earn the maximum profit in foreign exchange. This indicator helps traders identify current trends and track them. Someone once made a profit of 10 times in a week by relying on it.No
Magic Reversion Indicator
Giordano Bruno Rodrigues Machado
Indicator that indicate where the best point of reverse market.This indicator is a reactive or lagging signal, because the strategy uses a formation of an odd number of bars being the middle bar the highest or lowest in the formation, and the indicator draws when the all bars in the fractal close. However, traders with a pre-existing directional bias will find this indicator extremely useful, picking up early entry points.This indicator is not a boiled-down signals indicator nor a complete tradi
BinaryGrail
Justine Kelechi Ekweh
Great For Binary options. Works on all timeframes. Recommended for M5 timeframe. one candle expiry. Experienced traders can explore. Strategy is based on price action and multi timeframe analysis. Recommended During high volatility sessions, like the London and new York sessions. For the M1(One minute) timeframe, Traders can use four or five candle expiry, this means it can be applied for 4, 5 or more  minutes expiry. For forex traders, I tested the indicator with the JesVersal universal EA:   
新しいインジケーターのご紹介:[ON Trade Breakout Zone] すべてのトレーダーに向けたシンプルでありながら強力な市場分析ツール! プロフェッショナルから初心者まで、どなたにも適しています トレーディング戦略を一層強力にしませんか?当社の最新のインジケーターは市場分析を簡素化し、あらゆるレベルのトレーダーに力を与えるよう設計されています。経験豊富なプロであろうと、たった今始めたばかりであろうと、[ON Trade Breakout Zone] は市場で潜在的な利益を引き出すための鍵です。 [ON Trade Breakout Zone] の使い方: この賢明なツールは、毎日、先進的なアルゴリズムを使用してチャート上にゾーンを描きます。最大限に活用する方法は以下の通りです: ゾーンの識別: [ON Trade Breakout Zone] は高い精度でチャート上の重要なゾーンを識別し、潜在的なトレードの機会を簡単に見つけるのに役立ちます。 トレードの実行: 描かれたゾーンのどちらかの側に価格が移動するのを待ちます。 価格が購入ラインを上回った場合
This indicator uses support and resistance, volume and some special formula to calculate the volume to filter the candles. If the volume reaches a specific value, And at the same time, Candle breaks the support/resistance line, There would be a signal and we can enter the market. Signals appear when the current candle closes. then you can enter the trade when a new candle appears. Please don't forget to follow your money management plan. MT5 Version Support/Resistance Breakout MT5 :   https://
スイングトレーディング は、トレンドの方向のスイングと可能な反転スイングを検出するように設計された最初のインジケーターです。トレーディングの文献で広く説明されているベースラインスイングトレーディングアプローチを使用します。インディケータは、いくつかの価格と時間のベクトルを調査して、全体的なトレンドの方向を追跡し、市場が売られ過ぎまたは買われ過ぎて修正の準備ができている状況を検出します。 [ インストールガイド | 更新ガイド | トラブルシューティング | よくある質問 | すべての製品 ] むち打ちを起こさずに市場スイングの利益 インジケーターは常にトレンドの方向を表示します 色付きの価格帯は機会のベースラインを表します 色付きのダッシュは、可能な反転スイングを表します この指標は、独自の品質とパフォーマンスを分析します 複数時間枠のダッシュボードを実装します カスタマイズ可能なトレンドおよびスイング期間 電子メール/サウンド/プッシュアラートを実装します インジケータは再描画またはバックペインティングではありません Swing Tradingとは Swing Tradingは
The perfect tool for Scalng in the Forex markets You can trade both from signal to signal and using take profit  The algorithm does not use Zigzag!  No redrawing!  This is a channel instrument that uses a moving average as a filter. Moving Average  There are 2 parameters for the settings Ma Period = 5 period Moving Average  Channel 1.0 distance of channel lines from the chart Price Signal Filter - calculation of signal opening and filter There is a complete set of Alert There is a multi-timefram
Overview The Market Perspective Structure Indicator is a comprehensive MetaTrader indicator designed to provide traders with a detailed analysis of market structure across multiple timeframes. It identifies and visualizes key price action elements, including swing highs and lows, Break of Structure (BOS), Change of Character (CHOCH), internal structures, equal highs/lows, premium/discount levels, previous levels from higher timeframes, and trading session zones. With extensive customization opt
PipStartexはスキャルピング用のインジケーターです。買われすぎ/売られすぎの価格帯をチャネルの形でチャート上に描画します。また、価格がチャネルを超えると、チャート上に黄色のドットが描画されます。価格がこのチャネルを超えると、必ず元のチャネルに戻ろうとします。このパターンを理解すれば、すべてのトレーダーが取引に活用できます。売られすぎゾーンの価格がチャネルの赤いゾーンを下回ると、買い注文がオープンします。買われすぎゾーンの価格がチャネルの青いゾーンを上回ると、売り注文がオープンします。97%のケースでは、価格は常にすぐにコンフォートゾーンに戻ろうとします。コンフォートゾーンとは、価格がチャネル内にあるときです。価格がチャネルを超えると、そこに不快感を覚えます。この現象を確認するには、インジケーターのデモ版をダウンロードし、ビジュアルモードのストラテジーテスターでテストしてください。 このインジケーターを使用する理由: このインジケーターは、97%のケースで機能するパターンをチャート上に示します。 インジケーターは値を再描画しません。 日足のM5、M15、M30、H1で効果的に機
Double Edge Forex Indicator — User Manual “Master both sides of the market with precision and clarity.” ️ Introduction Welcome to the Double Edge Forex Indicator — your trading companion designed to simplify market analysis and amplify trading confidence. This tool empowers traders to visualize trend strength , direction , and reversal zones across multiple timeframes — all from one elegant chart panel. Whether you’re a scalper , swing trader , or day trader , Double Edge helps you identify
Perfect for one minutes high trading and scalping. This indicator is very effective for trading on one minutes, in the hour. A combination of moving averages and STOCHASTICS calculation to produce a very convincing signal every hour. Blue colour signals a buy opportunity. Follow the X signs for possible buy points. The Blue average line serves as possible trend direction and support. Red colour signals a sell opportunity. Follow the X signs for possible sell points. The Red average line serves a
Limitless MT4は、すべての初心者と経験豊富なトレーダーに適したユニバーサルインジケーターです。 すべての通貨ペア、暗号通貨、生の株式で動作します 無制限のMT4-構成済みで、追加の構成は不要 そして今、主なもの なぜ無制限のMT4なのか? 1再描画の完全な欠如 2トレーディングの最高のスペシャリストによる2年間のテスト 3正しい信号の精度が80%を超える 4ニュースリリース中の取引で好調 取引ルール 1買いシグナル-青い上向き矢印の出現 下向きの赤い矢印の外観を販売するシグナル シグナル後の次のローソク足で取引を開始するには2 3テイクプロフィット チャート上 М1-40ピップ М5-50ピップ М15-55-60ピップ 4ストップロスは利益をとる 5誤った信号をフィルタリングするために、 パラボリックSAR-トレンドとのトレードへの参入を除外する移動平均または同様のトレンドインジケーター。 
Towers - Trend indicator, shows signals, can be used with optimal risk ratio. It uses reliable algorithms in its calculations. Shows favorable moments for entering the market with arrows, that is, using the indicator is quite simple. It combines several filters to display market entry arrows on the chart. Given this circumstance, a speculator can study the history of the instrument's signals and evaluate its effectiveness. As you can see, trading with such an indicator is easy. I waited for an a
IQ FX Gann Levels a precision trading indicator based on W.D. Gann’s square root methods. It plots real-time, non-repainting support and resistance levels to help traders confidently spot intraday and scalping opportunities with high accuracy. William Delbert Gann (W.D. Gann) was an exceptional market analyst, whose trading technique was based on a complex blend of mathematics, geometry, astrology, and ancient mathematics which proved to be extremely accurate. Download the Metatrader 5 Version R
An exclusive indicator that utilizes an innovative algorithm to swiftly and accurately determine the market trend. The indicator automatically calculates opening, closing, and profit levels, providing detailed trading statistics. With these features, you can choose the most appropriate trading instrument for the current market conditions. Additionally, you can easily integrate your own arrow indicators into Scalper Inside Pro to quickly evaluate their statistics and profitability. Scalper Inside
Sharp Scalper
Mazin Salim Said Ba Abbad
The “Sharp Scalper” indicator is high-frequency trading tool designed for quick, short term trades in the forex market. It focus on identifying rapid price movement and generating signals for best entry. This indicator is known for its ability to capture small profit opportunities multiple times throughout the day making it ideal for scalpers looking to capitalize on market volatility. The” sharp scalper” indicator employs advance algorithms to detect market trends and fluctuation, helping trade
The latest Binary Options arrow indicator in the Garuda Signals product line. Binary options signal based on multiple time frame cross over analysis. Gets confirmation from the most consistent signals known to man; Ichimoku, SMA, Bollinger Bands; and also uses the 1 Hour time frame as trend confirmation , so you don't have to open up multiple chart and waste time. - Can be used for all time frames up to 1 hour, but is most POWERFUL for 1 and 5 min options. - Place your Call/PUT based on the Arro
This indicator identifies pinbar candlesticks on the chart and displays an arrow as a trade signal based on the candlestick pattern. It offers user-friendly features, including push notifications and other types of alerts. It is most effective for identifying entry points or potential reversals at premium or discount prices. Additionally, it works on any time frame.
FREE
Last 50 Pips
Martin Alejandro Bamonte
Last 50 Pips インジケーターは、最近の価格動向に基づいて買いと売りのチャンスを素早く特定するために設計されています。直近のローソク足の価格変動を測定し、価格が方向を変える可能性がある瞬間を黄色で強調表示します。 買いシグナル: インジケーターが 赤 から 黄色 に変わったとき、 買い ポジションを開く必要があります。これは、下降トレンドから上昇トレンドへの転換を示唆します。簡単さを確認するために画像をご覧ください。 売りシグナル: インジケーターが 緑 から 黄色 に変わったとき、 売り ポジションを開く必要があります。これは、上昇トレンドから下降トレンドへの転換を示唆します。 アラート: インジケーターはまた、音声、メール、またはプッシュ通知を通じてリアルタイムアラートを受け取るオプションを含んでおり、ユーザーがどのデバイスからでも迅速にチャートの新しいシグナルに反応できるようにします。 ご質問があれば、お気軽にご連絡ください :)
このプロダクトを購入した人は以下も購入しています
Meravith
Ivan Stefanov
5 (1)
このインジケーターは、各ポイントのボリュームを分析し、そのボリュームに対する市場の疲労レベルを計算します。 インジケーターは3本のラインで構成されています: 強気のボリューム疲労ライン 弱気のボリューム疲労ライン 市場のトレンドを示すライン。このラインは、市場が強気か弱気かに応じて色が変わります。 任意の開始点から市場を分析できます。一度ボリューム疲労ラインに達したら、次の分析を開始するための新しいポイントを設定してください。 トレンドや修正を分析できます。良いアプローチは、トレンドラインに達したときや、トップやボトムがヒットしたときにインジケーターを移動させることです。 トレンドラインとボリューム疲労ラインの距離が大きいほど、その方向のボリュームは大きくなります。 トレンドラインはオーダーを開く場所として使用でき、疲労ラインは利益を取るために使用されます。 このシステムは非常にユニークですが、非常に直感的でもあります。 市場には同様の製品はありません。 使用に制限はありません。すべての市場およびすべての時間枠で適用できます。 重要:MetaTrader4のテスターで確認する際は、紫色
Product Description Rtc ML Ai Predictor — Futuristic Intelligence for Real-Time Market Decisions Bring robotic precision to your trading.   Rtc ML Ai Predictor   fuses   Machine Learning   with   SMA-shift dynamics   to forecast short-term momentum and trend inflection points with clarity. The model evaluates multi-factor market structure, assigns a   confidence score   to each signal, and lets you act only when conditions align with your rules. Why traders choose Rtc ML Ai Predictor AI-guided e
BinaryUniversal is a signal indicator for binary options and Forex. In its work, the indicator uses a complex algorithm for generating signals. Before forming a signal, the indicator analyzes volatility, candlestick patterns, important support and resistance levels. The indicator has the ability to adjust the accuracy of the signals, which makes it possible to apply this indicator for both aggressive and conservative trading. The indicator is set in the usual way, it works on any time period and
ヒット率トップボトムシグナル ヒット率トップボトムシグナル ヒット率トップボトムシグナル は、完全に革新的なアプローチを提供します。 特定のTP-SLとPAIRS/TFで最も優れたパフォーマンスを発揮する方法を事前に評価したい方に理想的です。 ヒット率トップボトムシグナル 戦略は、 すべてのトレーダーとトレードスタイル にとって基本的なツールです。これは、 リペイントしない精度の高いシグナル を提供し、どのタイミングでどの方向に取引するかを明確に示すだけでなく、各通貨ペアとTFの ヒット率を詳細に記録 し、あらかじめ設定されたテイクプロフィット(TP)とストップロス(SL)を提供するためです。 これにより、シグナルの有効性の比率を事前に知ることができ 、リスク管理と正確な取引に非常に重要です。 この戦略の特徴は、全体的な動きではなく、インパルス内のリバーサルポイントの検出に焦点を当てている点で、従来のトップボトムよりも頻繁にシグナルが発生し、 市場の重要な各変動のキーとなる瞬間に焦点を当てています。 このシグナルの歴史的な効果を%で表示する SL/TP比率との組み合わせ により、こ
This indicator is a multifunctional technical analysis tool based on the combination of an adaptive exponential moving average and volatility filters calculated through the Average True Range (ATR). It is designed to accurately identify the current price direction, highlight key trend reversal areas, and visualize potential turning zones. The algorithm is built upon the dynamic construction of a trend ribbon using two levels of volatility — outer and inner ranges. The outer boundaries serve as i
#EasyWayTradePanel indicator for #MetaTrader4 , is trade assistants for manual trading in any #currency in #FOREX , #CRYPTOCURRENCY as #Bitcoin , #Ethereum , #Lightcoin and more. Also is EasyWay to use for #COMMODITY as #Gold , #Silver , #Oil , #Gas ...... and #CFDs . When installed on the chart in your chosen time frame and trading tool, the indicator automatically draws the following custom indicators used in the EasyWayTradePanel trading strategy. 1) Zigzag_Extreme_Indicator, 2) Regression_C
This is a mini One pair version of Advanced Detector of Trend Reversal and Continuance known as TrueTrendStarM(TTSm25). It is a sensitive and Predictive indicator of Price Trends for Professional traders.  ( ATTENTION BUYERS:-Now the indicator is available for UNLIMITED TIME ONE TIME buy of just $500 ). Avail the Opportunity.    It detects high odds changes in Price Trend direction long before other indicator detects it. I have been working on it since 2019.    This is possible due to fractal
Dual Momentum is a modern arrow indicator for MetaTrader 4, created specifically for the accurate detection of market reversals and strong impulse movements. The indicator is based on a combination of two powerful oscillators – Williams %R and RSI, which allows you to filter noise and generate more reliable signals. Thanks to this, Dual Momentum indicates only key entry points when the probability of a successful trade is highest. Key advantages: No redrawing – signals remain on the cha
FFx Engulfing Setup Alerter gives trade suggestions with Entry, Target 1, Target 2 and StopLoss. Below are the different options available: Entry suggestion - pips to be added over the break for the entry 3 different options to calculate the SL - by pips, by ATR multiplier or at the pattern High/Low 3 different options to calculate the 2 TPs - by pips, by ATR multiplier or at Risk/Reward Offset the dashboard - any place on the chart Remove the suggestion once the price reached the SL line Lines
FFx InsideBar Setup Alerter gives trade suggestions with Entry, Target 1, Target 2 and StopLoss. Below are the different options available: Entry suggestion - pips to be added over the break for the entry Minimum candle size - to avoid too close buy/sell entry suggestions 3 different options to calculate the SL - by pips, by ATR multiplier or at the pattern High/Low 3 different options to calculate the 2 TPs - by pips, by ATR multiplier or at Risk/Reward Offset the dashboard - any place on the c
FFx OutsideBar Setup Alerter gives trade suggestions with Entry, Target 1, Target 2 and StopLoss. Below are the different options available: Entry suggestion - pips to be added over the break for the entry. 3 different options to calculate the SL - by pips, by ATR multiplier or at the pattern High/Low. 3 different options to calculate the 2 TPs - by pips, by ATR multiplier or at Risk/Reward. Offset the dashboard - any place on the chart. Remove the suggestion once the price reached the SL line.
FFx PinBar Setup Alerter gives trade suggestions with Entry, Target 1, Target 2 and StopLoss. Below are the different options available: Entry suggestion - pips to be added over the break for the entry Minimum candle size - to avoid too small candles 3 different options to calculate the SL - by pips, by ATR multiplier or at the pattern High/Low 3 different options to calculate the 2 TPs - by pips, by ATR multiplier or at Risk/Reward Offset the dashboard - any place on the chart Remove the sugges
Automatic, live & interactive picture of all trendlines. Assign push, email and sound alerts to the lines of your choice and be informed about price rollback, breakout, rollback after breakout, number of rollbacks, line expiration by double breakout. Correct, drag or delete the lines and interactively tune the line system. https://youtu.be/EJUo9pYiHFA . Chart examples https: //www.mql5.com/en/users/efficientforex Price Interaction Events All events are effective immediately and only after one
The purpose of this new version of the MT4 standard indicator provided in your platform is to display in a sub-window multiple timeframes of the same indicator with its divergences. See the example shown in the picture below. But the display isn't like a simple MTF indicator. This is the real display of the indicator on its timeframe. Here's the options available in the FFx divergences indicator: Select the timeframes to be displayed (M1 to Monthly) Define the width (number of bars) for each tim
The purpose of this new version of the MT4 standard indicator provided in your platform is to display in a sub-window multiple timeframes of the same indicator with its divergences. See the example shown in the picture below. But the display isn't like a simple MTF indicator. This is the real display of the indicator on its timeframe. Here's the options available in the FFx divergences indicator: Select the timeframes to be displayed (M1 to Monthly). Define the width (number of bars) for each ti
The FFx Dashboard MTF alerter will show you on a single chart all the timeframes (M1 to Monthly) with their own status for the indicator. 2 Alert Options: Single timeframe: each selected timeframe alert separately when a signal occurs Multi timeframes: all selected timeframes must agree for an alert to be triggered Both options have an input to select the timeframes to be used for the alert(s). How to Understand the Status: Green/Red square: histogram above/below 0 line Green square + Red bord
The FFx Dashboard MTF alerter will show you on a single chart all the timeframes (M1 to Monthly) with their own status for the indicator. 2 Alert Options: Single timeframe: each selected timeframe alert separately when a signal occurs Multi timeframes: all selected timeframes must agree for an alert to be triggered Both options have an input to select the timeframes to be used for the alert(s). How to understand the status: Green/Red square: RSI above/below 50 line Green square + Red border: R
The FFx Dashboard MTF alerter will show you on a single chart all the timeframes (M1 to Monthly) with their own status for the indicator. 2 Alert Options: Single timeframe: each selected timeframe alert separately when a signal occurs Multi timeframes: all selected timeframes must agree for an alert to be triggered Both options have an input to select the timeframes to be used for the alert(s). How to understand the status: Green/Red square: Stoch above/below 50 line Green square + Red border:
The FFx Dashboard MTF alerter will show you on a single chart all the timeframes (M1 to Monthly) with their own status for the indicator. 2 Alert Options: Single timeframe: each selected timeframe alert separately when a signal occurs Multi timeframes: all selected timeframes must agree for an alert to be triggered Both options have an input to select the timeframes to be used for the alert(s). How to understand the status: Green/Red square: Price above/below Cloud (Kumo) Green square + Red bo
The FFx Dashboard MTF alerter will show you on a single chart all the timeframes (M1 to Monthly) with their own status for the indicator. 2 Alert Options: Single timeframe: each selected timeframe alert separately when a signal occurs Multi timeframes: all selected timeframes must agree for an alert to be triggered Both options have an input to select the timeframes to be used for the alert(s). How to understand the status: Green/Red square: MA pointing Up/Down Green square + Red border: MA po
The FFx Dashboard MTF alerter will show you on a single chart all the timeframes (M1 to Monthly) with their own status for the indicator. 2 Alert Options: Single timeframe: each selected timeframe alert separately when a signal occurs. Multi timeframes: all selected timeframes must agree for an alert to be triggered. Both options have an input to select the timeframes to be used for the alert(s). How to understand the status: Green square: Price above PSAR Red square: Price below PSAR Options
The FFx Dashboard MTF alerter will show you on a single chart all the timeframes (M1 to Monthly) with their own status for the indicator. 2 Alert Options: Single timeframe: each selected timeframe alert separately when a signal occurs Multi timeframes: all selected timeframes must agree for an alert to be triggered Both options have an input to select the timeframes to be used for the alert(s). How to understand the status: Green/Red square: CCI above/below levels (ie. 100/-100) Grey square: C
The FFx Dashboard MTF alerter will show you on a single chart all the timeframes (M1 to Monthly) with their own status for the indicator. 2 Alert Options: Single timeframe: each selected timeframe alert separately when a signal occurs Multi timeframes: all selected timeframes must agree for an alert to be triggered Both options have an input to select the timeframes to be used for the alert(s). How to understand the status: Green/Red square: ADX above level Grey square: ADX below level Red bor
The FFx Dashboard MTF alerter will show you on a single chart all the timeframes (M1 to Monthly) with their own status. 2 Alert Options: Single timeframe: each selected timeframe alert separately when a signal occurs Multi timeframes: all selected timeframes must agree for an alert to be triggered Both options have an input to select the timeframes to be used for the alert(s). How to understand the status: Green/Red square: bullish/bearish candle Options available in the FFx Dashboard Alerter
The [GRAFF] III manual trading system is based on multiple MetaTrader (MT4) indicators. Together, the entire PACK of GRAFF III indicators makes an advanced trading tool. The system consists of over 20 different custom-built indicators which have been carefully selected and tested in the long term to produce strong and efficient trading signals. The particular indicators are based on different mathematical formulas, so the entire system is calibrated to remove false signals from its own indicator
This indicator allows you to see the strength of the trend on all timeframes. It can be used for all currency pairs. The indicator can be displayed in the form of a column (from left to right): status buy / sell / strong buy / strong sell, strength of the trend in percentage, pips last candle, body candle now, remaining time, and the timeframe of M1 to MN. Information contained below (from left to right): total trend percent, sell percent, buy percent.
FFx Universal Strength Meter PRO is more than a basic strength meter. Instead of limiting the calculation to price, it can be based on any of the 19 integrated strength modes + 9 timeframes. With the FFx USM, you are able to define any period for any combination of timeframes. For example, you can set the dashboard for the last 10 candles for M15-H1-H4… Full flexibility! Very easy to interpret... It gives a great idea about which currency is weak and which is strong, so you can find the best pai
作者のその他のプロダクト
N Money Management With this adviser, you won't loose your daily drawdown. Show the account actual leverage. Show the whole entry history on the chart. Calculate the moneymanagement (Risk Management to minimize the drawdown). Settings ShowEntryHistory: show all history entry line. ShowOpenArrow: show order open price. ShowAccountInfo: show the display text. calcLotPerEquity (e.g: 50) with equity of 100$ >> 100/50 = 2 >> 2x0.01 Lot = 0.02 Lot advised. priceOnePipInOneLot: input your broker price
You can directly test and improve your trading skills through simulation. Contact me if you want to add another button's feature. Live trading available! Main features: Direct buy Direct sell Pending Buy (Limit/Stop) Pending Sell (Limit/Stop) Setup Takeprofit point and/or Stop Loss point Setup a price for pending orders Setup the breakeven stop loss to the plus direction (in pips) Close only Buy Close only Sell Close all orders opened Modification of SL/TP/Pending price (drag it) Modification
Simple and powerful CSM (Currency Strength Meter) Currency strength meter is the indicator you need to identify the current actual trend based on a unique calculation, which is generally used as another fundamental analysis for those who are not capable of reading the fundamental clearly. Currency strength meter will read the current strength of related currency pair (Forex) where generally consist of AUD, NZD, CAD, CHF, JPY, EUR, GBP, and USD for the main major currency. Feature Easy reading b
Great for scalper/intraday weapon for your ease daily trading. Scalper weapon will suit's you for any trading condition, whether it's intraday / scalper this tool is important for you which providing the missing function on the native MT4 platform. You have to check Allow Auto Trading by pressing Ctrl+O, going to Expert Advisors tab, and checking " Allow automated trading" . also to ensure the " auto trading " is green. Input Parameters _MINIMIZED_AT_START: to chose whether the panel is minimiz
Super sniper is the indicator that you're looking for This indicator has an active signal that also able to send push notification to your mobile MetaTrader 4 (see the screenshot for tutorial), so you won't miss any signal during active market. The signal is very simple, " down arrow " for sell and " up arrow " for buy. There are several options as below _SEND_NOTIF_TO_MOBILE: to enable push notification to your mobile MetaTrader for signal _ALERT_SIGNAL: to enable alert signal _SHOW_EMA_TREND:
inLuk Trade Duplicator is a powerful tool to copy trade locally between multiple broker at different terminal. This is an ideal solution for fund manager or signal provider, who want to share his trade with the others globally on his own rules. Demo version here ( https://www.mql5.com/en/market/product/20884 ) Features Switchable between Server or Client role within one tool. Easy & friendly interface usage. Drag able panel Customization of user interface using expert input Auto recognize and
‌Demo version here: https://www.mql5.com/en/market/product/21344 P‌urpose: F‌or those who trade with trend line manually, this expert is suitable for you to manage your trade in easy way. U‌sage: Draw a trend line or horizontal line, and rename it according to input parameter in example "sell" >> for more details please watch the video below. A‌ction: ea will identify the trend line, and trade based on the selected mode (Touch/Break), ea will also set the TP/SL/Lot automatically according to in
Yihaa Shoot applies a unique range calculation and time management to enter a trade. It has a unique money management system which calculates the risk before it takes a trade. Suggested pairs: GBPJPY and USDJPY Timeframe: H1 Suggested balance: $500 ($1000 is recomended) Risk in dollar suggested: 4 (0.5% from $1000) Parameters Signal Settings Margin Top (pip) >> margin top from range Margin Bottom (pip) >> margin bottom from range TP Buy deduct (pip) >> reduce the TP spot TP Sell deduct (pip) >
This tool is developed  to make your trading risk and profit management easier. It is able to move all of your opened transaction's take profit and stop loss on to one similar price. How to use Draw a trend line/horizontal line and name it to "tp_" as the take profit line and "sl_" as the stop loss line. The EA will modify all of your orders' and pending orders' take profit and stop loss to the given line. You can drag the gray box to drag the line. You can see the risk in the account currency
True SnD
Indra Lukmana
5 (1)
This Supply & Demand indicator uses a unique price action detection to calculate and measures the supply & demand area. The indicator will ensure the area are fresh and have a significant low risk zone. Our Supply Demand indicator delivers functionality previously unavailable on any trading platform. Trading idea You may set pending orders along the supply & demand area. You may enter a trade directly upon price hit the specific area (after a rejection confirmed). Input parameters Signal - Set
Our indicator uses a unique price action candlestick pattern called Engulfing, this indicator represent the price action behavior on your metatrader4 chart. The indicator seek the most valuable engulfing pattern and identify those as support and resistance levels. Indicator parameter Bars to calculate: maximum bars to seek. Alert Option: True / False. Candle bear: color for detected bear candle. Candle bull: color for detected bull candle. Base line style: style for the base line. Base line wid
Ultimate solution on price action trade system Built Inside One Tool! Our smart algorithm tool will detect the price action pattern and alert upon potential with entry signals and exit levels including stoploss and takeprofit levels based on the time setting on each market session. This tool will also filters out market currency strength to ensure our entry are in a good currency conditions based on it's trend. Benefit You Get Easy, visual and effective price action detection. Gives you the a
Extended VERSION Ultimate solution on price action trade system Built Inside One Tool! Our smart algorithm tool will detect the price action pattern and alert upon potential with entry signals and exit levels including stoploss and takeprofit levels based on dynamic and unique calculation. This tool will also filters out market currency strength to ensure our entry are in a good currency conditions based on it's trend. Benefit You Get Easy, visual and effective price action detection. Gives
Why Selecting our product ?  Our smart system expert advisor calculates a unique range detection to select the best entry spot on the right time of any currency market you are dealing with. The algo intelligence system will detect any required calculation needed on live tick market continuously. The parameter provided gives you the flexibility and capability to explore the variability deeply on any highest potential outcome in your trading account. Strategy involved Breakout smart system. Sma
CSM8Pro
Indra Lukmana
5 (1)
Why Selecting our product ?  Our smart system expert advisor calculates a unique Currency Strength detection to select the best currency to trade on the right time. The algo intelligence system will calculates continuously on the live tick market. The parameter provided gives you the flexibility and capability to explore the variability deeply on any highest potential outcome in your trading account. Strategy involved Currency Strength Meter Smart way to open and close order Automatic Smart Mo
The smart EA Copy trade for VPS / PC Designed for MT4, it easy it super fast, it full of features, for the tutorials you can see on the uploaded photo Parameter input: Select timer setting: select between milisecond / second timer (some broker will conflict on milisecond). Select role: select the role as master or client, but leave it default you can change later on the dashboard. Master key: input the key, ensure the key are same between master and client, you can set more than master in one
Super simple and powerful with full feature Trade Panel manager This is the finest trade tool for your metatrader4, the best option for your daily trading activity with full powerfull inside. Input parameters: Magic Number : Define your magic number. Entry Comments : Define your entry comments. Main Dashboard Features: Buy & Sell button: Protected with confirmation pop-up before entry deliver to the system, incase miss press the button. Pending order (Limit & Stop) with check option: press
Feb 14 will be the last limit to purchase this EA for 1689 $, normal price will be 4500 $ If you are a fans of Martingale Averaging type of robot, then this robot will suit you, it has integrate the powerful entry method and smart money management system and strict account blow up protection system. it's fully automatic no need to control / interfere the robot during the trading run. Critical features Account blow-up protection. Trend following filter. Smart money management system. Emergenc
Feb 14 2022 will be the last limit to purchase this EA for 1689 $, normal price will be 4500 $ Insider 8PRO is fully automatic trend following system, its basically designed for any pair, however you may follow our suggestion by running this bot on XAUUSD or Gold. the system uses the main trend following of the Forex market in trading, and spot the best moment to place an order. Timeframes: M30 Pair suggestion: XAUUSD (Gold) Recomended balance: $1000 Minimum balance: $500 After purchasing thi
March 1st will be the last limit to rent this ea for $350 per year, NORMAL PRICE ($650/year) North West 8PRO is fully automatic trend following system, its basically designed for any pair, however you may follow our suggestion by running this bot on XAUUSD or Gold. the system uses the main trend following of the Forex market in trading, and spot the best moment to place an order. Timeframes: M30 Pair suggestion: XAUUSD (Gold) Recomended balance: $1000 Minimum balance: $250 After purchasing this
フィルタ:
kylewisani
181
kylewisani 2023.02.12 17:11 
 

Well I'll give an extra star for effort of not repainting. Otherwise this indicator has too much false signals, sadly there's no proper input adjustment here. Besides the zig zag.

Indra Lukmana
7185
開発者からの返信 Indra Lukmana 2023.02.13 02:44
Thank you Kyle... will try our best to improve all above comments... you can always combine with another indicator for entry..
レビューに返信