Breakout Pro Scalper Solution
- インディケータ
- バージョン: 1.11
- アップデート済み: 8 3月 2019
- アクティベーション: 5

ブレイクアウトプロスカルパーソリューション
このインジケーターはRPTradeProSolutionsシステムの一部です。
Breakout Pro Scalper Solutionは、プライスアクション、ダイナミックサポート、レジスタンスを使用した毎日のトレンドインジケーターです。
誰でも使用できるように設計されており、トレーディングの初心者でも使用できます。
決して塗り直さないでください。
表示は近いものから近いものへと示されます。
単独で使用するように設計されているため、他のインジケーターは必要ありません。
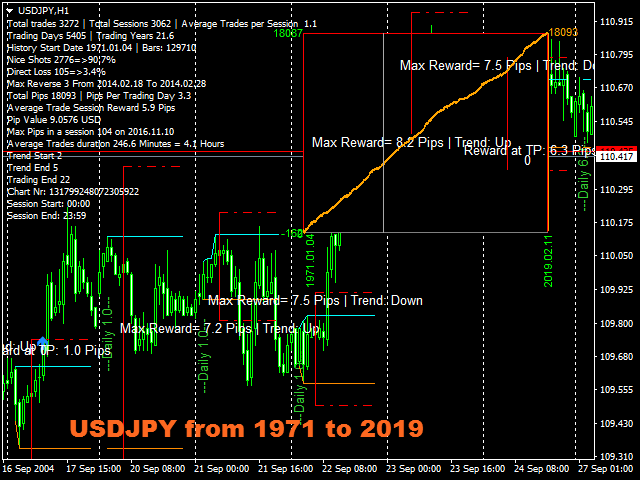
一日の初めにトレンドと潜在的なテイクプロフィットを提供します。
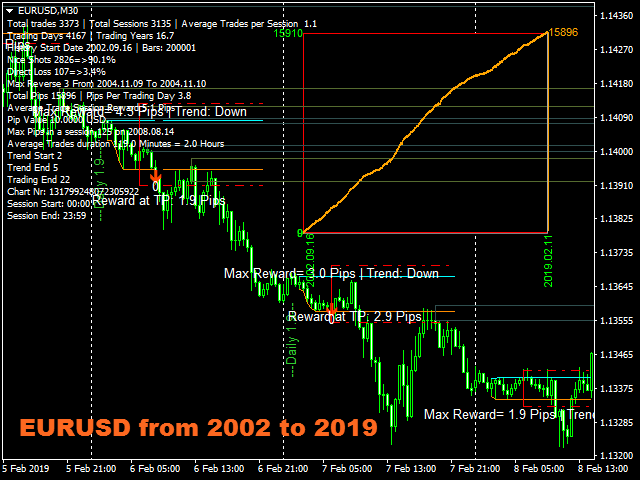
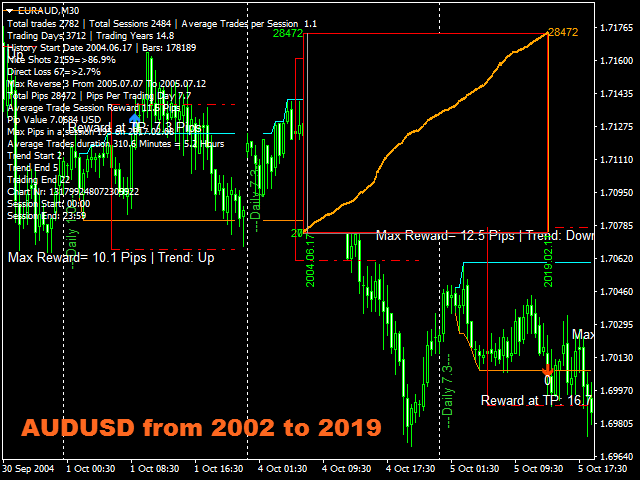
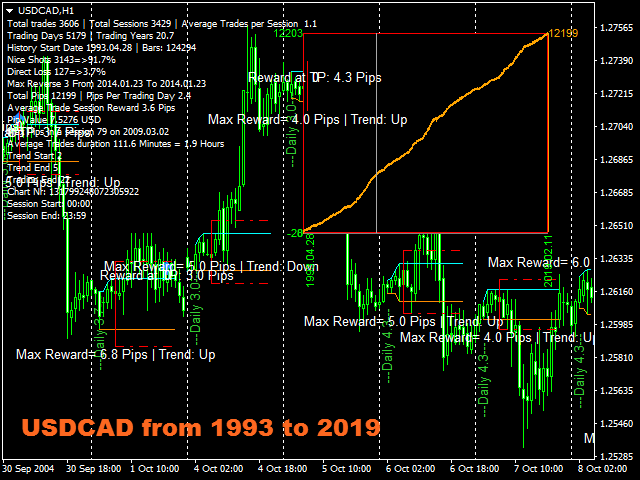
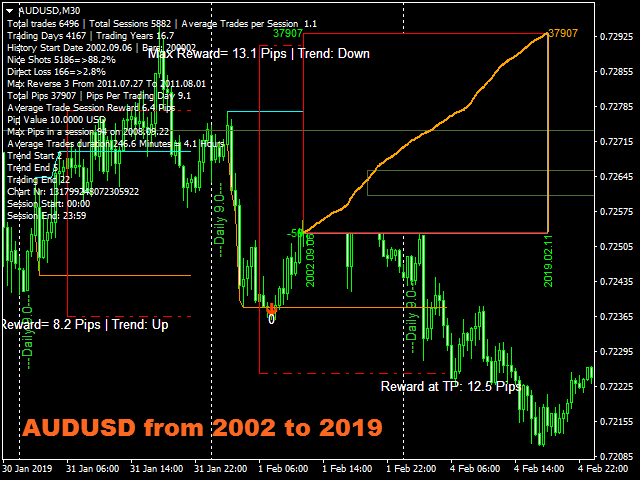
特定のグラフは、履歴データによる潜在的な利益を示しています。
どのように機能しますか
Breakout Pro Scalper Solutionは、価格アクションと動的なサポートおよびレジスタンスを組み合わせたブレイクアウト戦略を使用しています。
夜のトレンドとボラティリティが分析され、翌日に使用されます。
この分析から、ブレイクアウト制限(青と濃いオレンジの線)とTakeProfitが決定されます
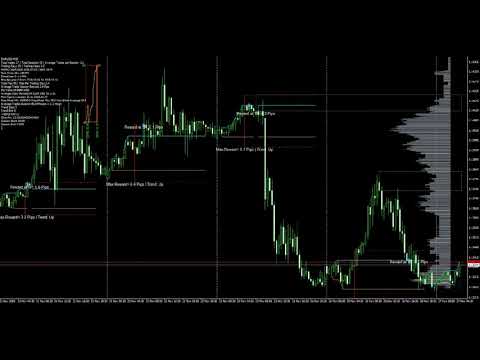
チャート上のグラフのおかげで、戦略と設定の「成功」を即座に確認できます。
OnChartグラフを使用すると、戦略に「穴」があるかどうかをすぐに確認し、最終的にはより適切な別のタイムフレームまたはシンボルを選択できます。
ろうそくの近くからろうそくの近くまでリアルタイムでトレンドインジケーターはシグナル条件が有効になるのを待ってから矢印で表示します(買いは緑、売りはオレンジ)
赤い一点鎖線は、テイクプロフィットと最終的なストップロスを配置する場所を示しています。
トレードは1つずつ示され、同時に2つのトレードが存在することはありません。
ほとんどの取引(80%)は日中に終了します。
Breakout Pro Scalper Solutionは、次のことを示しています。
あなたの取引を開く場所。
利益を取り、損失を止めます。
捕まえることができるピップの潜在的な量。
Breakout ProScalperSolutionは機能します
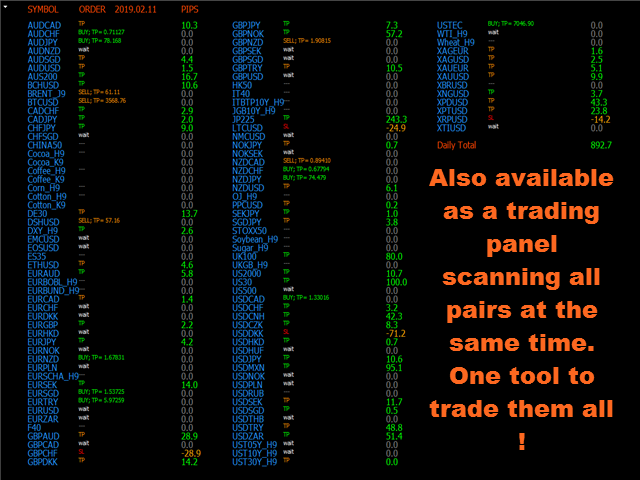
相場が一晩で提供される場合、FXペア、インデックス、金属、先物、またはその他のようなあらゆる商品を使用します。
M15からH1へ。
どんなブローカーでも。
BreakoutProScalperソリューションの機能
信頼できる売買シグナル。
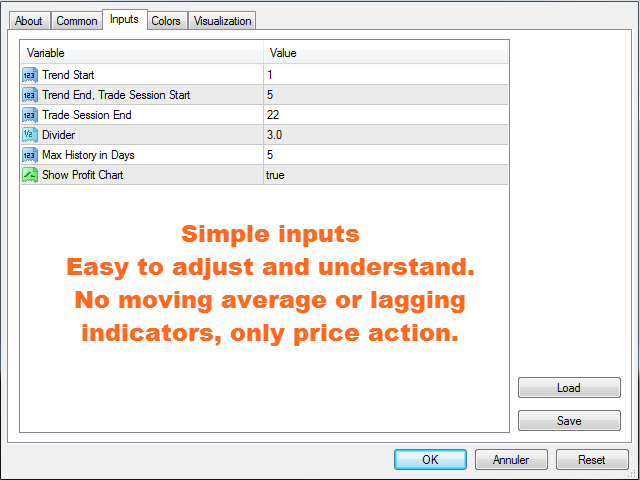
非常に単純な入力。
画面上のアラート+プッシュ通知+電子メール通知
すべての通知は非常に詳細であり、Take Profitも提供します。これにより、モバイルデバイスからの取引が可能になります。
チャート全体の履歴データのバランスを示す利益ピップグラフ。戦略が選択した商品と一致しているかどうかを簡単に確認できます。
オンチャートグラフはマウスで移動可能で、ダブルクリックして画面上の任意の位置に移動します。
サポートとレジスタンスがチャートに再表示されます。
細い領域と太い領域の水平線がチャートに表示されます。
Breakout ProScalperSolutionの使用方法
チャートに載せるだけです。
矢印に従って、利益/損失の表示を取得するだけです。
入力
トレンド開始:[整数]ここに夜のトレンドの開始時刻を入力します。デフォルト値は1時です。 0から23:59まで引用されているほとんどのFxペアに適合します。
トレンド終了、トレードセッション開始:[整数]ここに、ナイトトレンドの終了とトレードセッションの開始の時間を入力します。デフォルト値はほとんどの機器に適合します。
トレードセッション終了:[整数]この時間以降のトレードは表示されません。
除算器:[ダブル]トレンド開始とトレンド終了の間の距離を除算して、テイクプロフィットとSLを計算します。デフォルトは3です。これは、TPとSLが夜間のボラティリティ距離の1/3になることを意味します。
最大履歴日数:[整数]灰色の価格線の履歴期間を日数で設定します。
利益チャートを表示:[Bool] true =利益チャートを表示、false=表示しません。
テスト
急いではいけません。複雑な計算を行うため、テストは非常に遅くなります。とにかく、戦略が本当に有益であることを確認するために長く待つ必要はありません。
次のリリース
新しいリリースが間もなく登場します。サポートとレジスタンスを直接使用して、テイクプロフィット、ストップロスを適応させ、トレードスタートシグナルをフィルタリングします。
3つ目は、価格ラインを使用して価格変動を「予測」します。
新しいリリースでは、過去の戦略を選択して使用することが可能になります。

incredible. Still have to find out some more details and how to avoid triggered trades, which run in the opposite direction right afterwards into a possible stopp/loss. But this simply never happens. So five stars for this masterpiece!