Pivot levels mql5
- インディケータ
- バージョン: 1.12
- アップデート済み: 3 4月 2023
- アクティベーション: 5

Pivot levels indicator shows 7(9 for Camarilla) pivot levels. It is adjusted for major use, including:
- all standard time frames
- choice of periods to show
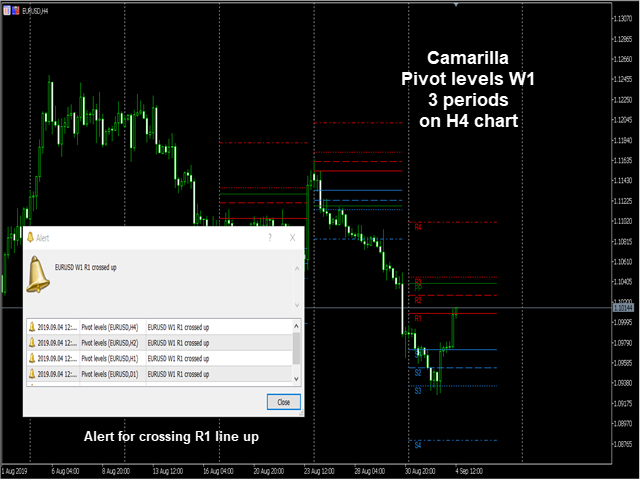
- four popular calculation formulas (typical, median, weighted and Camarilla)
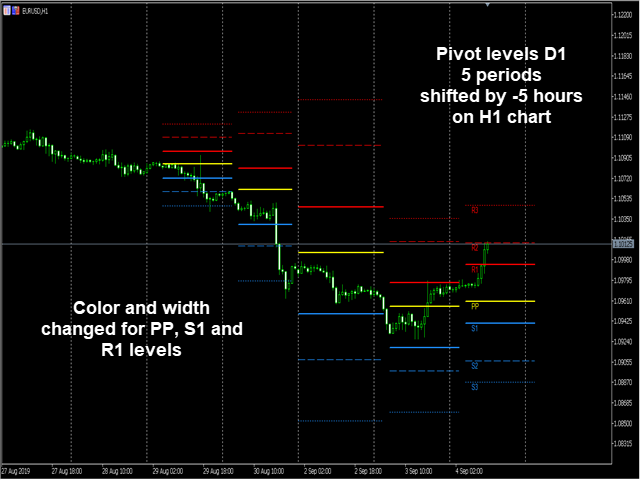
- pivot day shift
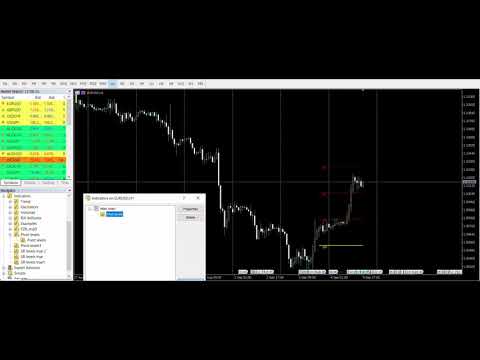
- choice of properties for lines and labels
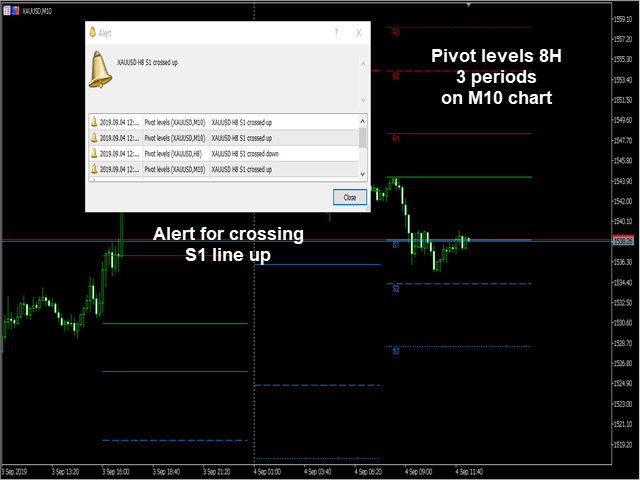
- choice of showing alerts when crossing pivot lines
Parameters:
----------Main parameters-----------
- Timeframe - time frame for pivot levels
- Number of periods to show - displays pivot levels for number of periods
- Formula for calculation - four calculation formulas (typical, median, weighted and Camarilla) can be chosen
- Pivot day shift - offset from GMT time
----------Lines and labels-----------
- Extend lines of last period? - if Yes last period lines are extended to the end of period, if No lines ends at last price time
- Show transitions between periods? - if Yes shows transition lines between periods
- Show labels? - if Yes labels are shown, if false labels are hidden
- Font size for labels - enter font size for labels
- Bar offset for labels - enter number of bars to shift the position of labels (+ to the right)
-----------------Alerts-----------------
- Show alerts? - if Yes alert is shown when price crosses pivot level, if false non alerts are displayed
- Send push notification when price crosses levels? - if true notification is sent to your mobile when price crosses pivot level
------------Day open level------------
- Show day open level? - if Yes day open line is shown
- Day open line color - choose line color from dropdown menu
- Day open line width - enter number for line thickness
- Day open line style - choose line style from dropdown menu
In the indicators Colors menu you can also change lines color, width and style.
In version 1.10 option to show day open level added. In inputs menu you can choose color, width and line style.